. 2015 Mar 2;125(3):1111-23.
doi: 10.1172/JCI77088. Epub 2015 Feb 2.

FOXP3+ regulatory T cell development and function require histone/protein deacetylase 3

FOXP3+ regulatory T cell development and function require histone/protein deacetylase 3

Liqing Wang et al. J Clin Invest. .

Erratum in

Abstract

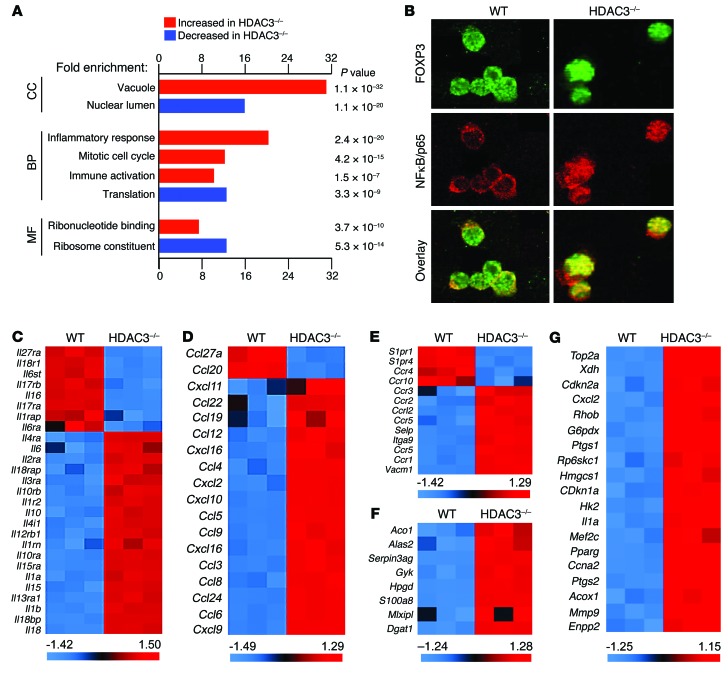
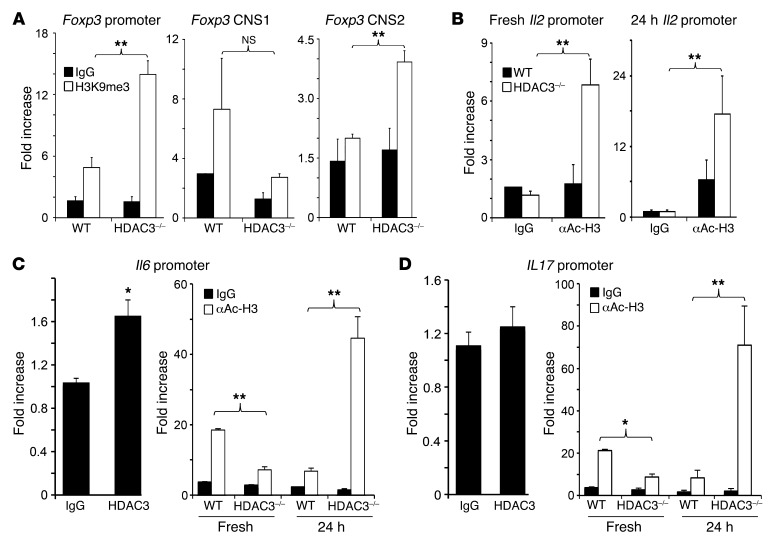
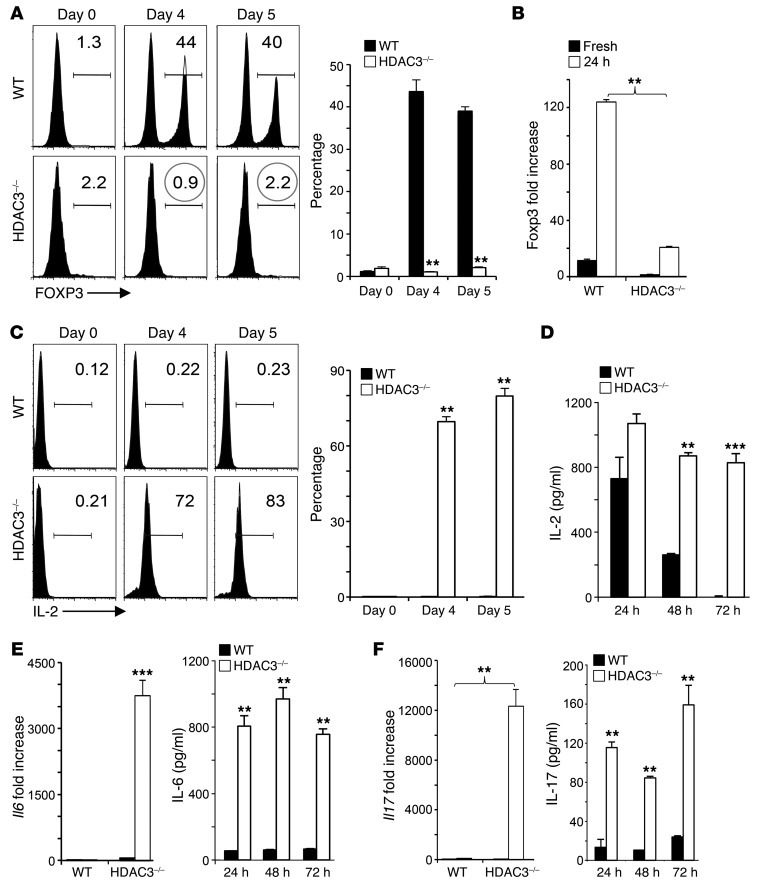
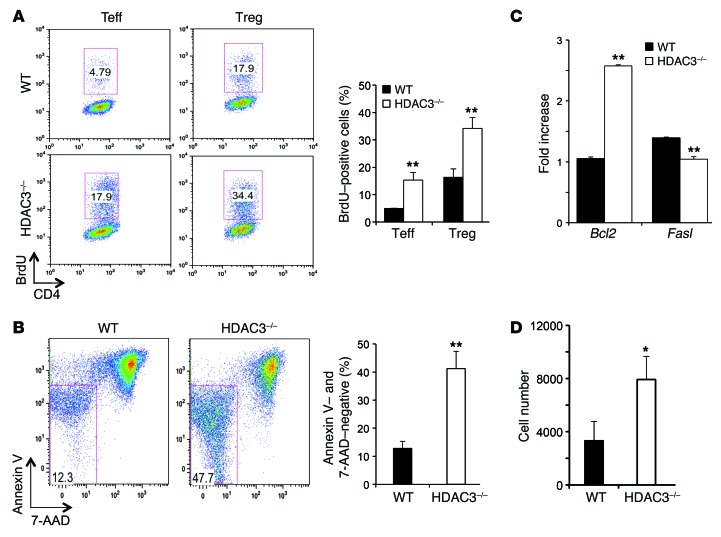
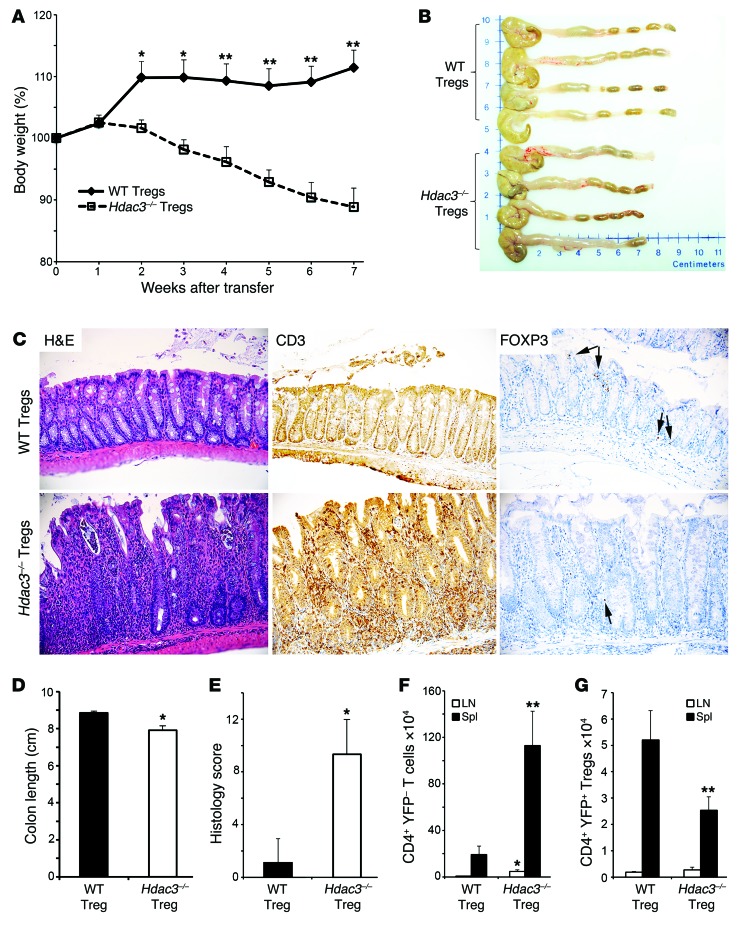
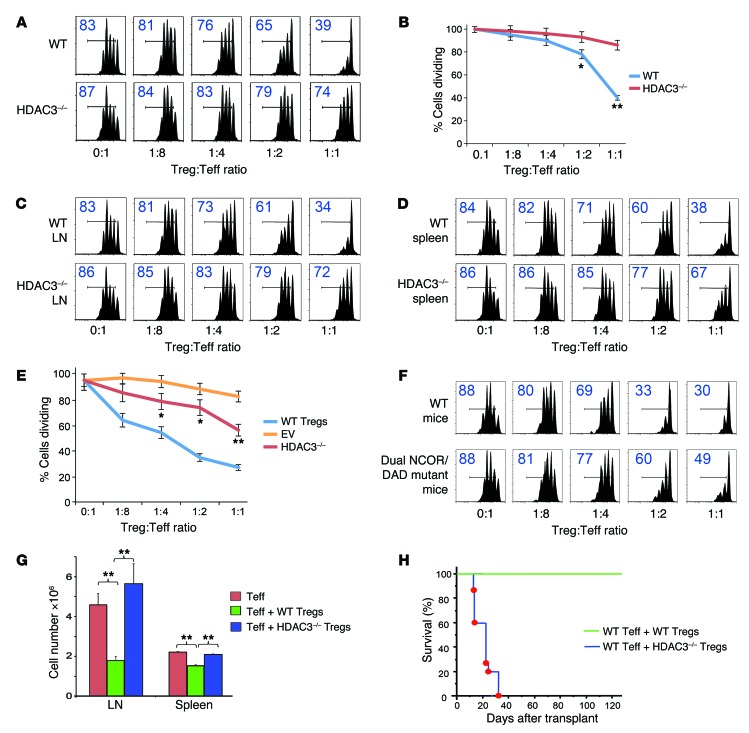
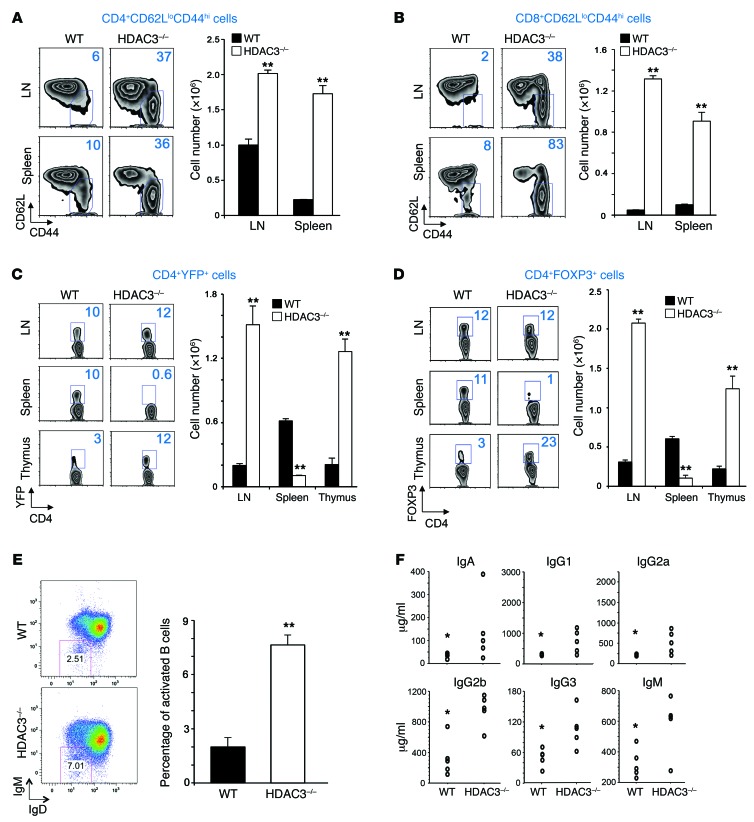
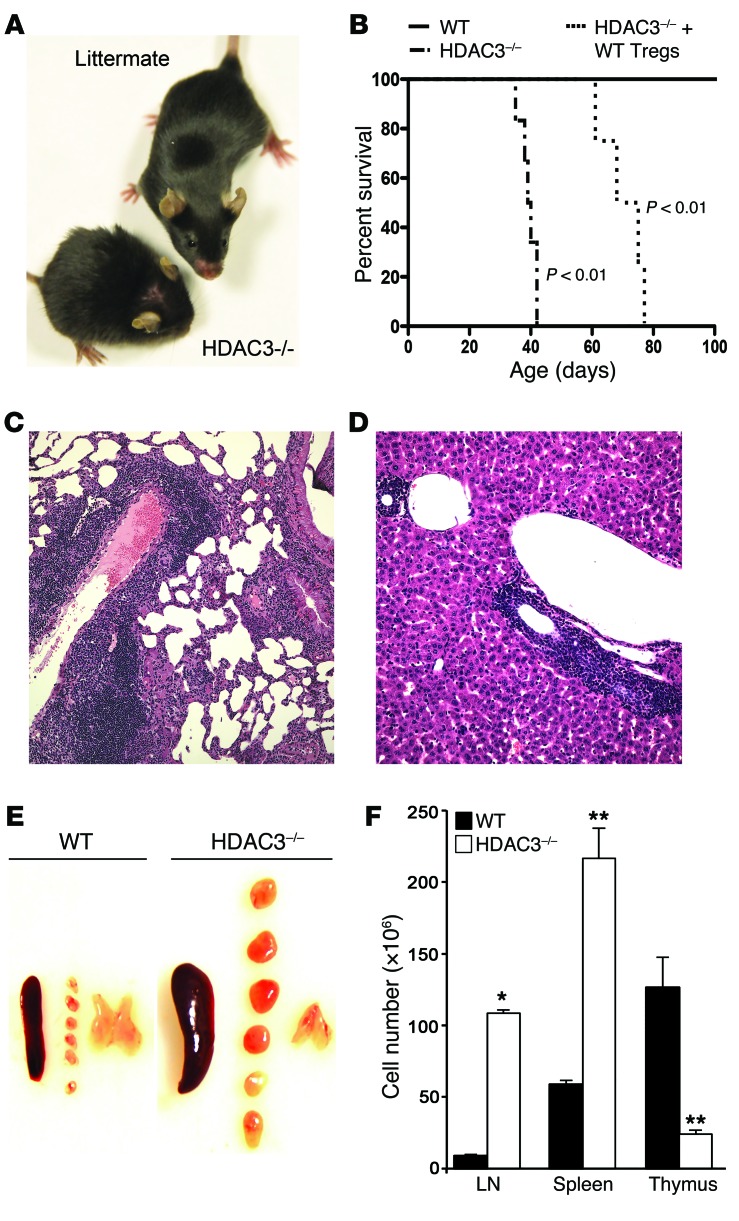
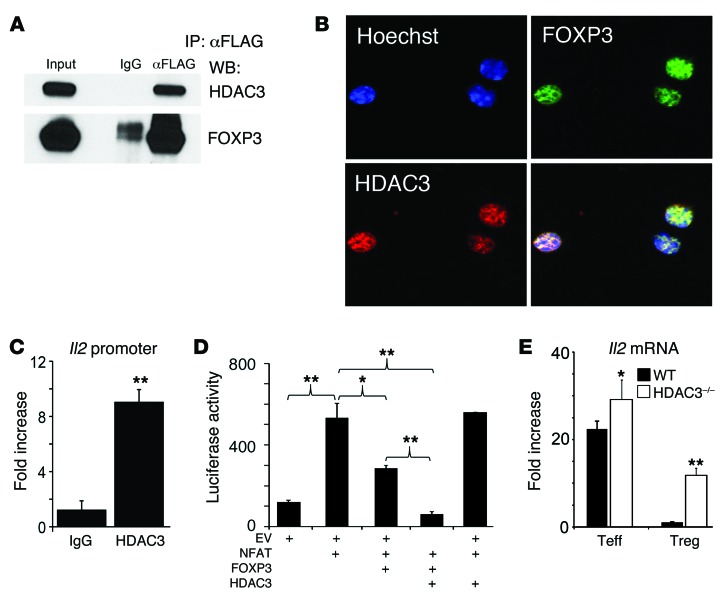
Treg dysfunction is associated with a variety of inflammatory diseases. Treg populations are defined by expression of the oligomeric transcription factor FOXP3 and inability to produce IL-2, a cytokine required for T cell maintenance and survival. FOXP3 activity is regulated post-translationally by histone/protein acetyltransferases and histone/protein deacetylases (HDACs). Here, we determined that HDAC3 mediates both the development and function of the two main Treg subsets, thymus-derived Tregs and induced Tregs (iTregs). We determined that HDAC3 and FOXP3 physically interact and that HDAC3 expression markedly reduces Il2 promoter activity. In murine models, conditional deletion of Hdac3 during thymic Treg development restored Treg production of IL-2 and blocked the suppressive function of Tregs. HDAC3-deficient mice died from autoimmunity by 4-6 weeks of age; however, injection of WT FOXP3+ Tregs prolonged survival. Adoptive transfer of Hdac3-deficient Tregs, unlike WT Tregs, did not control T cell proliferation in naive mice and did not prevent allograft rejection or colitis. HDAC3 also regulated the development of iTregs, as HDAC3-deficient conventional T cells were not converted into iTregs under polarizing conditions and produced large amounts of IL-2, IL-6, and IL-17. We conclude that HDAC3 is essential for the normal development and suppressive functions of thymic and peripheral FOXP3+ Tregs.


Figures

Figure 9
Figure 9. Effects of Hdac3 deletion on gene expression in FOXP3+ Tregs.
(A) Functional annotation of microarray data. CC, cellular component; BP, biological process; MF, molecular function. (B) Immunofluorescence localization of NF-κB/p65 and FOXP3 (original magnification, ×200, representative of 3 independent experiments). Heat maps of microarray data associated with (C) cytokines and cytokine receptors, (D) chemokines, (E) chemokine receptors and adhesion molecules, and genes altered in Tregs (F) but not in other cell types when Hdac3 was deleted, or (G) genes also altered in other cell types when Hdac3 was deleted.
Figure 8
Figure 8. Hdac3 expression affects chromatin remodeling at Foxp3, Il2, Il6, and Il17 promoters of T cells cultured under iTreg polarizing conditions.
(A) ChIP assay of Foxp3 promoter (left) and CNS1 (middle) and CNS2 (right) with anti–histone H3K9me3 antibody pull-down. (B) ChIP analysis of acetylated histone H3 (αAC-H3) at the Il2 promoter (left, unstimulated and right, after 24 hours polarization). (C) ChIP detection of Il6 promoter with anti-HDAC3 antibody pull-down (left) and ChIP for acetylated histone H3 level at the Il6 promoter (right). (D) ChIP for the Il17 promoter with anti-HDAC3 antibody pull-down (left) and ChIP for acetylated histone H3 at the Il17 promoter. Data are shown as mean ± SD, 4–6 samples/group, Student’s t test for unpaired data; *P < 0.05 and **P < 0.01 vs. WT control.
Figure 7
Figure 7. Hdac3 is required for iTreg development.
All panels represent conventional WT or Hdac3–/– T cells cultured under Treg polarizing conditions and studied serially, as indicated. (A) Serial Foxp3 staining, with representative (left) and cumulative data (right) of FOXP3+ cells. (B) Foxp3 mRNA expression after 24 hours polarization. (C) Serial IL-2 staining, with representative (left) and cumulative data (right) of IL-2+ cells. (D) Serial ELISA measurement of IL-2 protein levels. (E) IL-6 gene expression (left) and protein levels (ELISA) (right). (F) IL-17 gene expression (left) and protein levels (ELISA). Data are shown as mean ± SD, 4–6 samples/group, Student’s t test for unpaired data; **P < 0.01 and ***P < 0.001 vs. WT control.
Figure 6
Figure 6. Hdac3 deletion does not affect Treg proliferation or apoptosis.
(A) BrdU+ cells 3 days after injection of BrdU into WT or Hdac3–/– mice, with percentages (left) and absolute numbers (right) of labeled cells. (B) Assessment of apoptosis after TCR stimulation (24 hours), with percentages (left) and absolute numbers (right) of double-negative (Annexin V, 7-AAD) viable cells. (C) Bcl2 and Fasl mRNA expression in Tregs activated in vitro for 24 hours with CD3/CD28 beads (1:1 ratio, qPCR, 4/group). (D) Treg survival in vivo. 0.1 × 10⁶ WT or Hdac3–/– Tregs (Thy1.2+) isolated by cell sorting were injected into Thy1.1+ mice and numbers of Foxp3+Thy1.2+ cells determined by flow cytometry at 1 week. Data are shown as mean ± SD, 4–6 samples/group, Student’s t test for unpaired data; *P < 0.01 and **P < 0.001 vs. WT control.
Figure 5
Figure 5. Hdac3 deletion impairs Treg function in an adoptive transfer model of colitis (2:1 ratio of Tcon cells to Tregs).
(A) In contrast to WT Tregs, transfer of Hdac3–/– Tregs could not prevent the development of colitis. (B) Macroscopic appearance of colons from mice receiving WT or Hdac3–/– Tregs. (C) Histologic comparisons (original magnification, ×200) of colons in mice receiving WT or Hdac3–/– Tregs show that the latter have transmural thickening, loss of goblet cells and dense infiltrates, increased CD3+ cells, but a paucity of Tregs (arrows). Compared with mice receiving WT Tregs, mice receiving Hdac3–/– Tregs had (D) shortened colons; (E) greater histologic scores of colitis; (F) higher numbers of conventional T cells within lymph nodes and spleens (Spl), but (G) fewer YFP+FOXP3+ Tregs at these sites. Studies involved 9 mice/group, mean ± SD, with analysis by 1-way ANOVA with corresponding Tukey’s multiple comparison test (A) or Student’s t test for unpaired data (DG); *P < 0.05, **P < 0.01 vs. WT control.
Figure 4
Figure 4. Hdac3 deletion impairs Treg function in vitro and in vivo.
(AF) In vitro experiments. (A) Treg suppression assay using pooled Tregs from lymph nodes and spleens of WT and HDAC3–/– mice, with representative data shown in A, along with the percentage of proliferating cells in each panel; pooled data (4 mice/group) are shown in B. Corresponding in vitro Treg assays using purely (C) lymph node Tregs and (D) splenic Tregs. (E) Retroviral transduction of Hdac3 significantly improved Hdac3–/– Treg function compared with empty vector transduction. (F) Treg suppression assay using Tregs from mice with mutations of DADs in both NCoR1 and SMRT/NCoR2. (G and H) In vivo experiments. (G) Contrasting effects of WT and Hdac3–/– Tregs on the extent of homeostatic proliferation at 7 days after adoptive transfer of WT Teffs injected into Rag1–/– mice. (H) Contrasting survival of BALB/c hearts transplanted into C57BL/6 Rag1–/– mice and adoptively transferred with 1 × 10⁶ C57BL/6 Teffs and 0.5 × 10⁶ WT or Hdac3–/– C57BL/6 Tregs (Kaplan-Meier plots, 6 allo­grafts/group). Each experiment in AG was run in triplicate and repeated at least 3 times, and results of 1 representative experiment are shown; mean ± SD, 1-way ANOVA with corresponding Tukey’s multiple comparison test; *P < 0.05 and **P < 0.01 vs. WT control.
Figure 3
Figure 3. Hdac3 deletion in FOXP3+ Tregs causes activation of conventional T and B cells.
Compared with WT controls, mice whose Tregs lack Hdac3 show expansion of (A) CD4+CD62LloCD44hi cells and (B) CD8+CD62LloCD44hi cells in lymph nodes and spleens, with representative plots (left) and absolute numbers (right) in each panel; lymph node and thymic (C) YFP+ and (D) FOXP3+ cell populations, with representative plots (left) and absolute numbers (right) in each panel; (E) activated lymph node and splenic CD19+ B cells (IgMloIgDlo), with representative plots (left) and percentages (right); and (F) all main immunoglobulins. Data are shown as mean ± SD, 6–8 mice/group, Student’s t test for unpaired data; *P < 0.05 and **P < 0.01 vs. WT control.
Figure 2
Figure 2. Hdac3 deletion in FOXP3+ Tregs causes lethal autoimmunity.
Data in all panels except B are from 6–8 mice/group studied at 4 weeks of age. (A) Typical littermate and HDAC3–/– mice. (B) Early death of HDAC3–/– mice unless they received adoptive transfer of 1 × 10⁶ WT Tregs (6–8 mice/group, Kaplan-Meier plots followed by log-rank test). (C) Lung infiltrates and (D) portal infiltrates in livers of HDAC3–/– mice (original magnification, ×200). (E) Comparison of spleen, lymph nodes, and thymus of WT and HDAC3–/– mice. (F) Cellularity of lymph nodes (LN), spleen, and thymus of WT and HDAC3–/– mice (mean ± SD, 6–8 mice/group, Student’s t test for unpaired data; *P < 0.05, **P < 0.01).
Figure 1
Figure 1. HDAC3 is required for suppression of IL-2 production in Tregs.
(A) Co-immunoprecipitation of HDAC3 and FOXP3 proteins from 293T cells transfected with FLAG-tagged HDAC3 and FOXP3 constructs. (B) Colocalization of HDAC3 and FOXP3 within the nuclei of WT Tregs (original magnification, ×400). (C) ChIP assay showing recruitment of HDAC3 to the Il2 promoter. (D) Il2 promoter–driven luciferase activity in 293T cells transfected with empty vector (EV) or vectors for NFAT, FOXP3, and HDAC3, as shown. (E) Il2 gene expression (qPCR) in conventional Teffs and Tregs. In CE, mean ± SD, n = 4/group, with statistical analysis using Student’s t test for unpaired data in C and E, and Kruskal-Wallis with Dunn’s multiple comparison test for D; *P < 0.05 and **P < 0.01 for the indicated comparisons, and versus WT in E.

Comment in

Similar articles

Cited by

References

    1. Samstein RM, et al. Foxp3 exploits a pre-existent enhancer landscape for regulatory T cell lineage specification. Cell. 2012;151(1):153–166. doi: 10.1016/j.cell.2012.06.053. - DOI - PMC - PubMed
    1. Rudra D, et al. Transcription factor Foxp3 and its protein partners form a complex regulatory network. Nat Immunol. 2012;13(10):1010–1019. doi: 10.1038/ni.2402. - DOI - PMC - PubMed
    1. Shevach EM. Biological functions of regulatory T cells. Adv Immunol. 2011;112:137–176. doi: 10.1016/B978-0-12-387827-4.00004-8. - DOI - PubMed
    1. Ohkura N, Kitagawa Y, Sakaguchi S. Development and maintenance of regulatory T cells. Immunity. 2013;38(3):414–423. doi: 10.1016/j.immuni.2013.03.002. - DOI - PubMed
    1. Riley JL, June CH, Blazar BR. Human T regulatory cell therapy: take a billion or so and call me in the morning. Immunity. 2009;30(5):656–665. doi: 10.1016/j.immuni.2009.04.006. - DOI - PMC - PubMed

Publication types