. 2015 Mar;16(3):258-66.
doi: 10.1038/ni.3098. Epub 2015 Feb 2.

αβ T cell antigen receptor recognition of CD1a presenting self lipid ligands

Affiliations

αβ T cell antigen receptor recognition of CD1a presenting self lipid ligands

Richard W Birkinshaw et al. Nat Immunol. 2015 Mar.

Abstract

A central paradigm in αβ T cell-mediated immunity is the simultaneous co-recognition of antigens and antigen-presenting molecules by the αβ T cell antigen receptor (TCR). CD1a presents a broad repertoire of lipid-based antigens. We found that a prototypical autoreactive TCR bound CD1a when it was presenting a series of permissive endogenous ligands, while other lipid ligands were nonpermissive to TCR binding. The structures of two TCR-CD1a-lipid complexes showed that the TCR docked over the A' roof of CD1a in a manner that precluded direct contact with permissive ligands. Nonpermissive ligands indirectly inhibited TCR binding by disrupting the TCR-CD1a contact zone. The exclusive recognition of CD1a by the TCR represents a previously unknown mechanism whereby αβ T cells indirectly sense self antigens that are bound to an antigen-presenting molecule.


Figures

Figure 1
Figure 1
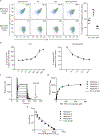
BK6 TCR-CD1a autoreactivity and mass spectrometry analyses of CD1a-Ag complex. (a) BK6.Jurkat cells or control MR1 restricted Jurkat cells were labeled with CD1a-endo tetramer. Cells were gated for similar levels of GFP expression and Mean Fluorescence Intensity (MFI) of CD1a tetramer is shown in the upper right corner. FACS plots are representative of at least 6 independent experiments. (b) Size exclusion chromatography of soluble BK6 TCR alone (red curve), soluble CD1a alone (pink curve) and a mix of soluble TCR and CD1a (blue curve). The formation of CD1a-BK6 TCR ternary complex is indicated by fractions between the dashed black lines of the blue curve. CD1a that was not complexed to BK6 TCR is shown between the solid black lines of the blue curve. (c-d) Unfractionated CD1a proteins (Supplementary Fig. 2a) and CD1a-TCR complexes from chromatography as well as CD1d-α-GalCer-NKT TCR (CD1d-TCR) prepared using similar methods and normalized to input CD1 protein. Eluents using a mixture of organic solvents were analysed using (c) positive and negative mode nanospray ion trapping MS or (d) normal phase high performance liquid chromatography quadrupole time of flight (HPLC-QToF-MS), which detected more than 1,200 distinct accurate mass and retention time values (AMRT) that spanned broad retention time values. Data for b-d are representative for 2 independent experiments.
Figure 2
Figure 2
Identification of lipid antigens from CD1a by mass spectrometry. (a) After excluding multiple adducts and ions with isotope ratios or mass intervals that are atypical for lipids, analysis focused on detecting lipids that bound to CD1a-TCR (permissive ligands) or those detected selectively from CD1a that was not exposed to TCR (non-permissive ligands). (b-c) We solved the structures of representative lipids by (b) HPLC-QToF MS in the negative mode by comparison of retention times to authentic standards, and by (c) nanospray CID-MS (Supplemental Fig. 6). The different m/z values detected in HPLC-QTof-MS (b, m/z 880.61 and m/z 857.67 were detected as HCOO- adducts) and nanospray MS (c, 870.6 and 847.6 were detected as chloride adducts) are explained by different ion-adduct forming in two monitoring systems. Counts are the number of detector activation events within the defined mass window. All data are representative of 2 independent experiments
Figure 3
Figure 3
Lipids presented by CD1a modulate BK6 TCR interactions. (a) BK6.Jurkat cells or control MR1 restricted Jurkat cells were labelled with CD1a-endo tetramers or tetramers loaded with PC, LPC and SM. PC and SM CD1a tetramers were loaded with a 1:6 protein: lipid molar ratio. LPC CD1a tetramers were loaded with 1:50 protein: lipid molar ratio. Cells were gated for similar levels of GFP expression and Mean Fluorescence Intensity (MFI) of CD1a tetramer is shown in the upper right corner. FACS plots are representative of 6 independent experiments and all data shown as % change relative to CD1a-endo (right) (b) BK6.Jurkat cells were labelled with CD1a tetramer loaded with increasing ratios of either LPC (left graph) or SM (right graph). Data points show MFI relative to CD1a endogenous tetramer that is designated 100%. Graphs show the mean percentage (+/− standard error of the mean) from 2–6 independent experiments. (c) BK6 TCR affinity for CD1a-endo expressed in HEK293S determined by SPR, showing a representative SPR sensorgram, (d) binding curve and (e) associated Scatchard plot of all data. Experiments were performed with 3000 response units of CD1a-endo bound to the SA-chip. Results were from two independent preparations of the BK6 TCR, with each independent preparation of BK6 TCR performed in duplicate (n=4). All data are individually represented for the binding curve and Scatchard plot, with associated fits to all data.
Figure 4
Figure 4
BK6 binds to CD1a independent of direct antigen contact. Representation of the BK6 TCR-CD1a-LPC (a, c, e) and BK6 TCR-CD1a-endo (b, d, f) complex crystal structures showing (a, b) the overall docking mode, (c, d) positioning of the BK6 TCR CDR loops and variable domain centres of mass over the CD1a Ag-binding cleft, (e, f) structural footprint of BK6 on the A’-roof surface of CD1a and (g) comparison of BK6 TCR CDR loop conformation changes up engagement with CD1a. CD1a is shown ribbon representation with green for the CD1a-LPC and pale green for CD1a-endo ternary complexes with BK6 with β2m shown in cyan ribbon. Semi-transparent surface representations of the CD1a ternary complexes are shown in white for CD1a-LPC and grey for CD1a-endo. Lipids are shown in stick format colored according to atom type with carbons in cyan for LPC and salmon pink for endo. BK6 TCR is colored in blue for α-chain and orange for β-chain with CDR1α teal, CDR2α pink, CDR3α yellow, CDR1β orange, CDR2β red and CDR3β slate blue; centre of mass for variable chains are indicated by black spheres. The α1-helix (α1), α2-helix (α2), TCR constant (Cα, Cβ) and variable (Vα, Vβ) domains are indicated.
Figure 5
Figure 5
Molecular details of the BK6 TCR-CD1a interface. (a-c) Structural representation of BK6 TCR interactions (a) TCR α-chain germline tyrosine residues interact with the CD1a α2 helix, (b) CDR3α interactions with CD1a A’-roof, (c) CDR3β interactions with A’-roof (d-e) Interactions between lipid and CD1a for (d) endo modelled as oleic acid (OLA) and (e) LPC. (f) Surface representation of the CD1a, LPC and BK6 CDR3β loop highlighting the central CD1a salt bridge blocking contact between LPC and the BK6 TCR. CD1a is represented in pale green for CD1a-endo and green for CD1a-LPC. The BK6 TCR is shown in blue for the α-chain and orange for β-chain with CDR1α in teal, CDR2α pink, CDR3α yellow and CDR3β slate blue. Lipids are in stick format colored according to atom type with cyan carbons for LPC and salmon pink carbons for oleic acid (OLA). For surface representations CD1a is shown in white, BK6 TCR CDR3β in slate and LPC lipid in cyan. The salt bridges are indicated in purple by dashed lines or surfaces.
Figure 6
Figure 6
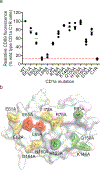
Mutational analysis defining key interactions between the BK6 TCR and CD1a. (a) C1R cells were transduced with either wild type CD1a or a series of mutant CD1a molecules where surface exposed amino acids lining the Ag-binding groove were mutated to alanine. These cells were co-cultured with BK6 TCR transduced cells and activation measured by CD69 upregulation. Data is derived from two experiments each performed in duplicate with each measurement represented by a separate data point. (b) Alanine mutations of CD1a surface residues colored according to BK6 TCR interactions relative to wild type with no impact on binding (green), partial binding (orange) and no binding (red).
Figure 7
Figure 7
Comparison of CD1a-antigen structures from binary and ternary complexes. Representation of the (a) BK6 TCR-CD1a-LPC ternary, (b) BK6 TCR-CD1a-endo ternary, (c) CD1a-LPC binary superposed onto CD1a-LPC ternary (green). (d) CD1a-sulfatide (SLF) binary, and (e) CD1a-sphingomyelin (SM) binary and (f) CD1a-dideoxymycobactin binary crystal structures. CD1a is shown in ribbon representation with key residues indicated with stick format. Lipid antigens are shown in stick representation with the endo complex modelled with oleic acid (OLA). CD1a salt bridge interactions are indicated by purple dashed lines.

References

    1. Eckle SBG, Turner SJ, Rossjohn J, McCluskey J. Predisposed αβ T cell antigen receptor recognition of MHC and MHC-I like molecules? Current Opinion in Immunology 2013, 25(5): 653–659. - PubMed
    1. Bhati M, Cole DK, McCluskey J, Sewell AK, Rossjohn J. The versatility of the αβ T-cell antigen receptor. Protein Science 2014, 23(3): 260–272. - PMC - PubMed
    1. Rossjohn J, Gras S, Miles JJ, Turner SJ, Godfrey DI, McCluskey J. T Cell Antigen Receptor Recognition of Antigen-Presenting Molecules. Annu Rev Immunol 2014, in press. - PubMed
    1. Zinkernagel RM, Doherty PC. Restriction of in vitro T cell-mediated cytotoxicity in lymphocytic choriomeningitis within a syngeneic or semiallogeneic system. Nature 1974, 248(450): 701–702. - PubMed
    1. Brigl M, Brenner MB. CD1: Antigen Presentation and T Cell Function. Annu Rev Immunol 2004, 22: 817–890. - PubMed

Publication types