. 2015 Mar;16(3):296-305.
doi: 10.1038/ni.3095. Epub 2015 Feb 2.

Class-switched memory B cells remodel BCRs within secondary germinal centers

Affiliations

Class-switched memory B cells remodel BCRs within secondary germinal centers

Louise J McHeyzer-Williams et al. Nat Immunol. 2015 Mar.

Abstract

Effective vaccines induce high-affinity memory B cells and durable antibody responses through accelerated mechanisms of natural selection. Secondary changes in antibody repertoires after vaccine boosts suggest progressive rediversification of B cell receptors (BCRs), but the underlying mechanisms remain unresolved. Here, the integrated specificity and function of individual memory B cell progeny revealed ongoing evolution of polyclonal antibody specificities through germinal center (GC)-specific transcriptional activity. At the clonal and subclonal levels, single-cell expression of the genes encoding the costimulatory molecule CD83 and the DNA polymerase Polη segregated the secondary GC transcriptional program into four stages that regulated divergent mechanisms of memory BCR evolution. Our studies demonstrate that vaccine boosts reactivate a cyclic program of GC function in class-switched memory B cells to remodel existing antibody specificities and enhance durable immunological protection.


Figures

Figure 1
Figure 1. Switched-memory B cells form robust secondary germinal centers
(a) Representative flow cytometric analysis of class-switched (IgMIgD) antigen-specific (λ1+ NP+) B cells (CD3Gr1CD19+) in draining lymph nodes before and 70 days after NP-KLH priming, 4 and 8 days after antigen boost with adjuvant, as indicated. Numbers in gates indicate mean ± sem percentage. Antigen-specific secondary GC B cells (CD38-GL7+) express Bcl-6 and not CD62L. (b) Numbers of class-switched and GC phenotype antigen-specific B cells after prime and boost, with and without adjuvant. Bars graphs indicate mean ± sem (ND: not detected). The fold increase over day 70 memory cells is indicated above each boost condition (black bars). N = 5-10 individual mice for each timepoint. (c) Immunofluorescence for IgD, CD21/35, AID, Bcl6 and CD4 as indicated across two serial sections 8 days after soluble boost (50μm scale bar). (d) Flow cytometric analysis of KLH-specific B cells and NP-specific B cells in draining lymph nodes of adjuvant only primed control animals at day 4, and at day 8 after adjuvant NPKLH boost. GC B cells (B220+ CD138- CD38- GL7+) were identified as shown within KLH-specific (upper) and NP-specific (lower) class-switched B cells in boosted animals as indicated. Mean percent of parent gate is indicated. (e) Total class-switched KLH-specific B cells (upper) and KLH-specific GC B cells (lower) in draining lymph nodes of control animals (unimmunized or 4 days adjuvant only immunization) and NP-KLH immunized animals at the indicated days after prime or boost, with (adj) or without adjuvant (sol) for the boost. Bar graphs show mean ± sem (ND: not detected), n=3.
Figure 2
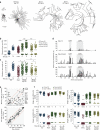
Figure 2. Switched BCR diversification and secondary GC transcription
C57BL/6 mice were immunized with NP-KLH in adjuvant and draining lymph nodes analyzed 14 and 70 days after priming and 4 and 8 days after antigen boost with adjuvant and without adjuvant (sol). Single class-switched (IgDIgM) antigen-specific specific (λ1+NP+) memory (CD38+GL7) and GC (CD38GL7+) B (CD3Gr1CD19+ B220+) cells were isolated for VH186.2 focused BCR repertoire analysis and single cell multiplex qPCR. (a) Primary day 14 GC, day 70 memory, and GC cells day 4 and 8 following boost circular phylograms displaying near-neighbor sequence alignment and clonal relatedness (n=56; 75, 93 and 133 single cells respectively; same scale for each phylogram). Displayed is (b) distance from root sequence, (c) number of mutations per single cell (n=56, 83, 75, 110, 133, 89 and 60 respectively) and (d) aa substitutions across VH186.2 gene segment. (e) Single cell 96-plex RT-qPCR on isolated antigen-specific memory and GC B cells with comparisons across populations for percent positive cells and (f) levels per cell using reference value of 30-CT value converted as described in methods to establish baseline of 1.0 for all assays. (b), (c) and (f) each symbol represents signal from an individual cell, black bar indicates mean. *p<0.05 **p<0.01 ***p<0.001, Mann-Whitney test.
Figure 3
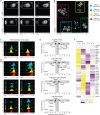
Figure 3. Cd83 and Polh expression assorts four cyclic stages of GC activity
(a) Probability contours of single cell gene expression for Cd79b, Bcl6, Aicda, Mki67, Polh, Cd83 and Cxcr4 in GC B cells (day 4 and day 8, n=372). (b) These data are combined and clustered in a two-dimensional display using t-distributed stochastic neighbor embedding (t-SNE) that describes 4 major sub-groups labeled stage 1-4 that tightly overlap with (c) distribution of Cd83 and Polh. (d) Distribution of Cxcr4 and Mki67 used for initial tSNE clustering and Il21r, Slamf1, E2a and Foxo1 based on the t-SNE gates defined above. (e) “Volcano” plots highlighting the gene expression differences in successive t-SNE-defined stages according to their statistical significance (see details in Methods). (f) Heatmap representation of changes in gene expression for Cd79b, Bcl6, and select genes with an expression index change ≥1.5 and p<0.05 for that change in at least one of the transitions.
Figure 4
Figure 4. Adaptive radiation during sub-clonal BCR evolution in the GC
(a) Indexed cell sorting is depicted from day 8 boost ‘clone G’ as colored symbols for individual cells at different stages of the GC cycle overlaid on contour plots of total populations. (b) Distribution of individual cells from multiple clones from days 4 and 8 after the boost (with ≥10 members isolated) and summary of stage distribution. n=9 clones from 6 experiments, total single cells n=153. Bar graphs show mean ± sem, *p<0.05, t-test. (c) Radial phylograms for clones H and G and (d) summary dendrogram for all boost day 8 clones depicting the stage of GC cycle allocated to each member of the clone based on tSNE clustering. (e) Integrated analysis of protein levels (MFI), mRNA expression (30-CT value) and VH186.2 mutation pattern and t-SNE stage for individual GC cells from boost day 8 clone G (displayed in a-d).
Figure 5
Figure 5. De novo secondary GC formation
(a) Mice were primed with NP-KLH in MPL adjuvant, rested for 70 days before boosting with soluble NP-KLH intravenously. Flow cytometric analysis of Bcl-6 and CD38 on NP-specific B cells (λ1+ NP+ B220+ CD138- class-switched B cells) in draining and non-draining (cervical) LN 5 days after boost. Bar graphs represent mean ± sem percentage Bcl-6+CD38 GC among λ1+ NP+ B220+ CD138- class-switched B cells before boost (day 70, grey bars) and 5 days after soluble boost (+, black bars) in the draining LN (dLN) and non-draining LN (ndLN). n=3 mice per group for each timepoint. *p<0.05, two-tailed t-test. (b) In NP-KLH primed mice, GC were ablated using anti-CD40L mAb (or controls treated with hamster IgG) one week before boosting with soluble NP-KLH intravenously. NP-specific B cells in spleen were analyzed by flow cytometry as in (a) before (day 70) and 5 days after boost in control or anti-CD40L treated animals. Box number indicates percent of parent population. Bar graphs represent mean ± sem percentage GC among λ1+ NP+ B220+ CD138- class-switched B cells before boost (day 70, grey bars) and 5 days after soluble boost (+, black bars) in the spleen of hamster IgG-treated (control) and anti-CD40L-treated animals. n=3 mice per group for each timepoint. **p<0.01, ***p<0.001, two-tailed t-test.
Figure 6
Figure 6. Switched-memory B cells can form secondary GC on transfer and recall
Sorted antigen-specific IgM+ and class-switched memory B cells (NP+ CD138- B220+ CD19+ GL7- CD38+) were adoptively transferred into (a) naive WT congenic hosts and (b) naive B6.MD4 congenic hosts (class-switched group only) then recovered for analysis at day 7 after immunization with antigen in adjuvant. n=6 for IgM transfer, n=9 for class-switched memory transfer, mean±sem, (a) each symbol represents individual recipients *p < 0.05, **p < 0.01, two-tailed t-test.
Figure 7
Figure 7. Switched-memory B cells are dominant precursors for secondary GC
(a) Representative flow cytometric analysis for IgM and IgD distribution in total NP-specific B cells (CD3- Gr1- CD138- CD19+ B220+ λ1+ NP+) (left), with representative Bcl-6 and CD38 expression among class-switched (middle) and IgM+ (right) NP-specific memory B cells in draining LN 70 days after NP-KLH priming. Numbers in gates indicate mean ± sem percentage. n=3. (b) Total IgM+ NP-specific B cells (solid lines, CD3- Gr1- CD19+ or CD138+ λ1+ NP+ IgM+) and NP-specific GC B cells (dashed lines, CD138- B220+ CD38- GL7+) per draining LN at the indicated days after priming and boost with NP-KLH with (Adj, square) or without (Sol, circle) adjuvant. n=3 mice for each timepoint. (c) Sorted IgG2b+ NP-specific B cells from draining lymph nodes 5 days after primary and day 3 and 5 secondary (boost) immunization with NP-KLH in adjuvant. Three subsets of IgG2b+ NP-specific B cells (CD3-Gr1-CD19+IgD-NP+ CD138- IgG2b+) were defined based on CD38 and GL7 expression. Box indicates percentage, mean ± sem, n=3 for each timepoint. (d) Total class-switched NP-specific B220+ (CD3- Gr1- CD138- IgM- IgD- CD19+ B220+ NP+) B cells subsets (CD38+ GL7+, GC and memory, gated as in Figure1A) in draining LN at the indicated days after priming (Primary) or boosting (Boost) with NP-KLH in adjuvant. Bars indicate mean ± sem. n = 3-9 individual mice for each timepoint. (e) Assessment of recent class-switch recombination from IgM to IgG2b by PCR amplification of Cμ-Iγ2b circle transcripts in sorted 30-cell samples of the indicated subsets. Three separate experiments with a total of 12-20 samples for each phenotype and timepoint were pooled and summarized, showing the percentage of samples positive for Cμ-Iγ2b circle transcripts. Graph displays mean ± sem, n=3 mice for each timepoint, ** p<0.01, *** p<0.001, two-tailed t-test.

Comment in

References

    1. Crotty S. Follicular helper CD4 T cells (TFH). Annu Rev Immunol. 2011;29:621–663. - PubMed
    1. Fazilleau N, Mark L, McHeyzer-Williams LJ, McHeyzer-Williams MG. Follicular helper T cells: lineage and location. Immunity. 2009;30:324–335. - PMC - PubMed
    1. Victora GD, Nussenzweig MC. Germinal centers. Annu Rev Immunol. 2012;30:429–457. - PubMed
    1. MacLennan IC. Germinal centers. Annu Rev Immunol. 1994;12:117–139. - PubMed
    1. McHeyzer-Williams M, Okitsu S, Wang N, McHeyzer-Williams L. Molecular programming of B cell memory. Nat Rev Immunol. 2012;12:24–34. - PMC - PubMed

Publication types

MeSH terms