. 2015 Mar;16(3):286-95.
doi: 10.1038/ni.3099. Epub 2015 Feb 2.

IL-1 signaling modulates activation of STAT transcription factors to antagonize retinoic acid signaling and control the TH17 cell-iTreg cell balance

Affiliations

IL-1 signaling modulates activation of STAT transcription factors to antagonize retinoic acid signaling and control the TH17 cell-iTreg cell balance

Rajatava Basu et al. Nat Immunol. 2015 Mar.

Abstract

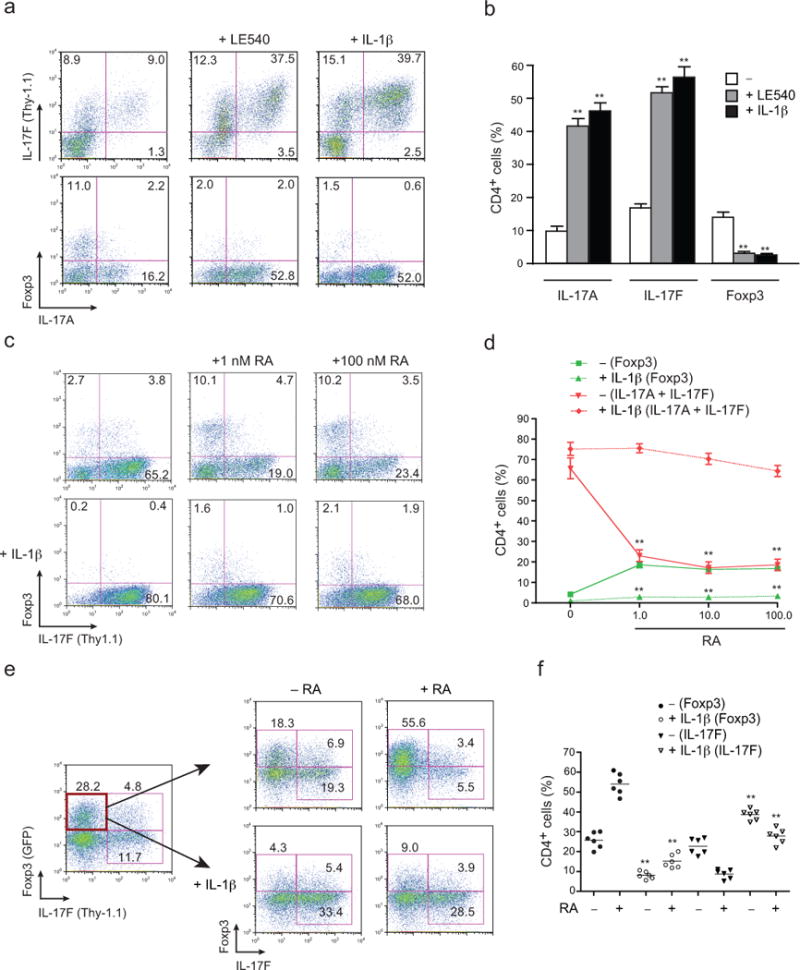
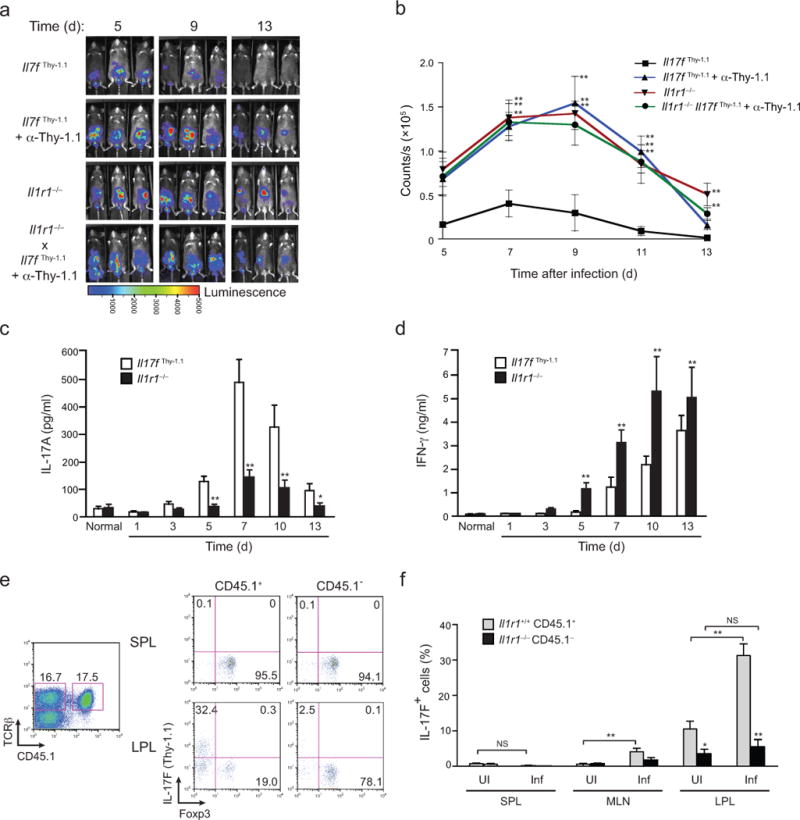
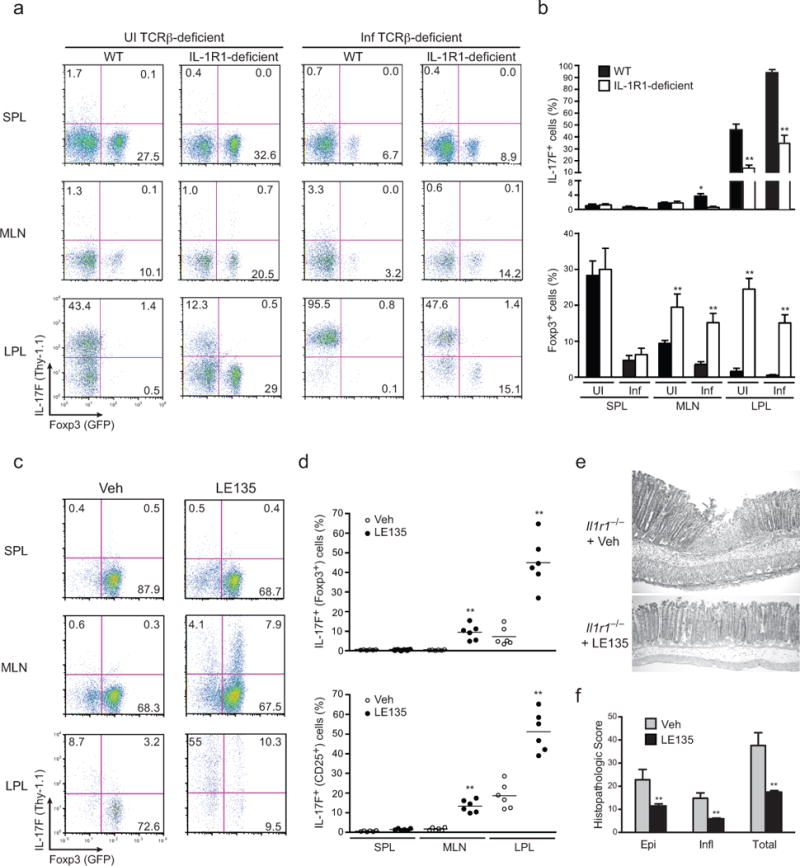
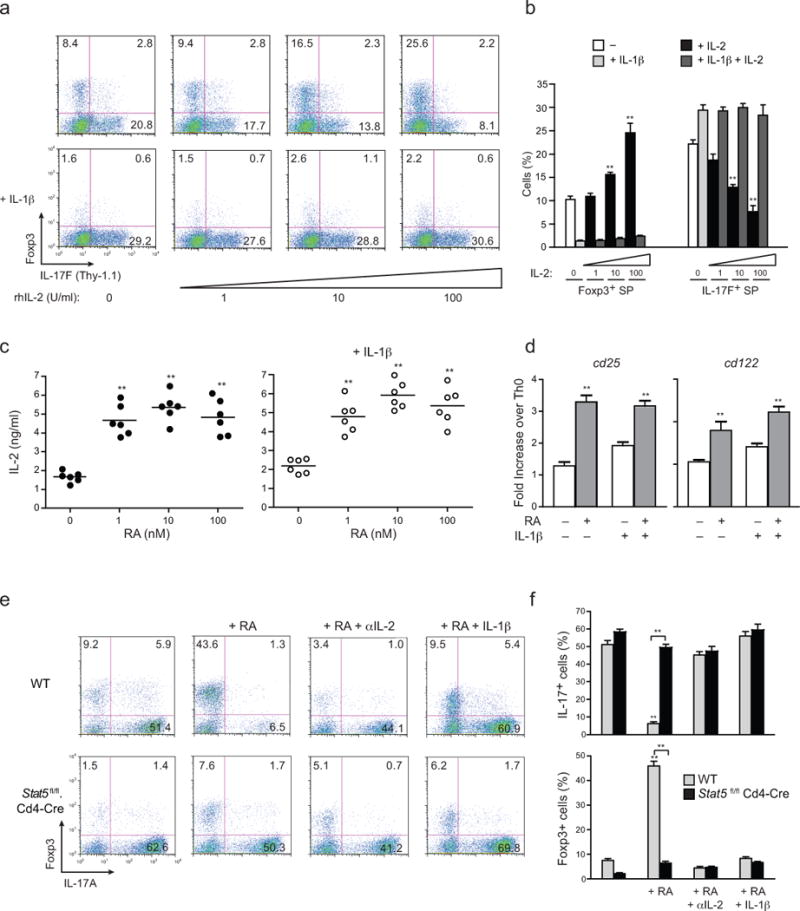
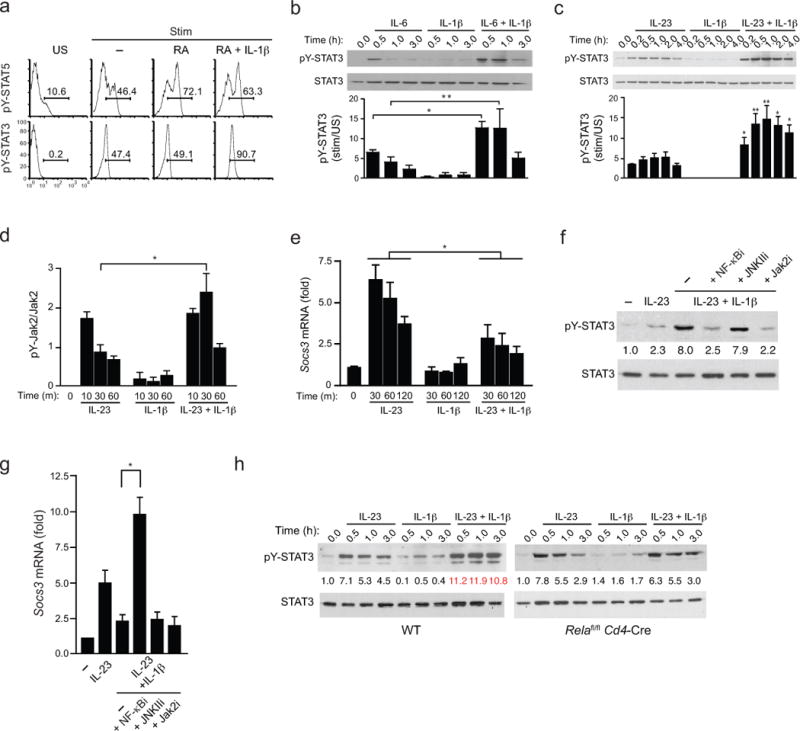
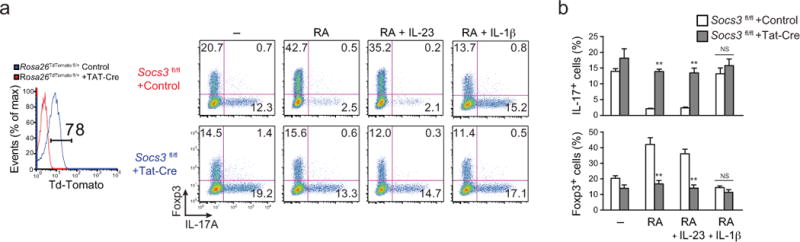
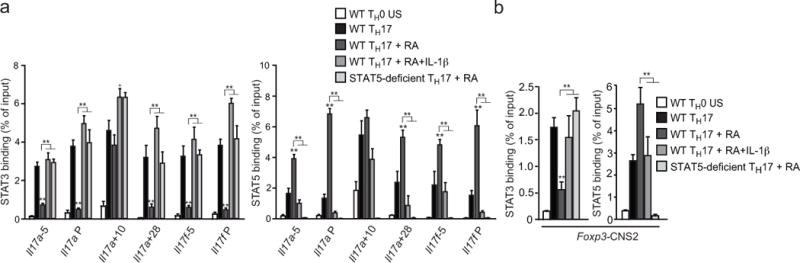
Interleukin 17 (IL-17)-producing helper T cells (TH17 cells) and CD4(+) inducible regulatory T cells (iTreg cells) emerge from an overlapping developmental program. In the intestines, the vitamin A metabolite retinoic acid (RA) is produced at steady state and acts as an important cofactor to induce iTreg cell development while potently inhibiting TH17 cell development. Here we found that IL-1 was needed to fully override RA-mediated expression of the transcription factor Foxp3 and induce protective TH17 cell responses. By repressing expression of the negative regulator SOCS3 dependent on the transcription factor NF-κB, IL-1 increased the amplitude and duration of phosphorylation of the transcription factor STAT3 induced by TH17-polarizing cytokines, which led to an altered balance in the binding of STAT3 and STAT5 to shared consensus sequences in developing T cells. Thus, IL-1 signaling modulated STAT activation downstream of cytokine receptors differently to control the TH17 cell-iTreg cell developmental fate.


Figures

FIGURE 1
FIGURE 1. IL-1β counteracts RA-dependent inhibition of TH17 cell development
(a) Naïve CD4+ T cells (CD4+CD25CD62Lhi CD44lo) from Il17fthy1.1 mice were activated with soluble anti-CD3 on DCs isolated from mesenteric lymph nodes (MLNs) of IL-1β–deficient (Il1b−/−) mice under TH17 polarizing conditions, with the indicated additions of an at-RA inhibitor (LE540; 1 μM) or IL-1β (20 ng/ml). Cells recovered on day 4 were stained for surface CD4 and Thy1.1 (IL-17F), and intracellular IL-17A and Foxp3, and analyzed by flow cytometry. Numbers are percentages of cells in each quadrant. (b) Pooled data from a showing frequencies of IL-17A, IL-17F (Thy1.1) and Foxp3 single producers among CD4+ T cells. (c) Expression of Thy1.1 (IL-17F) and Foxp3 from naïve CD4+ T cells from Il17fthy1.1 mice activated with soluble anti-CD3 and Il1b−/− DCs under TH17 polarizing conditions with or without IL-1β, in presence or absence of indicated concentration of at-RA at day 4. (d) Pooled data from c showing total frequencies of IL-17A–, IL-17F (Thy1.1)– and Foxp3–expressing CD4+ T cells. (e) Naïve CD4+ T cells from Il17fthy1.1.Foxp3gfp mice were activated with plate-bound anti-CD3 and soluble anti-CD28 under TH17 polarizing conditions. On day 4 of primary culture the Thy1.1GFP+ fraction of cells were sorted by flow cytometry and further cultured under TH17 conditions with or without IL-1β (20 ng/ml), in the presence or absence of at-RA (1 nM). On day 4 of secondary culture, frequencies of IL-17F (Thy1.1) versus Foxp3-GFP+ cells were determined after surface staining of Thy1.1 (IL-17F) and flow cytometry. Numbers are percentages of cells in the each quadrant. (f) Pooled data from secondary cultures from e showing frequencies of Foxp3+ (GFP) and IL-17F+ (Thy1.1) CD4+ T cells. Data are representative of one of three similar independent experiments (a); pooled from three independent experiments with nine samples (n = 9) per group (b); representative of one of three similar independent experiments (c); pooled from three experiments with twelve samples (n = 12) per group (d); representative of one of two independent experiments (e); or pooled from two independent experiments with six samples (n = 6) per group (f). Data are means and s.e.m. in b,d,f. **P < 0.01 (two-tailed unpaired t-test).
FIGURE 2
FIGURE 2. IL-1R signaling is required for host-protective TH17 and Treg–TH17 cell balance in vivo
(a) Serial whole-body imaging of untreated Il17fthy1.1 mice, Il17fthy1.1 mice treated with depleting anti-Thy1.1 mAb or Il1r1−/− mice or Il1r1−/− mice treated with depleting anti-Thy1.1 mAb after inoculation with luminescent strain of C. rodentium and imaged at the indicated days post infection. (b) Colonization kinetic data from a represented as counts/sec at different time points post-infection with C. rodentium. (c,d) Quantitative ELISA of IL-17A (c) and IFNγ (d) in supernatants from cultured homogenates of colonic tissue collected from Il17fthy1.1 and Il1r1−/− mice at the indicated times after inoculation with C. rodentium. (e) 3 × 10⁶ of donor Il1r1+/+.Il17fthy1.1 (CD45.1/CD45.2) and Il1r1−/−.Il17fthy1.1 (CD45.2) CD4+ T cells were mixed and co-transferred to recipient Tcrb−/− mice that were either uninfected or infected with C. rodentium 2 weeks post-reconstitution (see Supplementary Fig. 2d for schematic). Seven days later, expression of Thy1.1 (IL-17F) and intracellular Foxp3 by CD45.1+ and CD45.1 splenic lymphocyte (SPL) and colonic lamina propria lymphocytes (LPL) from reconstituted recipient Tcrb−/− mice was analyzed (gated on activated CD4+ T cells). Numbers in each quadrant indicate the frequency of cells. Single plot represents equal frequencies of Il1r1+/+ and Il1r1−/− TCRβ+ cells within reconstituted mice. (f) Frequencies of IL-17F (Thy1.1) cells in Il1r1+/+ CD45.1+ and Il1r1−/− CD45.1 populations of SPL, MLN and LPL of uninfected and infected recipient Tcrb−/− mice. Data are: representative of one of two similar independent (Il1r1−/− mice treated with depleting anti-Thy1.1 mAb) or one of three similar independent experiments (Il17fthy1.1 mice, Il17fthy1.1 mice treated with depleting anti-Thy1.1 mAb or Il1r1−/− mice) a; pooled from two or three independent experiments with nine to eleven mice per group b; from two independent experiments with six mice per group c,d; representative of one of two similar independent experiments e; or pooled from two independent experiments with six mice per group f. Data are means and s.e.m. in b,c,d,f. N.S.= Not significant, *P < 0.05 and **P < 0.01 (two-tailed unpaired t-test).
FIGURE 3
FIGURE 3. In absence of IL-1β, in vivo blockade of RA facilitates iTreg to TH17 cell conversion during enteropathogenic bacterial infection
(a) 2.5 × 10⁶ Foxp3+IL-17F CD4+ T cells of infected donor Il1r1+/+.Il17fthy1.1.Foxp3gfp and Il1r1−/−.Il17fthy1.1.Foxp3gfp mice were collected and sorted on day 2 post-infection (PI) and transferred to recipient TCRβ–deficient (Tcrb−/−) mice that were either uninfected or infected with C. rodentium 2 days before (see Supplemental Fig. 3e for schematic). Expression of Thy1.1 (IL-17F) and Foxp3-GFP on splenic, MLN and LP isolates of uninfected recipient Tcrb−/− or d2 infected recipient Tcrb−/− was analyzed 8 days post-infection. Splenic, MLN and LP lymphocytes were isolated and analyzed without restimulation ex vivo for Thy1.1 (IL-17F) and Foxp3-GFP expression by flow cytometry after gating on TCRβ+ cells. Numbers indicate the frequencies in each quadrant. (b) Frequencies of splenic, MLN and colonic IL-17F (Thy1.1) cells and Foxp3-GFP cells as prepared in b. (c) Expression of Thy1.1 (IL-17F) and Foxp3 (GFP+) CD4+CD25+ T cells in Il1r1−/−.Il17fthy1.1.Foxp3gfp mice that were inoculated with 2 × 10⁹ cfu C. rodentium and gavaged with vehicle alone or with retinoic acid inhibitor (LE135) on days 3–7 post infection. On d8 PI, mice were sacrificed and frequencies of Thy1.1 (IL-17F) and Foxp3 (GFP+) CD4+CD25+ T cells in spleen, MLN and lamina propria were assessed by flow cytometry without restimulation ex vivo. (d) Frequencies of Thy1.1 (IL-17F) and Foxp3 (GFP+) expression within Foxp3+ (GFP+) and activated (CD4+CD25+) fractions from splenic, MLN and lamina propria lymphocytes of vehicle treated or LE135 treated C. rodentium infected Il1r1−/−.Il17fthy1.1.Foxp3gfp mice. (e) Representative histopathology of H&E-stained colonic tissues sections derived from vehicle–treated or LE135–treated, C. rodentium–infected Il1r1−/−.Il17fthy1.1.Foxp3gfp mice at d10 PI. (f) Histopathology scoring of colons from untreated or LE135 treated, infected Il1r1−/−.Il17fthy1.1.Foxp3gfp mice processed on d10 PI. Data are: representative of one of three similar independent experiments a; pooled from three independent experiments with 10 mice per group b; representative of one of two similar independent experiments c; pooled from two independent experiment with 6 mice per group where each point indicates one mouse d; representative of one of two independent experiments e; or pooled from two independent experiments with 4 mice per group f. Data are means and s.e.m. in b,d,f. *P < 0.05 and **P < 0.01 (two-tailed unpaired t-test
FIGURE 4
FIGURE 4. IL-1β counteracts RA-driven IL-2/STAT5–dependent repression of TH17 development
(a) Expression of Thy1.1 (IL-17F) and Foxp3 from naïve OTII-Tg CD4 T cells (CD4+CD25CD62LhiCD44lo) from OTII.Il17fthy1.1 mice activated with OVA peptide and IL-1β–deficient DCs for 4 days under TH17 polarizing conditions, with or without IL-1β addition, and with or without addition of the indicated doses of rhIL-2 at day 4. (b) Frequencies of Foxp3 and IL-17F single-producers from OTII-Tg CD4+ T cells polarized as in a at indicated concentrations of rhIL-2 (c) Quantitative IL-2 ELISA from supernatants of naïve CD4+ T cells from Il17fthy1.1 mice that were activated with plate-bound anti-CD3 and soluble anti-CD28 under TH17 polarizing conditions in absence (left) or presence (right) of IL-1β addition, with or without addition of addition of RA at the indicated concentrations (1–100 nM). (d) Expression of Cd25 and Cd122 transcripts by quantitative RT-PCR from naïve CD4+ T cells from Il17fthy1.1 mice that were activated with plate-bound anti-CD3 and soluble anti-CD28 under TH17 polarizing conditions in absence or presence of IL-1β, with or without addition of RA (1 nM) at 60 h. Expression values are normalized to TH0 controls. (e) Expression of IL-17A and Foxp3 from MACS-purified CD8CD4+ thymocytes isolated from WT B6 or Stat5fl/fl.Cd4-Cre mice that were activated with soluble anti-CD3 and Il1b−/− splenic DCs under TH17 polarizing condition (IL-6+TGF-β with or without the indicated additions of RA (1 nM), anti-IL-2 (10 μg/ml) and IL-1β (20 ng/ml) for 4 days. (f) Frequencies of IL-17A+ and Foxp3+ from CD4+ T cells from WT B6 or Stat5fl/fl.Cd4-Cre mice as treated in (e). Data are: representative of one of three similar independent experiments a; pooled from three independent experiments with nine samples per group (n = 9) b; pooled from two independent experiments with six samples (n = 6) c; representative of two independent experiments with 6 samples per group (n = 6) where individual data points represent each sample d; representative of one of three similar independent experiments e; or pooled from three independent experiments with ten samples (n = 10) per group f. Data are means and s.e.m. in b,c,d,f). **P < 0.01 (two-tailed unpaired T-test).
FIGURE 5
FIGURE 5. NF-κB-dependent SOCS3 repression by IL-1β enhances amplitude and duration of STAT3 phosphorylation
(a) Intracellular pSTAT5 and pSTAT3 analysis from naïve CD4+ T cells from WT B6 mice that were activated with plate-bound anti-CD3 and soluble anti-CD28 under TH17 polarizing conditions (IL-6 +TGF-β with or without the indicated additions of RA and IL-1β for 4 days. Prior to analysis, IL-6 and IL-2 were added to cultures for 20 min and intracellular pSTAT5 and pSTAT3 were determined by flow cytometry. (b) Expression of phospho-tyrosine(705)-STAT3 (pY-STAT3) from naïve CD4+ T cells cultured under TH17 polarizing conditions for 4–5 days, then restimulated with IL-6 alone, IL-1β alone, or both for indicated time periods. Cell lysates were harvested, immunoblotted with antibody directed against phospho-tyrosine(705)-STAT3 (pY-STAT3) or total STAT3 (top). (c) Expression of phospho-tyrosine(705)-STAT3 (pY-STAT3) by immunoblot from naïve CD4+ T cells that were cultured under TH17 polarizing conditions for 4 days, then restimulated with IL-23 alone, IL-1β alone, or both for indicated time periods and assessed as in b. (d) Quantitative analysis of active phosphorylated form of Jak2 from naïve CD4+ T cells that were cultured for under TH17-polarizing conditions and activated as in c, then lysed and subjected to ELISA analysis that quantified both the active phosphorylated form of Jak2 [Jak2(pYpY1007/1008)] and total Jak2. pYpY-Jak2 values were normalized to total Jak2 expression and data are expressed as fold change over unstimulated TH17 cells where unstimulated cells were assigned a value of 1. (e) Expression of Socs3 transcripts by quantitative RT-PCR from naïve CD4+ T cells that were cultured under TH17 conditions as in c and restimulated with IL-23 and/or IL-1β for the indicated times. Transcript abundance of Socs3 were normalized against β2-microglobulin and relative expression compared to unstimulated cells was calculated using the ΔΔCt method. (f) Expression of phospho-tyrosine(705)-STAT3 (pY-STAT3) by immunoblot from naïve CD4+ T cells polarized under TH17 conditions were isolated and pre-treated with indicated signaling inhibitors for 1 h then either left unstimulated or treated with IL-23 +/− IL-1β before cell lysates were harvested and immunoblotted for pY-STAT3 and total STAT3 as in c. Average values of pooled data representing relative expression of IDVs of pY-STAT3 normalized to total STAT3 are shown (between upper and lower panels). (g) Expression of Socs3 transcripts by quantitative RT-PCR from naïve CD4+ T cells polarized under TH17 conditions were isolated, pre-treated with the indicated signaling inhibitors for 1 h, were then restimulated with IL-23 and/or IL-1β for 45 min and harvested for RNA isolation and Socs3 mRNA quantification as in e. (h) Expression of phospho-tyrosine(705)-STAT3 (pY-STAT3) by immunoblot from naïve CD4+ T cells from WT and Relafl/fl.Cd4-Cre mice were polarized and analyzed as in c. Average values of pooled data representing relative expression of IDV of pY-STAT3 normalized to total STAT3 are shown (between upper and lower panels). Data are: representative of one of two similar experiments a; representative of one of three similar independent experiments (b,c); pooled from two independent experiments with six samples (n = 6) per group d; three independent experiments with nine samples (n = 9) per group e; pooled from two independent experiments with nine samples (n = 9) per group g; representative of one of two similar independent experiments (f,h) where numbers in red (IL-23 + IL-1β) are significantly different (P < 0.01) from corresponding values for cells stimulated with IL-23 alone (mean and s.e.m. in b,c,d,e,g). * P < 0.05 and ** P < 0.01 (two-tailed unpaired t-test).
FIGURE 6
FIGURE 6. Deletion of SOCS3 abrogates the IL-1–dependent reversal of RA repression of TH17 development
(a) Expression of Foxp3 and IL-17A (right composite panel) in naïve CD4+ T cells from Socs3fl/fl mice (control, red; Tat-Cre, blue) that were cultured under TH17 polarizing conditions with the indicated additions of RA, IL-1β and IL-23 with or without Tat-Cre peptide and Td-Tomato protein expression (left single plot) from Rosa26-floxed-STOP-TdTomato reporter mice (Rosa26TdTomato fl/+) treated with or without Tat-Cre peptide and cultured similarly under TH17 conditions and analyzed for Cre-mediated deletion efficiency. Numbers indicate the frequencies in each quadrant. (b) Frequencies of IL-17A– and Foxp3–positive cells from CD4+ T cells treated as in (a). Data are representative of one of four (deletion efficiency analysis with Rosa26TdTomato fl/+) or one of two (Socs3fl/fl with or without Tat-Cre) independent experiments (a) or are pooled from two independent experiments with 12 samples (n = 12) per group (b). Data are means and s.e.m. in b. NS = not significant, ** P < 0.01 (two-tailed unpaired t-test).
FIGURE 7
FIGURE 7. IL-1β reverses RA-mediated STAT5 binding in the Il17a-Il17f and Foxp3 gene loci
(a,b) Chromatin immunoprecipitation (ChIP) analysis of STAT3 and STAT5 binding in purified CD4+CD8 thymocytes isolated from wild-type (WT) or Stat5fl/fl.Cd4-cre mice and activated with plate-bound anti-CD3 and soluble anti-CD28 under TH0 or TH17 conditions (IL-6 +TGF-β, with or without the indicated additions of RA and IL-1β. On day 4, recovered cells were stimulated with IL-6 (pSTAT3) or IL-6+IL-2 (pSTAT5) and processed for ChIP-PCR to quantitate binding of STAT3 or STAT5 to the indicated sites within the Il17a-f (a) and Foxp3 (d) gene loci. Unstimulated TH0 cells were used as a negative control. Results are relative to input DNA. Data are representative of two independent experiments with 3 replicates per experiment (means and s.e.m. in a, b). *P < 0.05 and **P < 0.01 (two-tailed unpaired t-test).

Comment in

  • IL-1 watches the watchmen.
    Villarino AV, Laurence A. Villarino AV, et al. Nat Immunol. 2015 Mar;16(3):226-7. doi: 10.1038/ni.3105. Nat Immunol. 2015. PMID: 25689436 No abstract available.
  • All in (IL-) 1?
    Gagliani N, Battaglia M. Gagliani N, et al. Transplantation. 2015 Nov;99(11):2235-6. doi: 10.1097/TP.0000000000000966. Transplantation. 2015. PMID: 26492049 No abstract available.

Similar articles

Cited by

References

    1. Basu R, Hatton RD, Weaver CT. The TH17 family: flexibility follows function. Immunol Rev. 2013;252:89–103. - PMC - PubMed
    1. Veldhoen M, Hocking RJ, Atkins CJ, Locksley RM, Stockinger B. TGFβ in the context of an inflammatory cytokine milieu supports de novo differentiation of IL-17-producing T cells. Immunity. 2006;24:179–189. - PubMed
    1. Mangan PR, et al. Transforming growth factor-β induces development of the TH17 lineage. Nature. 2006;441:231–234. - PubMed
    1. Bettelli E, et al. Reciprocal developmental pathways for the generation of pathogenic effector TH17 and regulatory T cells. Nature. 2006;441:235–238. - PubMed
    1. Zhou L, et al. TGF-beta-induced Foxp3 inhibits TH17 cell differentiation by antagonizing RORγt function. Nature. 2008;453:236–240. - PMC - PubMed

Publication types

MeSH terms