. 2015 Feb 2;11(2):e1004914.
doi: 10.1371/journal.pgen.1004914. eCollection 2015 Feb.

Structured observations reveal slow HIV-1 CTL escape

Collaborators, Affiliations

Structured observations reveal slow HIV-1 CTL escape

Hannah E Roberts et al. PLoS Genet. .

Abstract

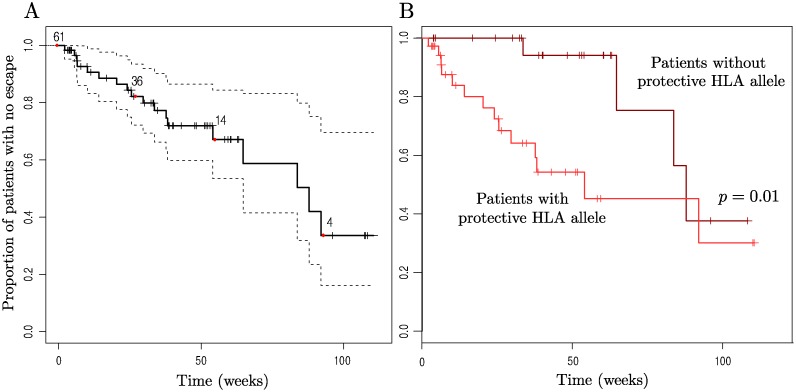
The existence of viral variants that escape from the selection pressures imposed by cytotoxic T-lymphocytes (CTLs) in HIV-1 infection is well documented, but it is unclear when they arise, with reported measures of the time to escape in individuals ranging from days to years. A study of participants enrolled in the SPARTAC (Short Pulse Anti-Retroviral Therapy at HIV Seroconversion) clinical trial allowed direct observation of the evolution of CTL escape variants in 125 adults with primary HIV-1 infection observed for up to three years. Patient HLA-type, longitudinal CD8+ T-cell responses measured by IFN-γ ELISpot and longitudinal HIV-1 gag, pol, and nef sequence data were used to study the timing and prevalence of CTL escape in the participants whilst untreated. Results showed that sequence variation within CTL epitopes at the first time point (within six months of the estimated date of seroconversion) was consistent with most mutations being transmitted in the infecting viral strain rather than with escape arising within the first few weeks of infection. Escape arose throughout the first three years of infection, but slowly and steadily. Approximately one third of patients did not drive any new escape in an HLA-restricted epitope in just under two years. Patients driving several escape mutations during these two years were rare and the median and modal numbers of new escape events in each patient were one and zero respectively. Survival analysis of time to escape found that possession of a protective HLA type significantly reduced time to first escape in a patient (p = 0.01), and epitopes escaped faster in the face of a measurable CD8+ ELISpot response (p = 0.001). However, even in an HLA matched host who mounted a measurable, specific, CD8+ response the average time before the targeted epitope evolved an escape mutation was longer than two years.


Conflict of interest statement

The authors have declared that no competing interests exist.

Figures

Figure 1
Figure 1. Escape prevalence in HLA-matched and-mismatched hosts.
Epitopes are labelled where possible with their first three amino acids, and length if necessary to distinguish them. Bars represent 95% binomial confidence limits (Agresti-Coull method). The dotted black line is y = x. Epitopes labelled in bold have a significantly higher proportion of escape in matched hosts than in mismatched hosts (one-tailed Fisher’s Exact test, p < 0.1, note that multiple testing was not corrected for since the purpose of these tests was simply to give a relative measure of significance). Raw data for the number of patients in each category can be found in S3 and S4 Tables. First visit (baseline) sequence data was available in at least one gene for 122/125 patients. The range of time from seroconversion among these patients was 1–20 weeks, median 11. (A) At baseline the majority of epitopes have escape at equal prevalence in HLA-matched and-mismatched hosts (B) 52 weeks later within-host evolution has resulted in a higher prevalence of escape in HLA-matched hosts for many epitopes, and in the distribution as a whole HLA-matching and escape are now significantly associated (p < 0.01, permutation test, see Methods for details).
Figure 2
Figure 2. The distribution of incident escape across patients.
(A) The observed distribution of incident escape (in HLA-matched patient-epitope pairs) across patients (red line) is similar to the distribution given by a Poisson process where the average rate of escape is constant across all patient-epitope pairs (black line). (B) The expected distribution of escape supposing all patients in (A) had a full set of sequence data and were observed for a full 2 years whilst off-ART. A goodness-of-fit test showed that there was no significant difference between the observed and expected distributions in (A) (p > 0.1). Details of calculations for the expected distributions are given in the Methods.
Figure 3
Figure 3. Kaplan-Meier plots of time to first escape using a midpoint approximation.
Patients who were either missing data for gag or nef, the two genes for which the most data was available, were not included so as not to skew the results due to lack of data. 4 of these patients had no epitopes restricted by their HLA types that were WT at baseline, so n = 61 initially here. (A) Time to first escape in an HLA-restricted epitope (solid line) is plotted along with the 95% confidence intervals (dotted lines). (B) Patients are split according to whether they have one of the more ‘protective’ HLA alleles or not. The set of beneficial alleles was taken to be B*58, B*27, B*57, A*26, B*51, A*11, B*14, B*18, B*08 (all the HLA-A and-B alleles down to B*08 that are present in our data, taken from the ranking in [47]) as this split the patients approximately in half. Having a protective HLA resulted in a significantly increased risk of HLA-matched escape (p = 0.01, Likelihood Ratio test on Cox Proportional Hazards model with single predictor. Hazard ratio = 3.7, 95% C.I. = (1.2, 11.3)). In both plots the x-axis represents the time since cessation of treatment, or baseline for those not receiving treatment, and vertical checks mark time points at which patients were censored (either because they began long term ART or because there was no further sequence data available for them). Numbers indicate the number of patients who have not yet escaped or been censored at the corresponding time points marked by red dots (0, 27, 55, 93 wks).
Figure 4
Figure 4. Kaplan-Meier survival curves for wild-type epitopes.
For the 114 patients and 46 epitopes for which appropriate sequence data was available: (A) Time to escape in epitopes within HLA-mismatched (dark blue) and-matched (light blue) hosts is shown. (B) Epitopes in HLA-matched hosts are split according to whether they have a measurable CD8+ T-cell ELISpot response to them (light red) or not (dark red). Escape is strongly significantly faster in epitopes within HLA-matched hosts (p < 1×10⁻⁴), hazard ratio = 2.6, 95% C.I. = (1.7, 4.2)) and then faster again if the host has a measurable CD8+ T-cell ELISpot response to that epitope (p = 0.013, hazard ratio = 3.0, 95% C.I = (1.3, 7.0)). Note that p-values and hazard ratios were calculated using a mixed effects model with random intercept terms for both patient and epitope ID, to account for correlation of observations within patients and within epitopes (see Methods).

References

    1. McMichael AJ, Borrow P, Tomaras GD, Goonetilleke N, Haynes BF (2010) The immune response during acute HIV-1 infection: clues for vaccine development. Nat Rev Immunol 10: 11–23. 10.1038/nri2674 - DOI - PMC - PubMed
    1. Goonetilleke N, Liu MK, Salazar-Gonzalez JF, Ferrari G, Giorgi E, et al. (2009) The first T cell response to transmitted/founder virus contributes to the control of acute viremia in HIV-1 infection. J Exp Med 206: 1253–1272. 10.1084/jem.20090365 - DOI - PMC - PubMed
    1. Kiepiela P, Ngumbela K, Thobakgale C, Ramduth D, Honeyborne I, et al. (2006) CD8+ T-cell responses to different HIV proteins have discordant associations with viral load. Nat Med 13: 46–53. 10.1038/nm1520 - DOI - PubMed
    1. Pereyra F, Jia X, McLaren PJ, Telenti A, De Bakker P, et al. (2010) The major genetic determinants of HIV-1 control affect HLA class I peptide presentation. Science 330: 1551–1557. 10.1126/science.1195271 - DOI - PMC - PubMed
    1. Fellay J, Shianna KV, Ge D, Colombo S, Ledergerber B, et al. (2007) A whole-genome association study of major determinants for host control of HIV-1. Science 317: 944–947. 10.1126/science.1143767 - DOI - PMC - PubMed

Publication types

MeSH terms

Substances