. 2015 Feb 12;518(7538):254-7.
doi: 10.1038/nature14157. Epub 2015 Feb 2.

Mammalian polymerase θ promotes alternative NHEJ and suppresses recombination

Affiliations

Mammalian polymerase θ promotes alternative NHEJ and suppresses recombination

Pedro A Mateos-Gomez et al. Nature. .

Abstract

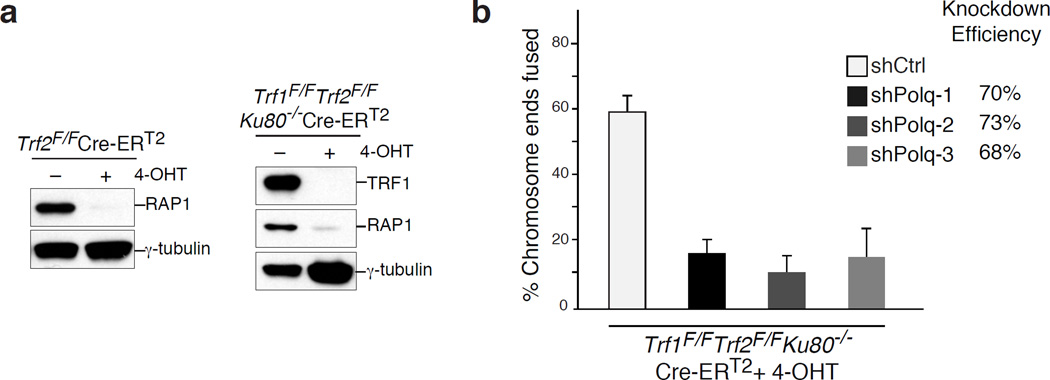
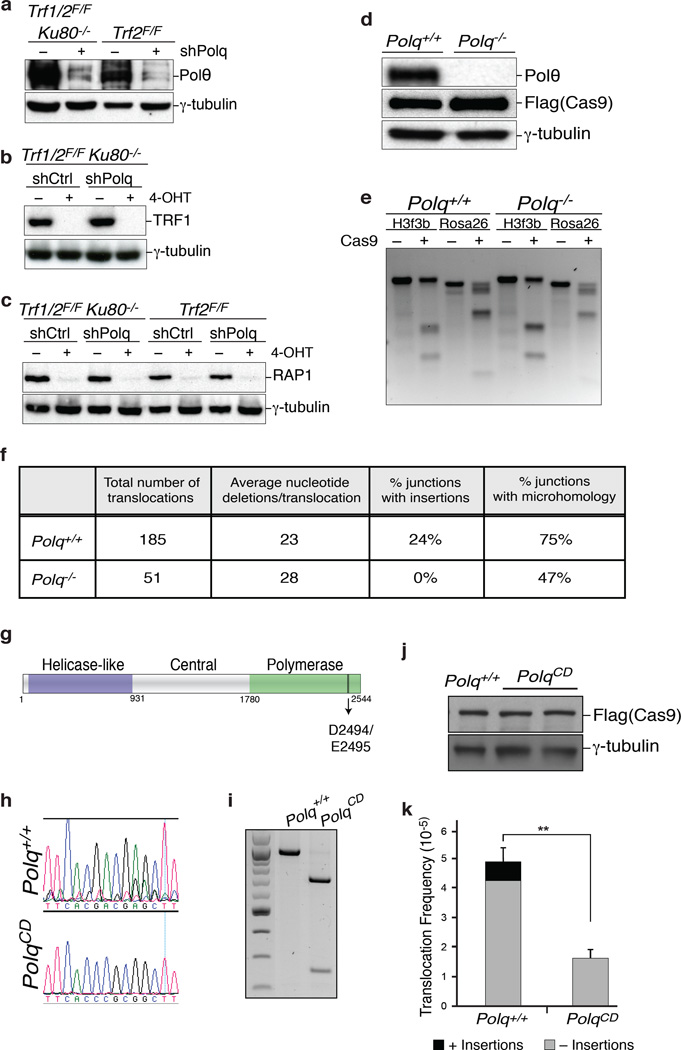
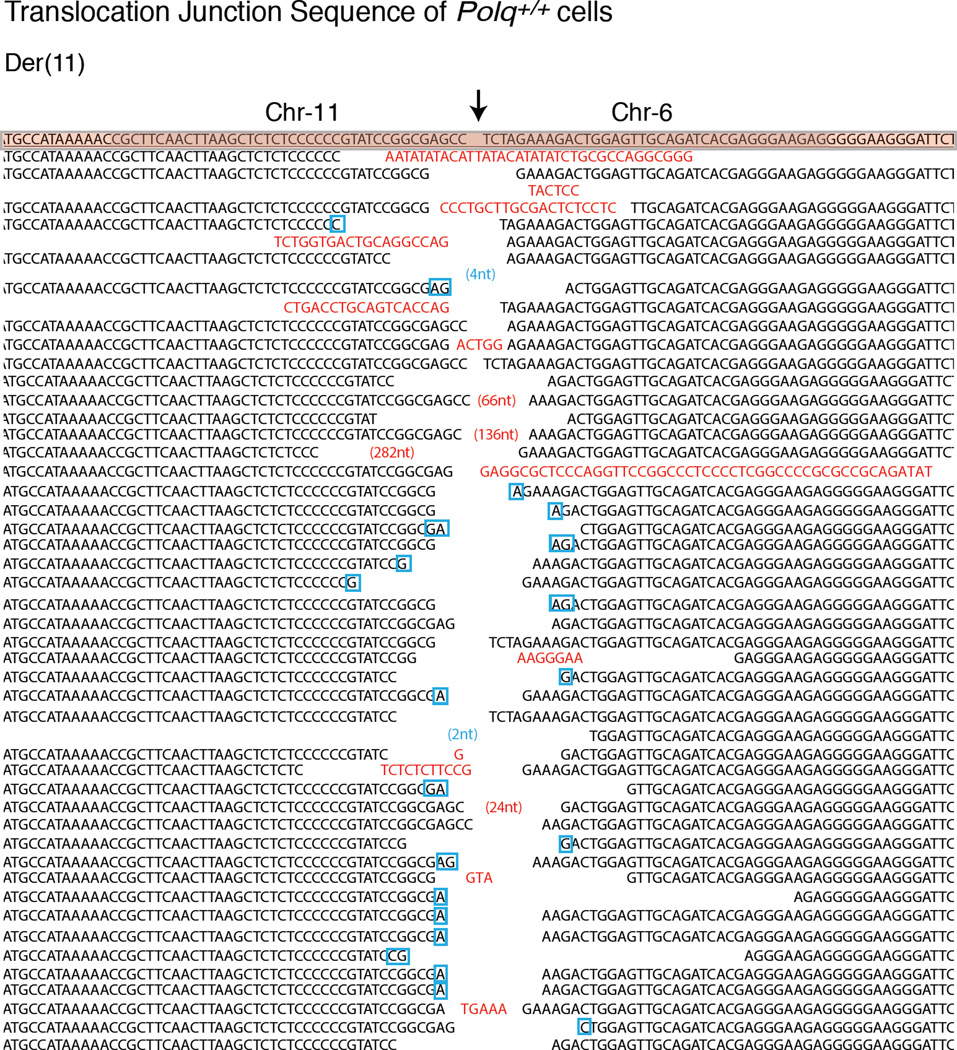
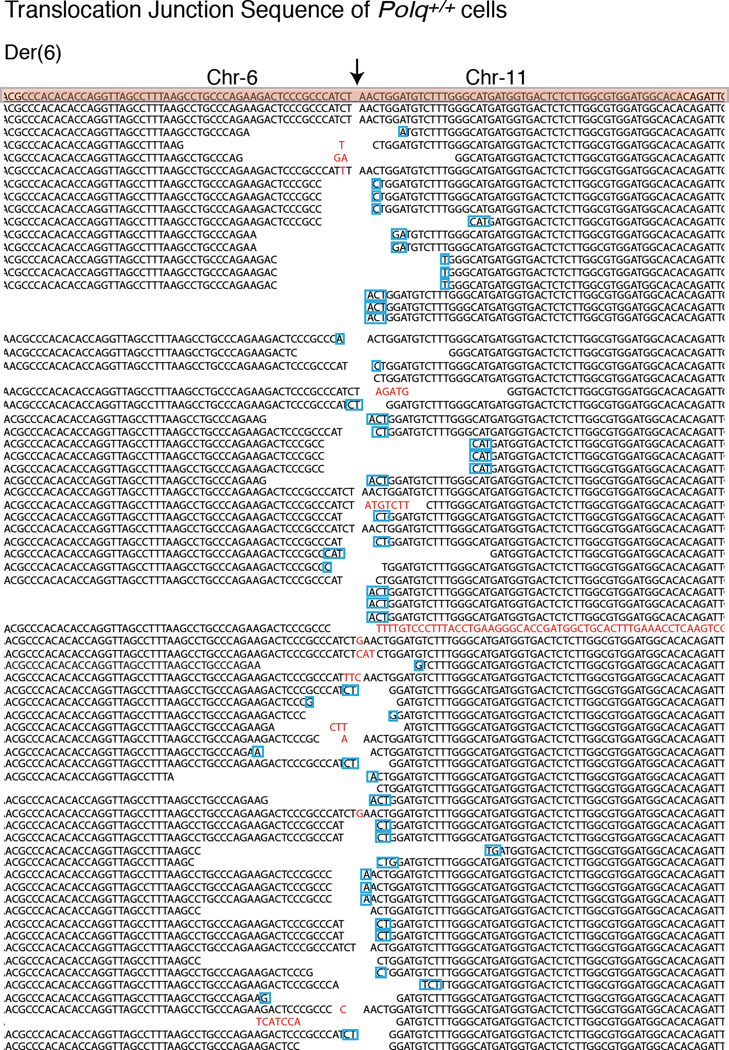
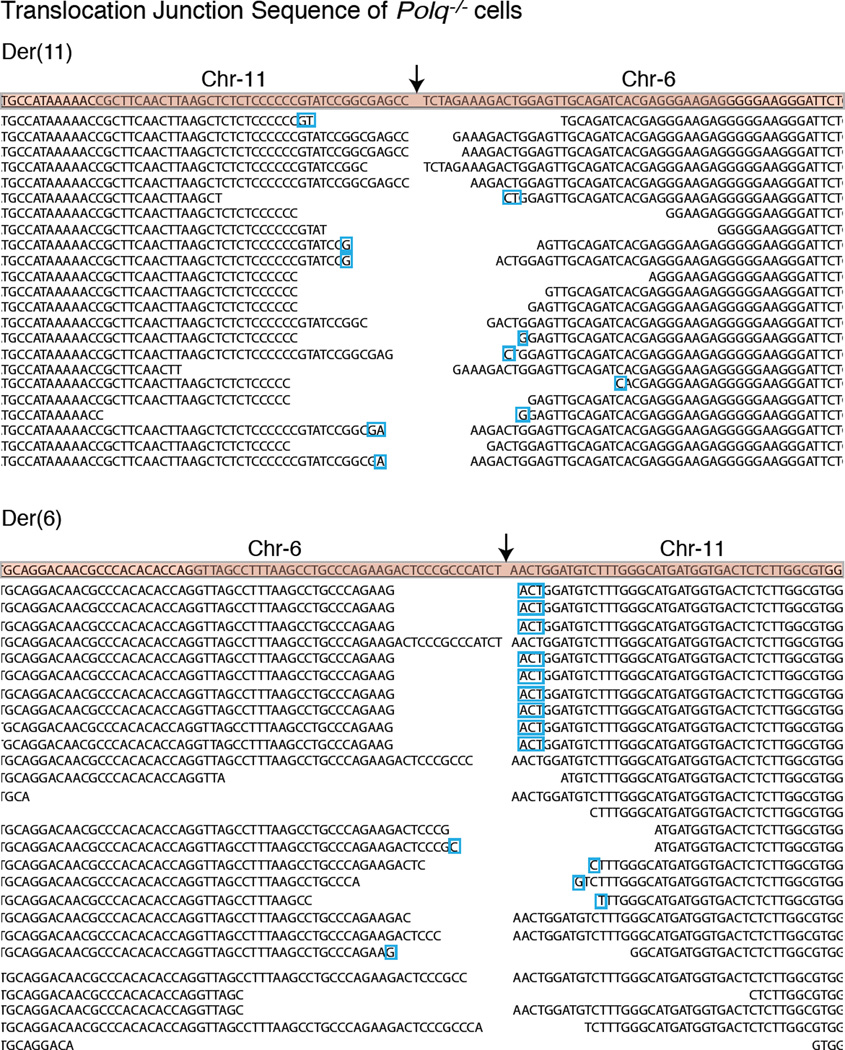
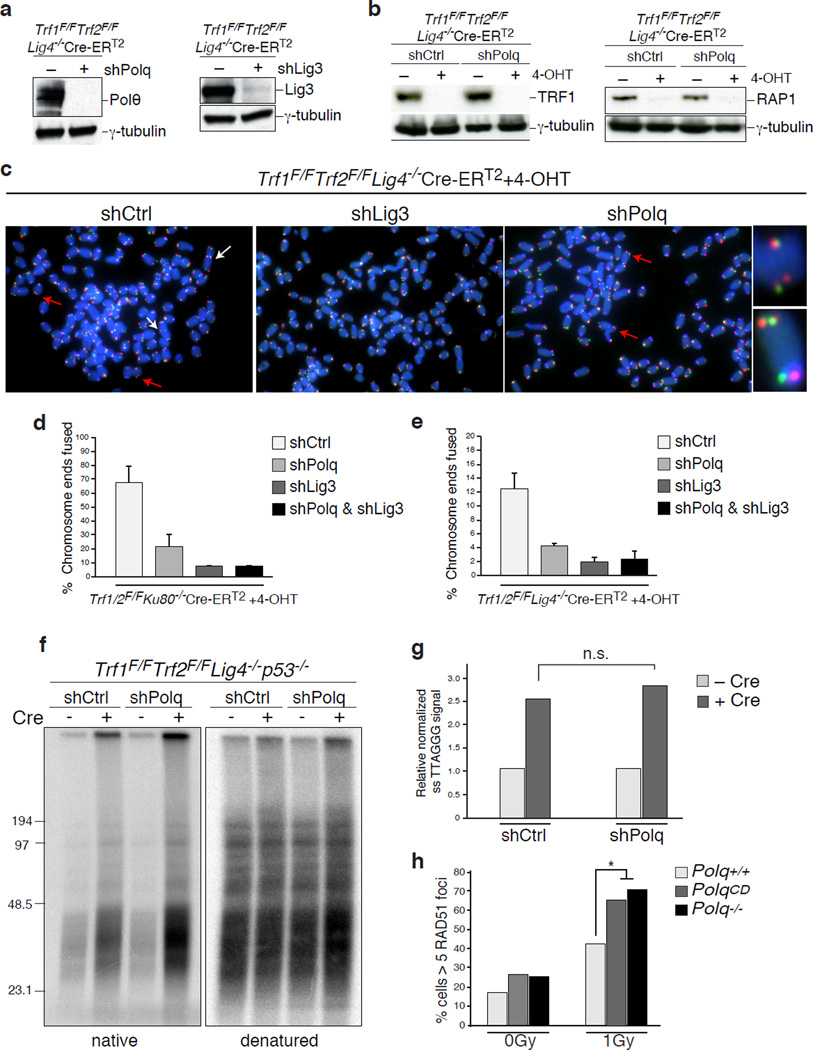
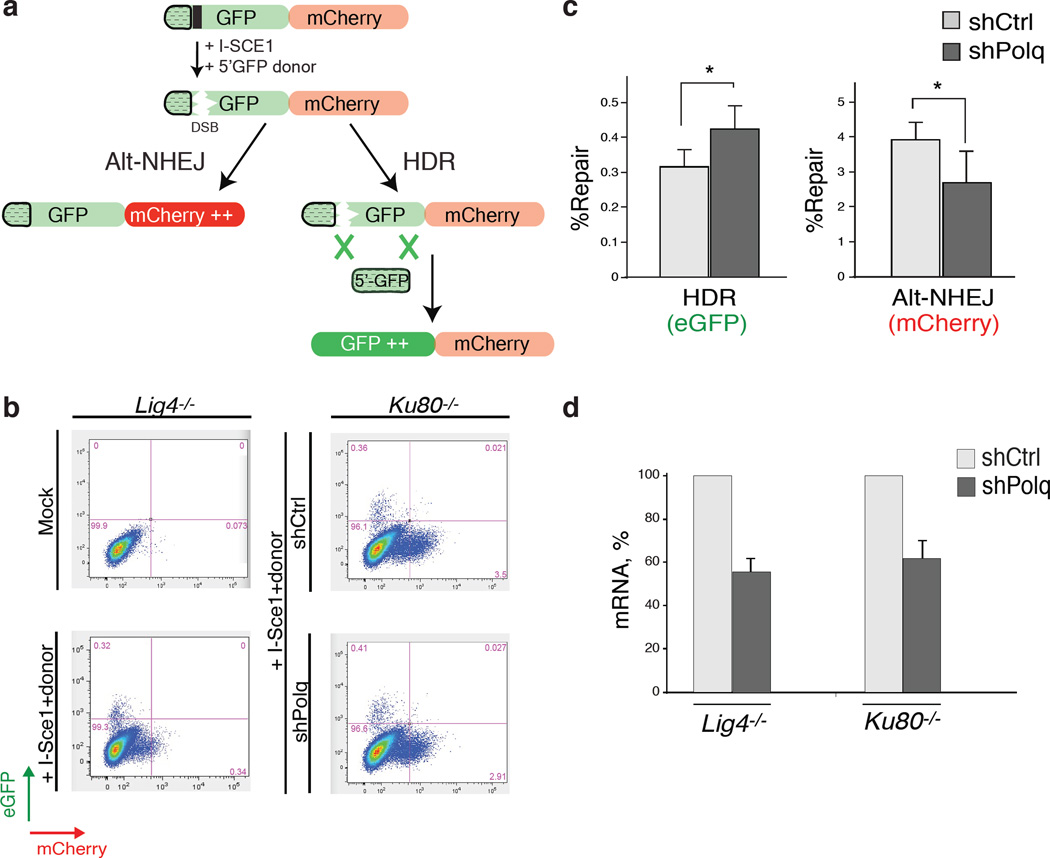
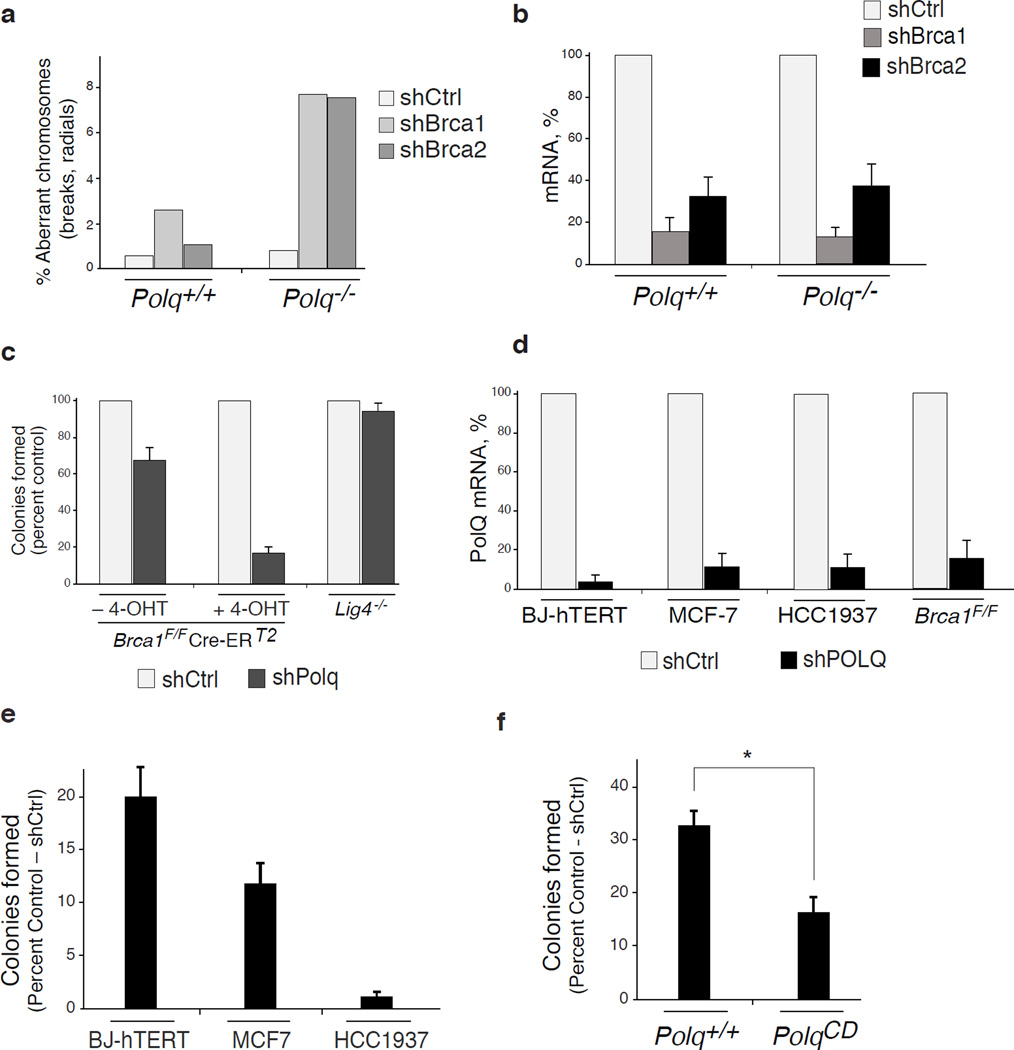
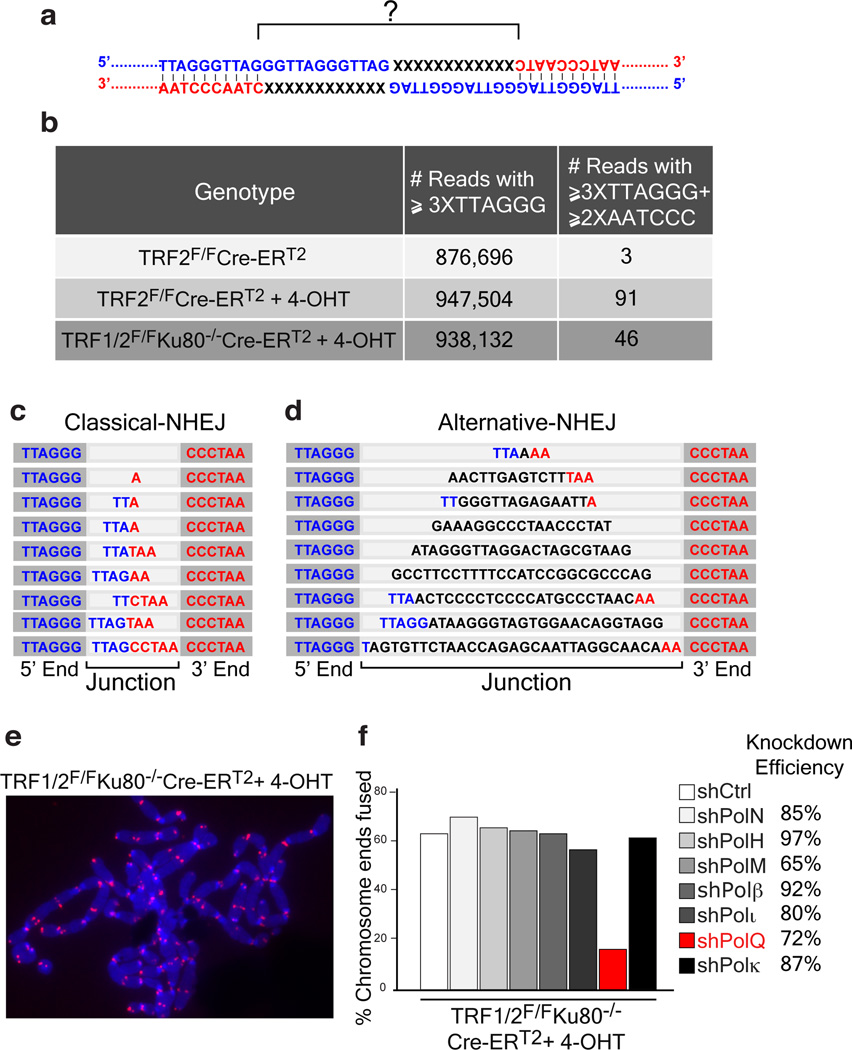
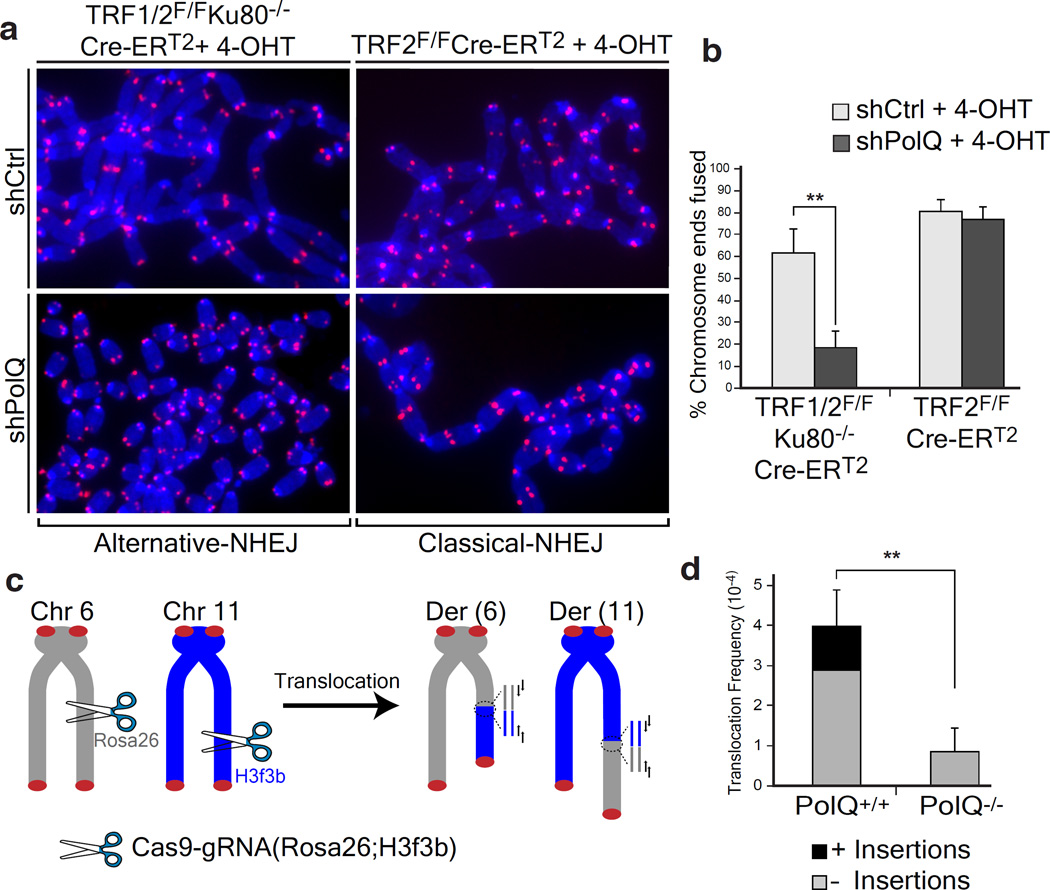
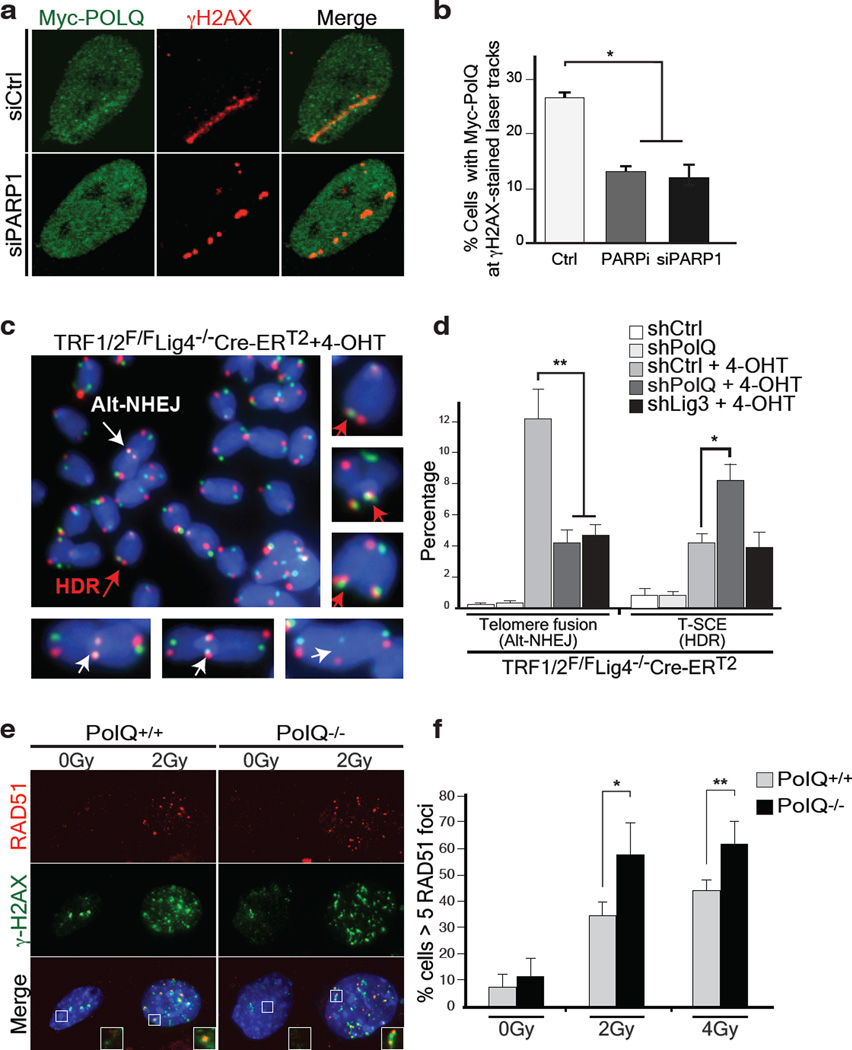
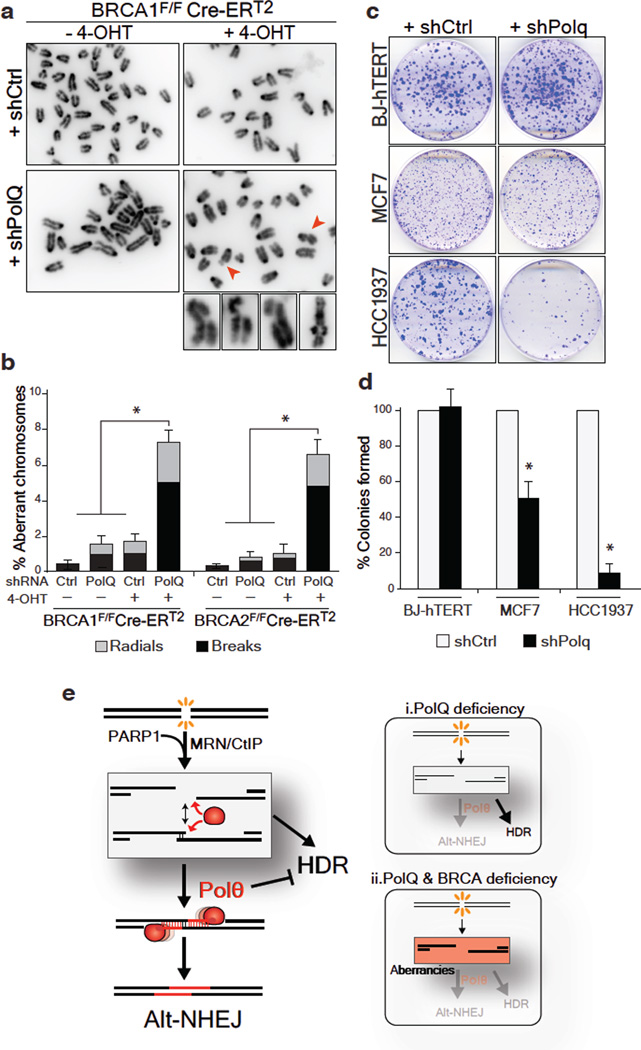
The alternative non-homologous end-joining (NHEJ) machinery facilitates several genomic rearrangements, some of which can lead to cellular transformation. This error-prone repair pathway is triggered upon telomere de-protection to promote the formation of deleterious chromosome end-to-end fusions. Using next-generation sequencing technology, here we show that repair by alternative NHEJ yields non-TTAGGG nucleotide insertions at fusion breakpoints of dysfunctional telomeres. Investigating the enzymatic activity responsible for the random insertions enabled us to identify polymerase theta (Polθ; encoded by Polq in mice) as a crucial alternative NHEJ factor in mammalian cells. Polq inhibition suppresses alternative NHEJ at dysfunctional telomeres, and hinders chromosomal translocations at non-telomeric loci. In addition, we found that loss of Polq in mice results in increased rates of homology-directed repair, evident by recombination of dysfunctional telomeres and accumulation of RAD51 at double-stranded breaks. Lastly, we show that depletion of Polθ has a synergistic effect on cell survival in the absence of BRCA genes, suggesting that the inhibition of this mutagenic polymerase represents a valid therapeutic avenue for tumours carrying mutations in homology-directed repair genes.


Figures

Extended data figure 1
(Related to Figure 1). a, Immunoblots for TRF1 and Rap1 after 4-OHT-induced depletion of TRF2 from TRF2F/FCre-ERT2 MEFs and co-depletion of TRF1 and TRF2 from TRF1F/FTRF2F/FKu80−/−Cre-ERT2 cells. Loss of TRF2 is confirmed by the disappearance of Rap1; a TRF2-interacting protein whose stability depends on TRF2, b, To validate the impact of PolQ deletion on alt-NHEJ we monitored the frequency of telomere fusions in shelterin-free Ku80 null cells treated with three independent shPolQ vectors. shPolQ-1 was used in Figure 2. Error bars represent s.e.m.
Extended data figure 2
(Related to Figure 2). a, Immunobloting for Polθ in MEFs with the indicated genotype and treatment. b, Immunoblot for TRF1 in MEFs with the indicated genotype. Cells were analyzed 96 hours following Cre induction. c, Rap1 Immunoblot (similar to B). d, Western blot analysis for Polθ and Flag-Cas9 in lysates prepared from PolQ−/− and PolQ+/+ cells following Cas9 expression. Tubulin serves as a loading control. e, Surveyor nuclease assay for PolQ−/− and PolQ+/+ cells expressing Cas9-gRNA(Rosa26;H3f3b) plasmid. Genomic DNA isolated from cells with the indicated genotype was used as a template to amplify across the cleavage site at either the Rosa26 or the H3f3b locus to assess intra-chromosomal NHEJ. Amplification products were denatured and then re-annealed to form heteroduplexes between unmodified and modified sequences from imprecise NHEJ. The mismatched duplex was selectively cleaved by the Surveyor nuclease at the loops that form at mismatches. f, Signature of translocations in PolQ−/− and PolQ+/+ cells (see Extended Data Fig. 3–5 for complete list of sequences). Table records the total number of translocation events identified following CRISPR-Cas induced-cleavage. On average, the same number of nucleotides was deleted at the fusion junction in PolQ−/− and PolQ+/+ cells. No nucleotide insertions were found in the absence of PolQ. Lastly, the percentage of junctions exhibiting microhomology were significantly reduced in cells lacking PolQ. g, Scheme depicting Polθ domains. CRISPR/Cas9 gene targeting was employed in order to create two base substitutions at D2494G and E2495S, and generate a catalytic dead polymerase. h, Sequence analysis of targeted cells. i, genotyping PCRs of PolQ+/+ and PolQCD after SacII digestion. j, Immunoblotting to analyze Cas9 expression in PolQ+/+ and two independently derived PolQCD clonal cell lines. k, Frequency of chromosomal translocations (Der-6) in PolQ+/+ and PolQCD cells. Bars represent mean of four independent experiments ± SD (two experiments per clonal cell line). ** represents p=0.006 (two-tailed student’s t test). PCR products were sequenced to confirm translocation and identify possible insertions.
Extended data figure 3
(Related to Figure 2). Sequences of der(6) and der(11) breakpoint junction from PolQ+/+ and PolQ−/− cells. Predicted fusion breakpoint based on CRISPR cutting, is indicated by an arrow. Reference sequence is highlighted at the top. The remaining lines represent individual translocations recovered by PCR and subject to Sanger sequencing. Nucleotide insertions in PolQ+/+ cells are marked in red. In cases where insertions extended beyond the sequence included in the lane, the length of the insertion was noted in parenthesis (red). It is important to note that insertions were completely lacking at the fusions junctions in PolQ−/− cells (Extended Data Fig. 5). Gaps in the sequence represent nucleotide deletions. The average length of the deletions was noted in Extended Data Fig. 2f. Micro-homology is denoted by blue boxes. Micro-homology embedded in DNA extending beyond the enclosed sequence was noted in parentheses (blue).
Extended data figure 4
(Related to Figure 2). Sequences of der(6) and der(11) breakpoint junction from PolQ+/+ and PolQ−/− cells. Predicted fusion breakpoint based on CRISPR cutting, is indicated by an arrow. Reference sequence is highlighted at the top. The remaining lines represent individual translocations recovered by PCR and subject to Sanger sequencing. Nucleotide insertions in PolQ+/+ cells are marked in red. In cases where insertions extended beyond the sequence included in the lane, the length of the insertion was noted in parenthesis (red). It is important to note that insertions were completely lacking at the fusions junctions in PolQ−/− cells (Extended Data Fig. 5). Gaps in the sequence represent nucleotide deletions. The average length of the deletions was noted in Extended Data Fig. 2f. Micro-homology is denoted by blue boxes. Micro-homology embedded in DNA extending beyond the enclosed sequence was noted in parentheses (blue).
Extended data figure 5
(Related to Figure 2). Sequences of der(6) and der(11) breakpoint junction from PolQ+/+ and PolQ−/− cells. Predicted fusion breakpoint based on CRISPR cutting, is indicated by an arrow. Reference sequence is highlighted at the top. The remaining lines represent individual translocations recovered by PCR and subject to Sanger sequencing. Nucleotide insertions in PolQ+/+ cells are marked in red. In cases where insertions extended beyond the sequence included in the lane, the length of the insertion was noted in parenthesis (red). It is important to note that insertions were completely lacking at the fusions junctions in PolQ−/− cells (Extended Data Fig. 5). Gaps in the sequence represent nucleotide deletions. The average length of the deletions was noted in Extended Data Fig. 2f. Micro-homology is denoted by blue boxes. Micro-homology embedded in DNA extending beyond the enclosed sequence was noted in parentheses (blue).
Extended data figure 6
(Related to Figure 3). a, Laser micro-irradiation experiment using HeLa cells expressing Myc-PolQ and treated with ATM inhibitor (KU55933). ATR inhibitor (VE-821), or PARP inhibitor (KU58948). b, Western blot analysis for Chk1 and Chk2 phosphorylation. Cells with the indicated treatment were analyzed 2 hours following irradiation. c, Immunoblot for PARP1. HeLa cells were treated with PARP1 siRNA and analyzed 72 hours post-siRNA transfection for efficiency of knockdown.
Extended data figure 7
(Related to Figure 3). a, Results from immunofluorescence performed at 4 hours after induction (Shield1 ligand, Clontech 631037; 0.5 µM 4-OH tamoxifen) of DSBs by mCherry-LacI-FokI in the U2OS-DSB reporter cells transfected with the Myc-PolQ and treated with PARP inhibitor (KU58948). The mCherry signal is used to identify the area of damage and to assess the recruitment of Myc-PolQ to cleaved LacO repeats. b, Table displaying quantification related to a.
Extended data figure 8
(Related to Figure 3). a, Western blot analysis for Polθ and Lig3 in shelterin-free Lig4 null MEFs. b, Western blot for TRF1 and Rap1 following 4-OHT treatment of shelterin-free Lig4 deficient cells. c, Metaphase spreads from TRF1F/FTRF2F/FLig4−/−Cre-ERT2 MEFs, with the indicated shRNA treatment, 96 hours after Cre expression. CO-FISH assay was performed using a FITC-OO-(CCCTAA)3 PNA probe (green) and a Tamra-OO-(TTAGGG)3 PNA probe (red). DAPI in blue. Examples of alt-NHEJ mediated fusion and T-SCE events (HDR) are indicated by white and red arrows, respectively. Examples of T-SCE events reflective of increased HDR in cells treated with shPolQ are on the right. d–e, Quantification of telomere fusions by alt-NHEJ in MEFs with the indicated genotype and shRNA treatment. Bars represent the mean of two independent experiments ±SD. f, Representative in-gel hybridization to assess 3′ overhang of TRF1F/FTRF2F/FLig4−/−Cre-ERT2 MEFs with the indicate shRNA treatment after Cre deletion. g, Quantification of the gel in f. The ssDNA/total signal ratios of the +Cre samples are expressed relative to the −Cre samples for each shRNA treatment. Mean of two independent experiments. h. Graph representing Rad51 accumulation following IR treatment of PolQCD, Polq+/+ and PolQ−/− embryonic stem cells.
Extended data figure 9
(Related to Figure 3). a, Polθ represses recombination at DSBs induced by I-Sce1. The Traffic light reporter (TLR) system was used to measure the relative ratio of end-joining (mCherry) and HDR (eGFP) repair of a DSB. A Diagram of the TLR is represented. b, The TLR construct was stably integrated into Lig4−/− and Ku80−/− MEFs to avoid the confounding impact of C-NHEJ, and limit end-joining reactions to the alt-NHEJ pathway. Expression of mCherry and eGFP was assessed by flow cytometry 72 hours after I-Sce1 and 5’eGFP donor transduction in cells with the indicated shRNA construct. Percentages of cells are indicated in the plot. c, Quantification of alt-NHEJ and HDR of TLR containing Ku80−/− MEFs following expression of I-Sce1 and 5’eGFP together with the indicated shRNA construct. Bar graphs represent the mean of three independent experiments ±SD. * represent p=0.03 d, Real-time PCR to monitor the knockdown efficiency of PolQ in Ku80−/− and Lig4−/− MEFs. The FACS analysis reported in e and f was carried it without selecting for cells expressing the shRNA containing plasmid.
Extended data figure 10
(Related to Figure 4). a, Accumulation of chromosomal aberrancies following BRCA1 and BRCA2 knockdown in PolQ−/− and Polq+/+ MEFs. Quantification of chromosomal aberrancies (chromatid breaks, chromosome breaks, and radials) in MEFs stably transduced with lentiviral vectors expressing the indicated shRNA. b, Real-time PCR to confirm the knockdown of BRCA1 and BRCA2 as in (a). c, Quantitative analysis of colony formation in BRCA1F/FCre-ERT2 and Lig4−/− cells following PolQ depletion. The number of colonies in control shRNA- treated cells was set to 100%. d, Real-time PCR to measure the knockdown efficiency of human PolQ in BJ-hTERT, MCF7, HCC1937, and mouse PolQ in BRCA1F/FCre-ERT2 cells. e, Quantitative analyses of colony formation in BJ-hTERT, MCF7, HCC1937 following Lig3 inhibition. The numbers of colonies in control shRNA treated cells were set to 100%. The knockdown efficiency for Lig3 was ~85%. f. Quantitative analyses of colony formation in PolQCD and Polq+/+ embryonic stem cells following BRCA1 inhibition. The number of colonies in control shRNA-treated cells was set to 100%. The knockdown efficiency for BRCA1 was > 80%.
Figure 1
Figure 1. Random nucleotide insertions at the junction of telomeres fused by alt-NHEJ
a, Schematic of the junction of a telomere fusion. The 3’ end of the telomeric G-rich strand of a chromosome (Blue) is fused to the 5’ end of the C-rich strand of a different chromosome (Red). b, Illumina sequencing to analyze telomere fusion junctions. Reads ≥3XTTAGGG consecutively were scored as derived from telomeric fragments. Those with ≥3XTTAGGG on the 5’-end and ≥2XCCCTAA at the 3’-end were scored as telomere fusion junctions (see Supplementary Information). c, Examples of telomere fusions generated by C-NHEJ from TRF2 depleted telomeres. Light gray highlights fusion junctions, dark grey marks the flanking telomere repeats. d, Examples of insertions in shelterin-free/Ku80 null MEFs. e, Telomere fusions in metaphase spreads from TRF1F/FTRF2F/FKu80−/−Cre-ERT2 MEFs. Telomeres in red (PNA probe) and chromosomes in blue (DAPI). f, Frequency of telomere fusions following the depletion of candidate polymerases.
Figure 2
Figure 2. Polθ is required for alt-NHEJ dependent DSB repair in mammalian cells
a, Metaphases from TRF2 depleted (TRF2F/FCre-ERT2OHT) and shelterin free (TRF1F/FTRF2F/FKu80−/−Cre-ERT2OHT) MEFs infected with the indicated shRNA. b, Quantification of telomere fusions in MEFs with the indicated treatment (Mean ± SD, n=6, **p=0.003; two-tailed student’s t-test). c, Design of the translocation assay in which DSBs are induced by Cas9-gRNA(Rosa26;H3f3b). Joining of DNA ends generates Der(6) and Der(11), detected by nested PCR. d, Translocation frequency in PolQ+/+ and PolQ−/− cells 60 hours post-Cas9-gRNA(Rosa26;H3f3b) expression. (Mean ± SD, n=3, ** p=0.009; two-tailed student’s t-test).
Figure 3
Figure 3. Polθ is recruited by PARP1 to promote alt-NHEJ at the expense of HDR
a, Myc-PolQ localization to DNA damage was monitored after laser micro-irradiation of HeLa cells. Cells were fixed and stained for γ–H2AX and Myc, one hour after damage induction. b, Quantification of Polθ accumulation at sites of laser damage (Mean ± s.e.m, n=2). c, To test if Polθ represses recombination at telomeres, we depleted the polymerase in shelterin-free and Lig4 deficient MEFs, and both repair pathways were monitored using CO-FISH. White arrows indicate alt-NHEJ events, red arrows highlight HDR-mediated T-SCEs. d, Quantification of telomere fusion (alt-NHEJ) and T-SCE (HDR) in cells transduced with PolQ, Lig3, or control shRNA. e, Immunofluorescence for Rad51 and γ-H2AX in the indicated MEFs 3 hours post-irradiation. f, Graph representing quantification of IR-induced RAD51 foci. (Mean ± SD, n=3, *p<0.05, **p<0.01;two-tailed student’s t-test).
Figure 4
Figure 4. PolQ inhibition in BRCA-mutant cells leads to increased chromosomal aberrancies and reduced cellular survival
a, Analysis of genomic instability in metaphase spreads from BRCA1F/FCre-ERT2 MEFs treated with shRNA against PolQ or vector control. b, Quantification of breaks (chromatid and chromosome) and radials in BRCA1F/FCre-ERT2 and BRCA2F/FCre-ERT2 MEFs with the indicated treatment. c, Clonogenic survival following PolQ depletion. Crystal violet staining of BJ-hTERT, MCF7, and HCC1937 cells treated with shRNA against PolQ or vector control. d, Quantitative analyses of colony formation assay. Colonies in each control shRNA cell line were set to 100%. Colonies in shPolQ expressing cells normalized to shCtrl (Mean ± SD, n=3’ *p<0.05’ **p<0.01;two-tailed student’s t-test). e, Schematic depicting our model for the function of Polθ during DSB repair (see Supplementary Information).

Comment in

Similar articles

Cited by

References

    1. Capper R, et al. The nature of telomere fusion and a definition of the critical telomere length in human cells. Genes Dev. 2007;21:2495–2508. - PMC - PubMed
    1. Sfeir A, de Lange T. Removal of shelterin reveals the telomere end-protection problem. Science. 2012;336:593–597. - PMC - PubMed
    1. Rai R, et al. The function of classical and alternative non-homologous end-joining pathways in the fusion of dysfunctional telomeres. EMBO J. 2010;29:2598–2610. - PMC - PubMed
    1. Sfeir A. Telomeres at a glance. J. Cell. Sci. 2012;125:4173–4178. - PMC - PubMed
    1. van Steensel B, Smogorzewska A, de Lange T. TRF2 protects human telomeres from end-to-end fusions. Cell. 1998;92:401–413. - PubMed

Publication types

MeSH terms

Substances

Associated data