. 2015 Feb 12;518(7538):258-62.
doi: 10.1038/nature14184. Epub 2015 Feb 2.

Homologous-recombination-deficient tumours are dependent on Polθ-mediated repair

Affiliations

Homologous-recombination-deficient tumours are dependent on Polθ-mediated repair

Raphael Ceccaldi et al. Nature. .

Abstract

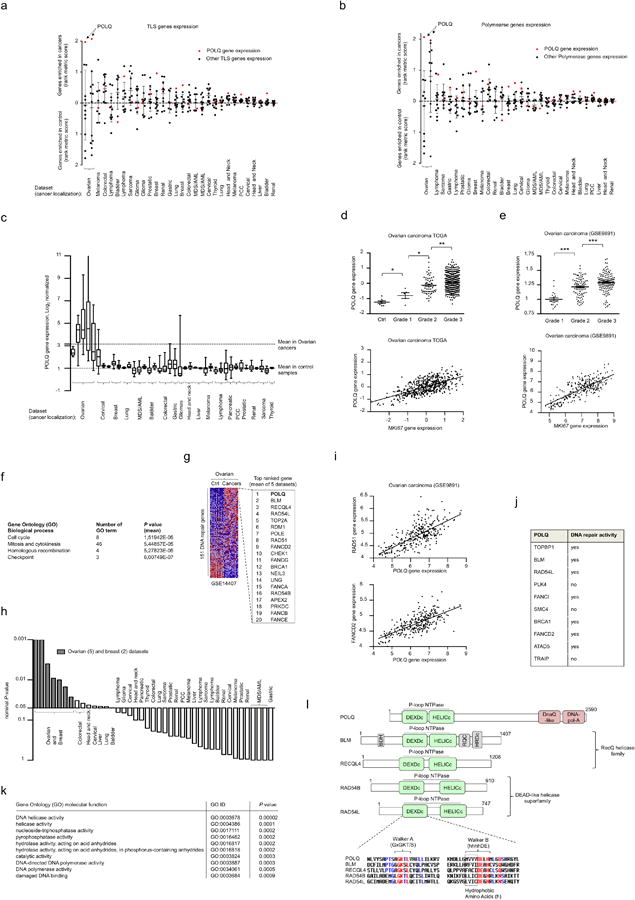
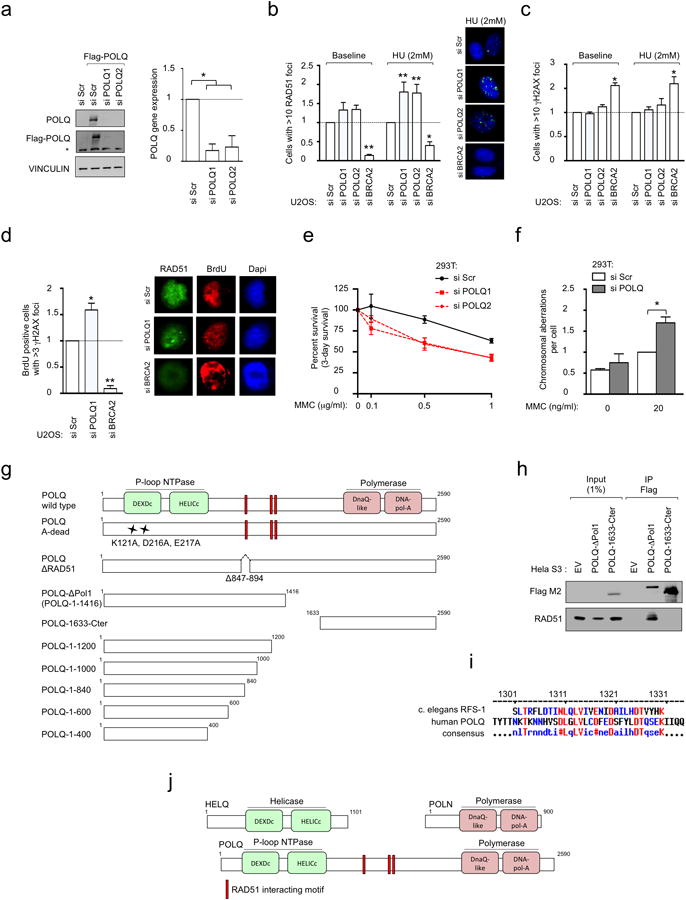
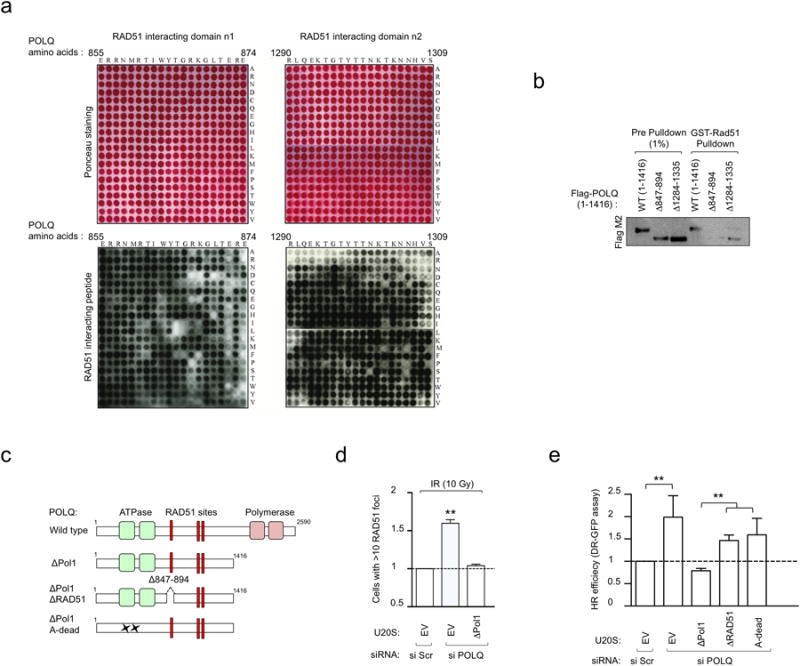
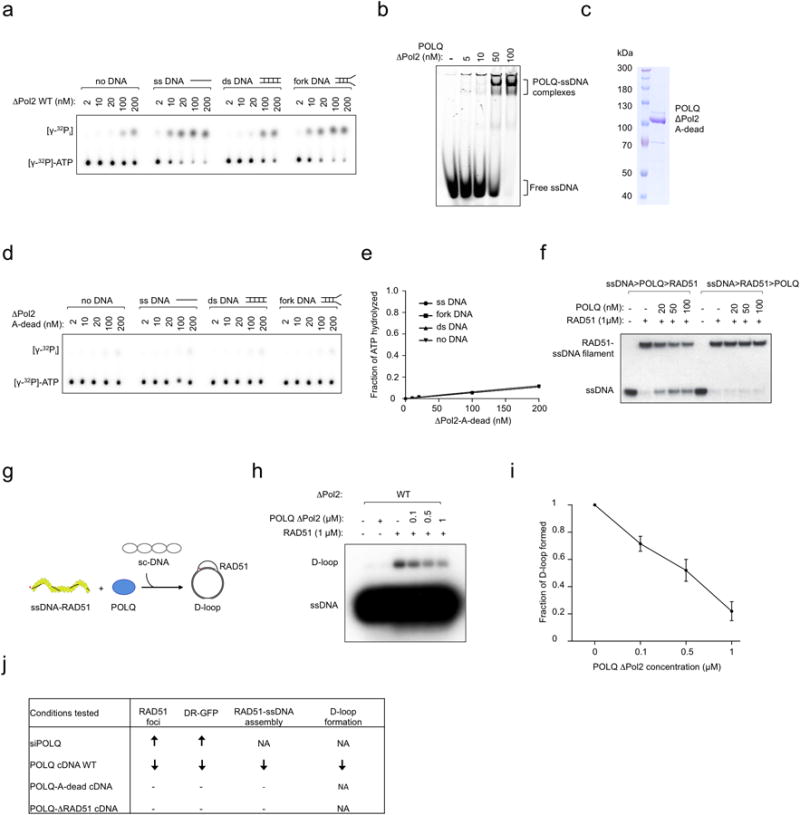
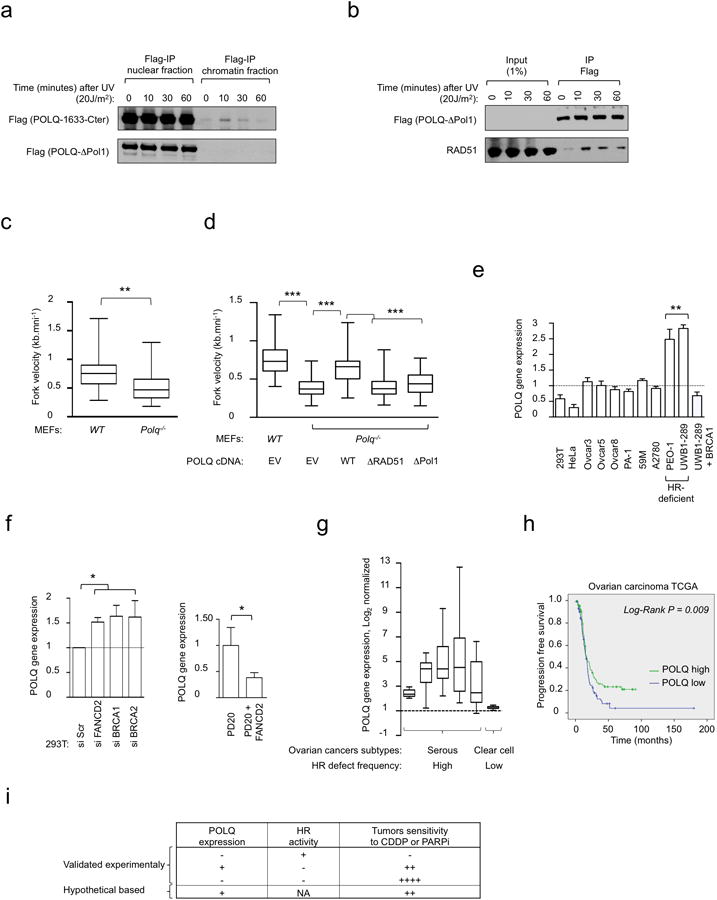
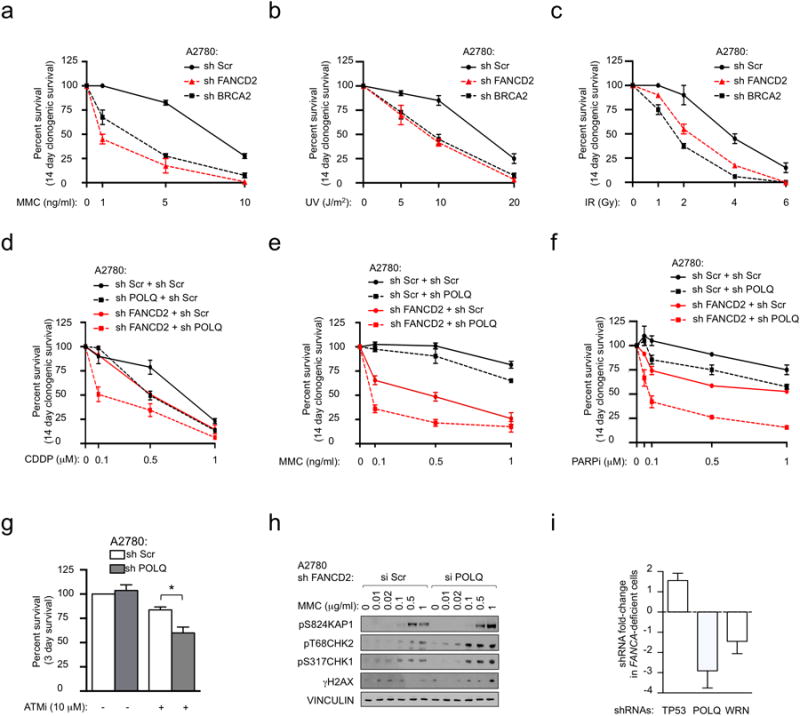
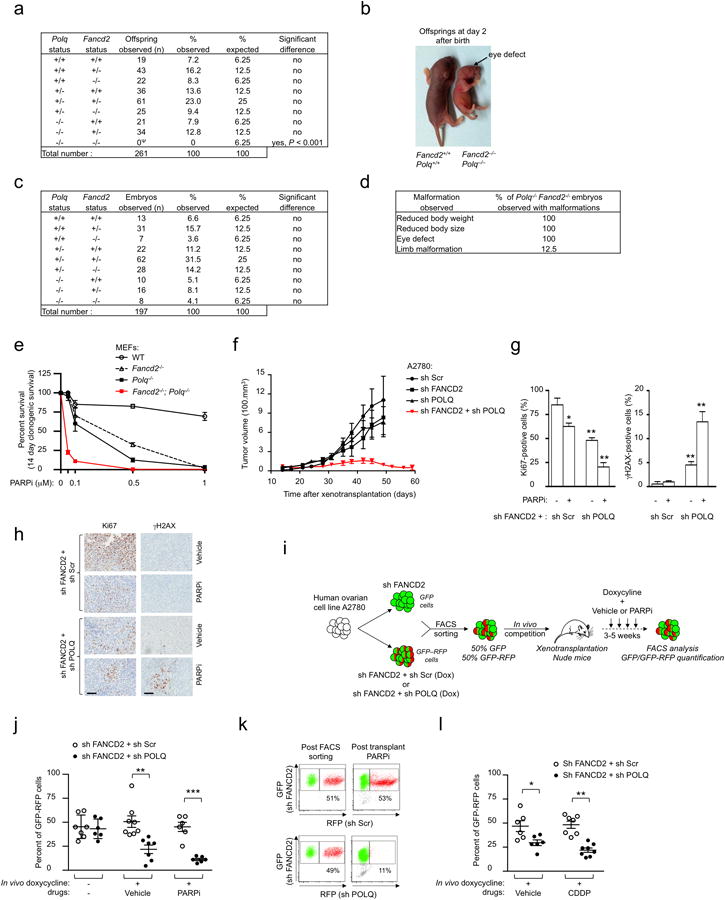
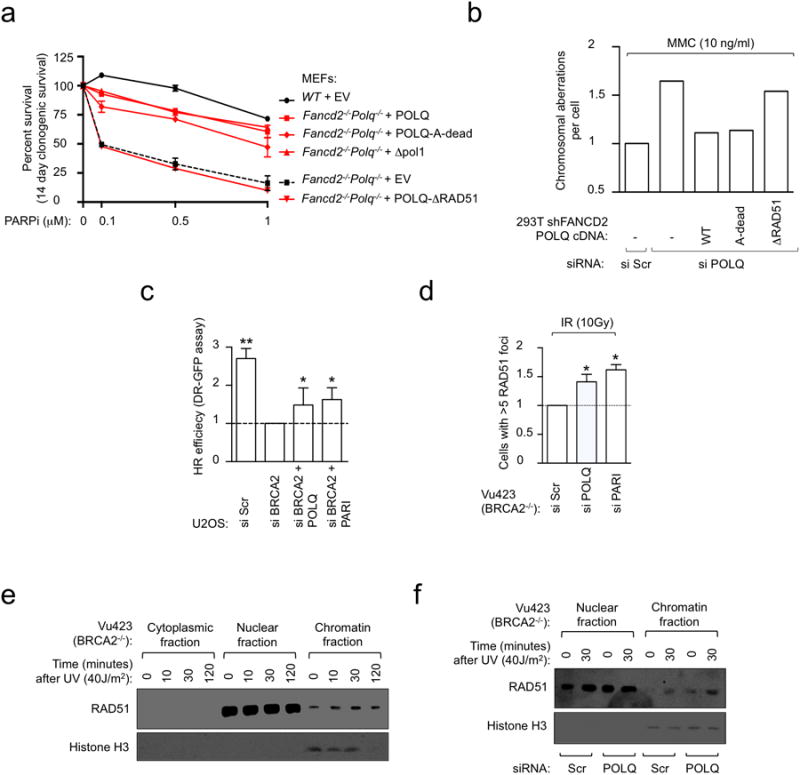
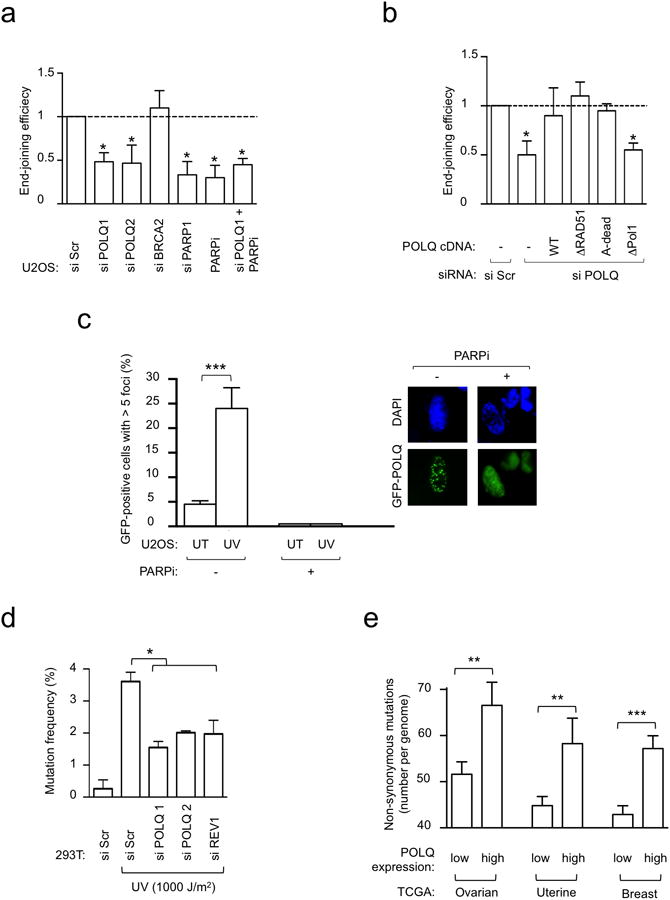
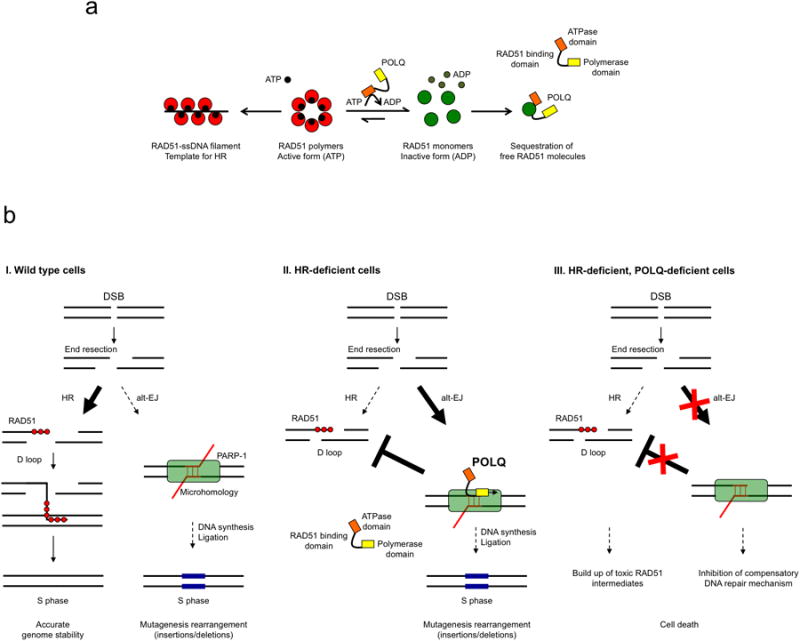
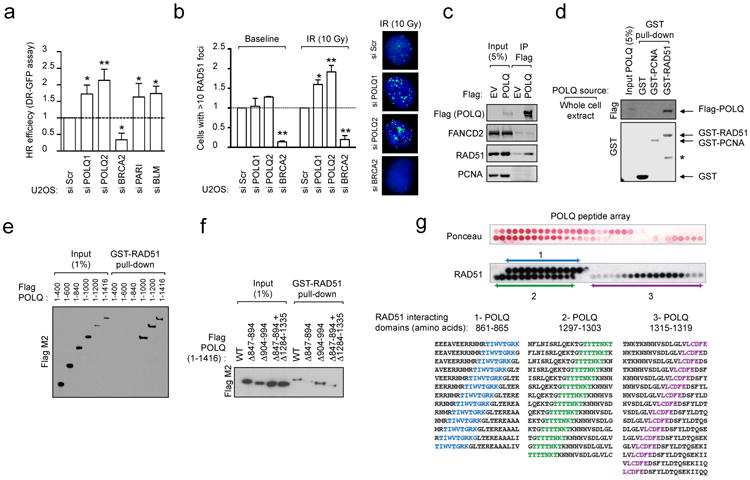
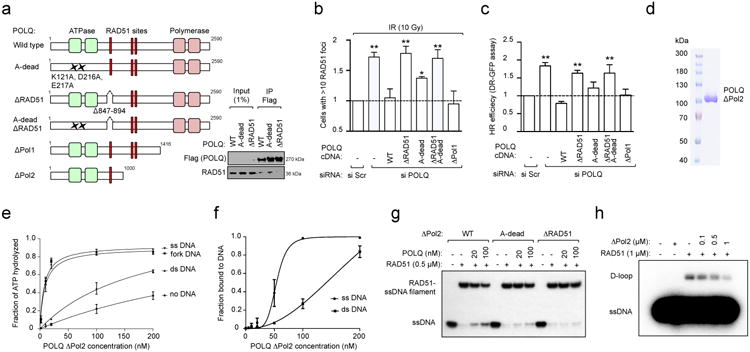
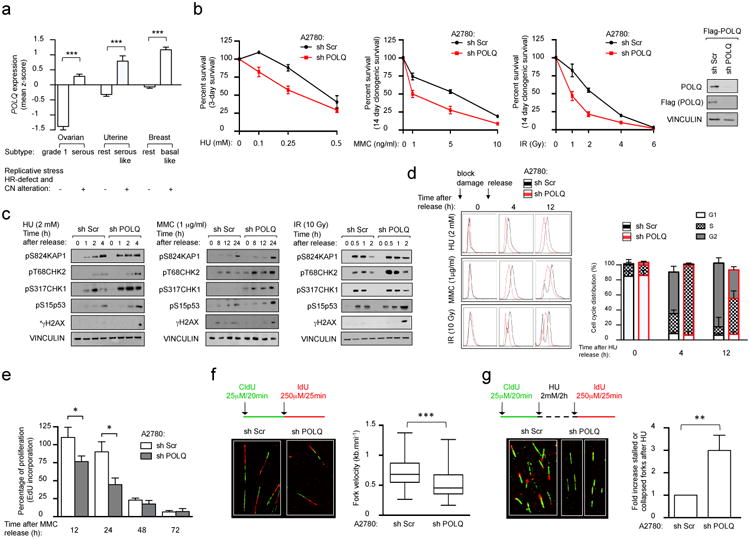
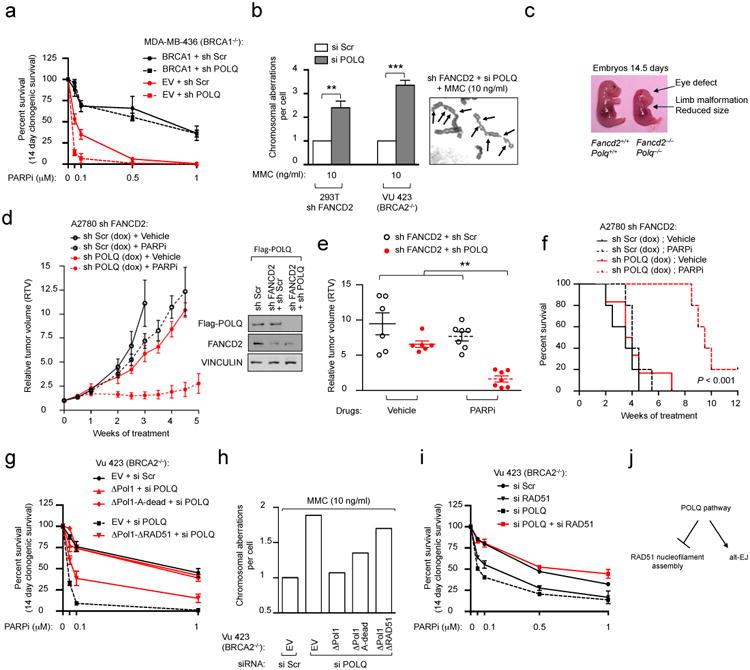
Large-scale genomic studies have shown that half of epithelial ovarian cancers (EOCs) have alterations in genes regulating homologous recombination (HR) repair. Loss of HR accounts for the genomic instability of EOCs and for their cellular hyper-dependence on alternative poly-ADP ribose polymerase (PARP)-mediated DNA repair mechanisms. Previous studies have implicated the DNA polymerase θ (Polθ also known as POLQ, encoded by POLQ) in a pathway required for the repair of DNA double-strand breaks, referred to as the error-prone microhomology-mediated end-joining (MMEJ) pathway. Whether Polθ interacts with canonical DNA repair pathways to prevent genomic instability remains unknown. Here we report an inverse correlation between HR activity and Polθ expression in EOCs. Knockdown of Polθ in HR-proficient cells upregulates HR activity and RAD51 nucleofilament assembly, while knockdown of Polθ in HR-deficient EOCs enhances cell death. Consistent with these results, genetic inactivation of an HR gene (Fancd2) and Polq in mice results in embryonic lethality. Moreover, Polθ contains RAD51 binding motifs and it blocks RAD51-mediated recombination. Our results reveal a synthetic lethal relationship between the HR pathway and Polθ-mediated repair in EOCs, and identify Polθ as a novel druggable target for cancer therapy.


Figures

Extended Data Figure 1
Extended Data Figure 1. POLQ is highly expressed in epithelial ovarian cancers (EOCs) and POLQ expression correlates with expression of HR genes
Gene set enrichment analysis (GSEA) for expression of TransLesion Synthesis (TLS) (a) and polymerase (b) genes between primary cancers and control samples in 28 independent datasets from 19 different cancers types. Enrichment values (represented as a single dot for each gene in a defined dataset) were determined using the rank metric score to compare expression values between cancers and control samples. Dots above the dashed line reflect enrichment in cancer samples, whereas dots below the dashed line show gene expression enriched in control samples. Datasets were ranked based on the amplitude of the rank metric score and plotted as shown. c, POLQ gene expression in 40 independent datasets from 19 different cancer types. For each dataset, POLQ values were expressed as fold-change differences relative to the mean expression in control samples, which was arbitrarily set to 1. d, POLQ expression correlates with tumor grade and MKi67 gene expression in the ovarian TCGA (n=494 patients with ovarian carcinoma (grade 1, n=5; grade 2, n=61; grade 3, n=428) and control samples, n=8). e, POLQ expression correlates with tumor grade MKi67 gene expression in the ovarian dataset GSE9891 (n=251 patients with ovarian serous and endometrious carcinoma for which grade status was available (grade 1, n=20; grade 2, n=88; grade 3, n=143)). Statistical correlation was assessed using the Pearson test (for d: r=0.65, P < 10-3; for e: r=0.77, P < 10-3). f, Top-ranked biological pathways differentially expressed between samples expressing high levels of POLQ (high POLQ, 1st 33%, n=95) relative to samples with low POLQ expression (low POLQ, 67%, n=190) on the ovarian dataset GSE9891 (n=285 patients with ovarian carcinoma). Significance values were determined by the hypergeometrical test using the 200 most differentially expressed probesets between the 2 groups (high POLQ and low POLQ). g, GSEA for expression of DNA repair genes between primary cancers and control samples in 5 independent ovarian cancer datasets. A representative heat map showing differential gene expression between ovarian cancers and controls is shown from GSE14407. For each dataset, DNA repair genes were ranked based on the metric score reflecting their enrichment in cancer samples. The top 20 DNA repair genes primarily expressed in cancer samples compared to control samples is shown on the right. h, GSEA for the top 20 DNA repair genes defined in (g) between primary cancers and control samples in 40 independent cancer datasets. The nominal P-value was used as a measure of the expression enrichment in cancer samples and represented as a waterfall plot. When the gene set expression was enriched in control samples, the P-value was arbitrarily set to 1. i, POLQ expression correlates with RAD51 and FANCD2 gene expression in 285 samples from the ovarian dataset GSE9891. Statistical correlation was assessed using the Pearson test (r=0.71, P < 10-3). j, Top 10 genes that most closely correlated with POLQ expression (gene neighbors analysis) for 1046 cell lines from the CCLE collection. DNA repair activity for these genes is indicated in the table. Increased HR gene expression is known to positively correlate with improved response to platinum based chemotherapy (a surrogate of HR deficiency) and thus can be predictive of decreased HR activity,. Conceptually, a state of HR deficiency may lead to compensatory increased expression of other HR genes. k, Top-ranked Gene Ontology (GO) terms for the molecular functions encoded by the top 20 DNA repair genes defined in Extended Data Figure 1g. l, Schematic representation of POLQ domain structure with the helicases (BLM, RECQL4, RAD54B and RAD54L) that co-expressed with POLQ (from Extended Data Figure 1g). Conserved amino-acid sequences of ATP binding and hydrolysis motifs (namely Walker A and B) are indicated. Cox plots in c that show twenty-fifth to seventy-fifth percentiles, with lines indicating the median, and whiskers indicating the smallest and largest values. For d and e (top panels), each dot represents the expression value from one patient, brackets show mean ± s.e.m.
Extended Data Figure 2
Extended Data Figure 2. POLQ is a RAD51-interacting protein required for maintenance of genomic stability
a, siRNA sequences (siPOLQ1 and siPOLQ2) efficiently down-regulate exogenously transfected POLQ protein. POLQ levels were detected by immunoblotting with Flag or POLQ antibody (left) and by RT-qPCR using 2 different sets of POLQ primers (right). The asterisk on the immunoblot indicates a non-specific band. Expression was normalized using GAPDH as a reference gene. POLQ gene expression values are displayed as fold-change differences relative to the mean expression in control cells, which was arbitrarily set to 1. b, Quantification of baseline and HU-induced RAD51 foci in U2OS cells transfected with indicated siRNA. c, Quantification of baseline and HU-induced γH2AX foci in U2OS cells transfected with indicated siRNA. d, Quantification of IR-induced RAD51 foci in BrdU-positive U2OS cells transfected with indicated siRNA. e, POLQ inhibition by siRNA induced a decrease in the cellular survival of 293T cells treated with MMC in a 3-day survival assay. f, Quantification of chromosomal aberrations in 293T cells transfected with indicated siRNA. g, Schematic representation of POLQ truncation proteins used for RAD51 interaction studies. h, Endogenous RAD51 co-precipitates with Flag-tagged POLQ-ΔPol1 (POLQ-1-1416) but not POLQ-1633-Cter, each stably expressed in HeLa cells. i, Sequence alignment between the RAD51-interacting motifs of C. elegans RFS-1 and human POLQ. j, Schematic of POLQ domain structure with its homologs HELQ and POLN. All data show mean ± s.e.m.
Extended Data Figure 3
Extended Data Figure 3. Characterization of RAD51-interacting motifs in POLQ
a, Substitution peptide array probed with recombinant RAD51 and analyzed by immunoblotting. A 20-mer peptide spanning each of the RAD51 binding sites (shown in Fig. 1g) were created in which each amino acid of the original peptide was mutated to each of the 20 amino acids and RAD51 binding activity was tested. The amino acid change for each of the amino acids of the RAD51 interacting domain of POLQ is shown on the right. Ponceau staining was used to visualize position of the peptides within the array. b, GST-RAD51 pull-down with in vitro-translated POLQ proteins missing indicated amino acids. c, Schematic of POLQ mutants used in complementation studies. d, Quantification of IR-induced RAD51 foci in U2OS cells stably integrated with empty vector (EV) or POLQ- ΔPol1 cDNA, that is refractory to siPOLQ1. Cells were transfected with indicated siRNA and subsequently treated with IR. The number of cells with more than 10 RAD51 foci was calculated relative to control cells (si Scr). e, DR-GFP assay in U2OS cells stably integrated with empty vector (EV) or indicated POLQ cDNA constructs refractory to siPOLQ1 and transfected with indicated siRNA. All data show mean ± s.e.m.
Extended Data Figure 4
Extended Data Figure 4. POLQ is an ATPase that suppresses RAD51-ssDNA nucleofilament assembly and formation of RAD51-dependent D-loop structures
a, Representative ΔPol2 WT radiometric ATPase assay. b, Gel mobility shift assays with ΔPol2 WT and ssDNA. c, Coomassie-stained gel showing the purified ΔPol2-A-dead fragment. d, Representative ΔPol2-A-dead radiometric ATPase assay. e, Quantification of ΔPol2-A-dead ATPase activity. (ssDNA: single-stranded DNA; dsDNA: double-stranded DNA). f, Assembly/disruption of RAD51-ssDNA filaments in the presence of increasing amounts of ΔPol2 WT. The order in which each component was added to the reaction is noted above. g, Schematics of the formation of RAD51-dependent D-loop structures. h Formation of RAD51-containing D-loop structures following the addition of increasing amounts of ΔPol2 WT. i, Fraction of D-loop formed following the addition of increasing amounts of ΔPol2 WT. j, Effect of POLQ expression levels and HR status on tumor sensitivity to cisplatin or PARPi. Data in i shows mean ± s.e.m.
Extended Data Figure 5
Extended Data Figure 5. POLQ functions under replicative stress and is induced by HR deficiency
a, POLQ recruitment to the chromatin is enhanced by UV treatment. HeLa cells stably integrated with either Flag-tagged ΔPol1 or POLQ-1633-Cter (Extended Data Fig. 2g) were subjected to UV treatment. Cells were collected at indicated time points after UV treatment and IPs were performed on nuclear and chromatin fractions. b, HeLa cells stably integrated with ΔPol1 were treated with UV and harvested at indicated time points following UV exposure. POLQ and RAD51 co-precipitation is enhanced by UV treatment. c, Quantification of DNA fiber lengths isolated from WT or Polq-/- MEFs. d, Quantification of DNA fiber lengths isolated from WT or Polq-/- MEFs transfected with either EV, or POLQ cDNA constructs. e, POLQ gene expression was analyzed by RT-qPCR in HR-deficient ovarian cancer cell lines (PEO-1 and UWB1-289) compared with other ovarian cancer cell lines, HeLa (cervical cancer) cells and 293T (transformed human embryonic kidney) cells. Expression was normalized using GAPDH gene as a reference. POLQ expression values are displayed as fold-change relative to the mean expression in HR-proficient control cells, which was arbitrarily set to 1. f, POLQ gene expression analysis (RT-qPCR) in 293T cells transfected with siRNA targeting FANCD2, BRCA1 or BRCA2 (left panel) and in corrected PD20 cells (PD20 + FANCD2) relative to FANCD2-deficient cells (PD20) (right panel). Expression was normalized using GAPDH gene as a reference. POLQ expression values are presented as fold-change relative to the mean expression in control cells, which was arbitrarily set to 1. g, POLQ gene expression in 5 datasets of serous epithelial ovarian carcinoma (frequently associated with an HR deficiency) and 1 dataset of clear cell ovarian carcinoma (subgroup not associated with HR alterations). For each dataset, POLQ expression values are displayed as fold-change differences relative to the mean expression in control samples, which was arbitrarily set to 1. h, Progression-free survival (PFS) after first line platinum chemotherapy for patients with ovarian carcinoma (ovarian carcinoma TCGA). Statistical significance was assessed by the Log-Rank test (P < 10-2). i, Effect of siPOLQ and the different POLQ cDNA constructs on HR read-out. NA: not applicable. Box plots in c, d, and g show twenty-fifth to seventy-fifth percentiles, with lines indicating the median, and whiskers indicating the smallest and largest values. Data in e and f show mean ± s.e.m.
Extended Data Figure 6
Extended Data Figure 6. POLQ inhibition sensitizes HR-deficient tumors to cytotoxic drug exposure
Clonogenic formation of A2780 cells expressing Scrambled (Scr) shRNA or shRNAs against FANCD2 or BRCA2 with increasing amounts of MMC (a), UV (b) or IR (c). Clonogenic formation of A2780 cells expressing Scrambled (Scr) or FANCD2 shRNA, together with shRNA targeting POLQ, in increasing concentrations of CDDP (d), MMC (e) or PARPi (f). g, Inhibition of POLQ reduces the survival of A2780 cells after 3 days of continuous exposure to the ATM inhibitor Ku55933. h, Immunoblot analyses in A2780 cells expressing FANCD2 shRNA together with siRNA targeting POLQ or Scr at 24 hours after indicated MMC pulse treatment. i, FANCA-deficient fibroblasts (GM6418) were infected with a whole-genome shRNA library and treated with MMC for 7 days. The fold-change enrichment of each shRNA after MMC treatment was determined by sequencing relative to the infected cells before treatment. TP53 depletion is known to improve survival of FANCA-/- cells. WRN depletion has recently been shown to be synthetically lethal with HR deficiency. Each column represents the mean of at least 2 independent shRNAs. All data show mean ± s.e.m.
Extended Data Figure 7
Extended Data Figure 7. HR and POLQ repair pathways are synthetical lethal in vivo
a, Genotypes frequencies of offspring from interbred Fancd2+/−Polq+/− mice. Ψ: four Fancd2-/-Polq-/- offsprings were observed with several congenital malformations and premature death within 48 hours of birth. b, Description of Fancd2−/−Polq−/− offspring generated in the study. The offspring presented congenital malformations (i.e., eye defects) together with reduced size and body weight. The arrow shows absence of the right eye. c, Genotypes frequencies of E13.5 to E15 embryos (13.5 to 15 days post coitum) from interbred Fancd2+/−Polq+/− mice. d, Description of congenital malformations and their measured frequencies observed in E13.5 to E15 Fancd2−/−Polq−/− embryos generated in the study. e, Clonogenic formation of WT, Fancd2-/-, Polq-/- and Fancd2−/−Polq−/− MEFs with increasing concentrations of PARPi. f, A2780 cells were transduced with indicated shRNAs and xenotransplanted into both flanks of athymic nude mice. The tumor volumes for individual mice were measured biweekly for 8 weeks. Each group represents n ≥ 5 tumors from n ≥ 5 mice. g, Ki67 and γH2AX quantification in tumors treated with either vehicle or PARPi. h, Representative Ki67 and γH2AX staining of A2780-shFANCD2 xenografts expressing sh Scr or sh POLQ in athymic nude mice, treated with either vehicle or PARPi. Scale bars, 100 μM. i, In vivo competition assay design. j, Tumor chimerism post xenotransplantation for indicated conditions. k, Representative flow cytometry analysis of tumors before xenotransplantation (post FACS sorting) or after xenotransplantation (post transplant, PARPi). The percentage of GFP-RFP cells is indicated. l, Tumor chimerism post xenotransplantation for indicated conditions. For Data in j and l, each circle represents data from one tumor and each group represents n ≥ 7 tumors from n ≥ 6 mice. Brackets show mean ± s.e.m. Data in e-g show mean ± s.e.m. For f each group represents n ≥ 6 tumors from n ≥ 6 mice.
Extended Data Figure 8
Extended Data Figure 8. POLQ is required for HR-deficient cell survival and limits the formation of RAD51 structures in HR-deficient cells
a, Clonogenic formation of Fancd2-/-Polq-/- MEFs transfected with full-length POLQ cDNA constructs in the presence of increasing concentrations of PARPi. b, Chromosome breakage analysis of FANCD2-depleted cells that were first transfected with the indicated siRNA and full-length POLQ cDNA constructs refractory to siPOLQ1 and then exposed to MMC. c, DR-GFP assay in U2OS cells transfected with indicated siRNA. d, Quantification of baseline and IR-induced RAD51 foci in U2OS cells transfected with indicated siRNA. e, RAD51 recruitment to chromatin is enhanced by UV treatment. Vu423 cells (BRCA2-/-) were collected at indicated time points after UV treatment and immunoblotting performed on the cytoplasmic, nuclear and chromatin fractions. f, RAD51 recruitment to chromatin in Vu423 cells (BRCA2-/-) transfected with indicated siRNA. Histone H3 was used as a control for chromatin fractionation. All data show mean ± s.e.m.
Extended Data Figure 9
Extended Data Figure 9. POLQ participates in error-prone DNA repair
a, End-joining reporter assay in U2OS cells transfected with indicated siRNA and/or treated with PARPi. b, End-joining reporter assay in U2OS cells transfected with indicated siRNA and POLQ cDNA constructs refractory to siPOLQ1. c, UV damage-induced POLQ foci formation in U2OS cells. POLQ foci were abolished by pre-treatment with PARPi. d, Mutation frequency was determined in damaged supF plasmid, recovered from siRNA-treated 293T cells. e, Non-synonymous mutation count in ovarian, uterine and breast TCGA. All data show mean ± s.e.m.
Extended Data Figure 10
Extended Data Figure 10. Model depicting the role of POLQ in DNA repair
a, Mechanistic model for how POLQ limits RAD51-ssDNA filament assembly. According to this model, the ATPase domain of POLQ may prevent the assembly of RAD51 monomers into RAD51 polymers, perhaps by depleting local ATP concentrations. The RAD51 binding domains in the central region of POLQ may then sequester the RAD51 monomers, preventing filament assembly. b, I. Under physiological conditions, POLQ expression is low and its impact on repqir of DNA double-strand breaks (DSB) is limited. II. When HR deficiency occurs, POLQ is then highly expressed and channels DSB repair toward alt-EJ. III. In the case of an HR-defect, the loss of POLQ leads to cell death through the persistence of toxic RAD51 intermediates and inhibition of alt-EJ.
Figure 1
Figure 1. POLQ is a RAD51-interacting protein that suppresses HR
a, DR-GFP assay in U2OS cells transfected with indicated siRNA. b, Quantification of RAD51 foci in U2OS cells transfected with indicated siRNA. c, Endogenous RAD51 co-precipitates in vivo with purified full-length Flag-tagged POLQ from whole cell extracts. d, GST pull-down experiment with full-length Flag-tagged POLQ. (*: non-specific band). e, GST-RAD51 pull-down with in-vitro translated POLQ truncation mutants. f, GST-RAD51 pull-down with in-vitro translated POLQ versions missing indicated amino acids. g, Ponceau staining and immunoblotting of peptide arrays for the indicated POLQ motifs probed with recombinant RAD51. The POLQ amino acids spanning RAD51-interacting motifs are shown. Data in a and b represent mean ± s.e.m.
Figure 2
Figure 2. POLQ inhibits RAD51-mediated recombination
a, Schematic of POLQ mutants used in complementation studies and their interaction with RAD51. b, Quantification of RAD51 foci in U2OS cells transfected with indicated siRNA and POLQ cDNA constructs refractory to siPOLQ1. c, DR-GFP assay in U2OS cells transfected with indicated siRNA and POLQ cDNA constructs refractory to siPOLQ1. d, Coomassie-stained gel of the purified POLQ fragment. e, Quantification of POLQ ATPase activity. f, Quantification of POLQ binding to ssDNA and dsDNA. g, RAD51-ssDNA nucleofilament assembly assay. h, Assessment of RAD51-dependent D-loop formation. Data in b, c, e and f represent mean ± s.e.m.
Figure 3
Figure 3. POLQ promotes S phase progression and recovery of stalled forks
a, POLQ gene expression in subtypes of cancers with HR deficiency. b, Survival assays of A2780 cells exposed to the indicated DNA-damaging agents. Immunoblot showing silencing efficiency. c, Immunoblot analyses following pulse treatments with DNA-damaging agents (*γH2AX: see methods). d, Cell cycle progression of synchronized A2780 cells. A representative cell cycle distribution. e, Fraction of cycling A2780 cells measured by EdU incorporation. f, Quantification of DNA fiber lengths. g, Percentage of stalled forks. All experiments shown in a-d were performed in two cell lines (A2780 and 293T). All data represent mean ± s.e.m. except for box plots in f that show twenty-fifth to seventy-fifth percentiles, with lines indicating the median, and whiskers indicating the smallest and largest values.
Figure 4
Figure 4. Synthetic lethality between HR and POLQ repair pathways
a, Clonogenic formation of BRCA1-deficient (MDA-MB-436) cells expressing indicated cDNA together with indicated shRNA. b, Chromosome breakage analysis of HR-deficient cells transfected with the indicated siRNA. A representative image is shown. Arrows indicate chromosomal aberrations. c, Embryos at day 14 of gestation. d, Growth of indicated xenografts in vivo. Immunoblot showing silencing efficiency. e, Relative tumor volumes (RTV) for individual mice treated in (d) after three weeks of treatment. f, Overall survival for mice treated with vehicle or PARPi. Log-rank P < 10-3. Clonogenic formation (g) and chromosome breakage analysis (h) of BRCA2-deficient cells expressing POLQ cDNA constructs refractory to siPOLQ1 and transfected with the indicated siRNA. i, Clonogenic formation of BRCA2-deficient cells transfected with the indicated siRNA. j, Model for role of POLQ in DNA repair. Data in a, b, g and i represent mean ± s.e.m. For data in d-f, each circle represents data from one tumor and each group represents n ≥ 7 tumors from n ≥ 6 mice. Brackets show mean ± s.e.m.

Comment in

References

    1. Cancer Genome Atlas Research, N. Integrated genomic analyses of ovarian carcinoma. Nature. 2011;474:609–615. doi: 10.1038/nature10166. - DOI - PMC - PubMed
    1. Farmer H, et al. Targeting the DNA repair defect in BRCA mutant cells as a therapeutic strategy. Nature. 2005;434:917–921. doi: 10.1038/nature03445. - DOI - PubMed
    1. Bryant HE, et al. Specific killing of BRCA2-deficient tumours with inhibitors of poly(ADP-ribose) polymerase. Nature. 2005;434:913–917. doi: 10.1038/nature03443. - DOI - PubMed
    1. Kennedy RD, D'Andrea AD. DNA repair pathways in clinical practice: lessons from pediatric cancer susceptibility syndromes. Journal of clinical oncology : official journal of the American Society of Clinical Oncology. 2006;24:3799–3808. doi: 10.1200/JCO.2005.05.4171. - DOI - PubMed
    1. Bast RC, Jr, Hennessy B, Mills GB. The biology of ovarian cancer: new opportunities for translation. Nature reviews Cancer. 2009;9:415–428. doi: 10.1038/nrc2644. - DOI - PMC - PubMed

Additional References

    1. Kang J, D'Andrea AD, Kozono D. A DNA repair pathway-focused score for prediction of outcomes in ovarian cancer treated with platinum-based chemotherapy. Journal of the National Cancer Institute. 2012;104:670–681. doi: 10.1093/jnci/djs177. - DOI - PMC - PubMed
    1. Cancer Genome Atlas N. Comprehensive molecular portraits of human breast tumours. Nature. 2012;490:61–70. doi: 10.1038/nature11412. - DOI - PMC - PubMed
    1. Ceccaldi R, et al. Bone marrow failure in Fanconi anemia is triggered by an exacerbated p53/p21 DNA damage response that impairs hematopoietic stem and progenitor cells. Cell stem cell. 2012;11:36–49. doi: 10.1016/j.stem.2012.05.013. - DOI - PMC - PubMed
    1. Bennardo N, Cheng A, Huang N, Stark JM. Alternative-NHEJ is a mechanistically distinct pathway of mammalian chromosome break repair. PLoS genetics. 2008;4:e1000110. doi: 10.1371/journal.pgen.1000110. - DOI - PMC - PubMed
    1. Yusufzai T, Kadonaga JT. HARP is an ATP-driven annealing helicase. Science. 2008;322:748–750. doi: 10.1126/science.1161233. - DOI - PMC - PubMed

Publication types

MeSH terms

Substances