. 2015 Jan 16;7(1):2.
doi: 10.1186/s13321-014-0050-6. eCollection 2015.

A ranking method for the concurrent learning of compounds with various activity profiles

Affiliations

A ranking method for the concurrent learning of compounds with various activity profiles

Alexander Dörr et al. J Cheminform. .

Abstract

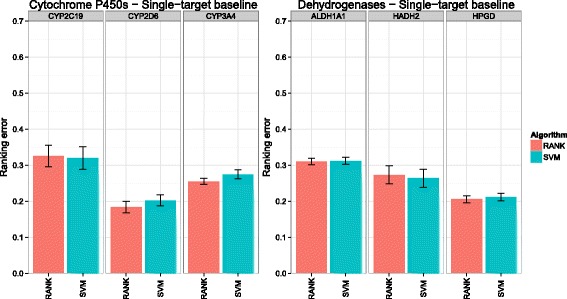
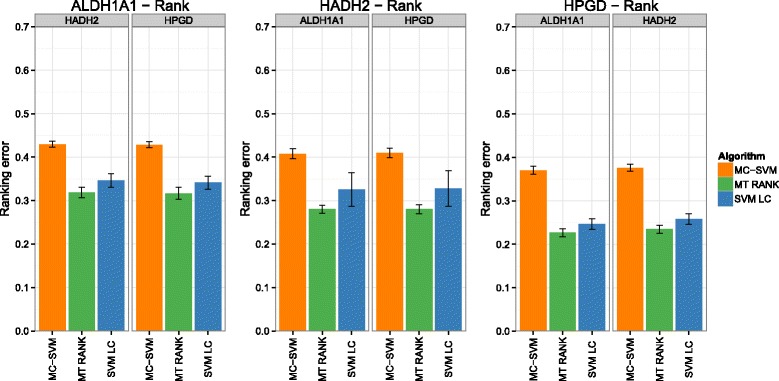
Background: In this study, we present a SVM-based ranking algorithm for the concurrent learning of compounds with different activity profiles and their varying prioritization. To this end, a specific labeling of each compound was elaborated in order to infer virtual screening models against multiple targets. We compared the method with several state-of-the-art SVM classification techniques that are capable of inferring multi-target screening models on three chemical data sets (cytochrome P450s, dehydrogenases, and a trypsin-like protease data set) containing three different biological targets each.

Results: The experiments show that ranking-based algorithms show an increased performance for single- and multi-target virtual screening. Moreover, compounds that do not completely fulfill the desired activity profile are still ranked higher than decoys or compounds with an entirely undesired profile, compared to other multi-target SVM methods.

Conclusions: SVM-based ranking methods constitute a valuable approach for virtual screening in multi-target drug design. The utilization of such methods is most helpful when dealing with compounds with various activity profiles and the finding of many ligands with an already perfectly matching activity profile is not to be expected.

Keywords: Machine learning; Multi-target; Ranking; Support vector machine; Virtual screening.


Figures

Figure 1
Figure 1
Overview of the workflow of different methods for multi-target screening. The example assumes a data set with a main target T1 and a secondary target T2 which should be avoided by the ligand. S V M Rank (a) and the multi-class SVM (b) learn the encoding s of the activity profile. Separate SVM models (c) predict the activity of i via act(i) and infer distinct classes based on the proposed encoding. The SVM with linear combinations (d) uses subsets of the data set to build several models that are combined before prediction. The encoding s of the desired activity profile is reflected in the factors c of the linear combinations.
Figure 2
Figure 2
Support vector classification (SVC). Illustration of an SVC classification function represented by w T x. The slack variables ξ i=y i w T x facilitate the trade-off between the size of the margin (indicated by a gray tube) and the error due to misclassifications. w denotes the weight vector, y i the label of instance i, and x is the feature vector. ξ i can assume a positive value between 0 and for 1 for training instances located in the margin. For instances on the wrong side of the margin ξ i is less than 0. Support vectors are indicated by a red ring.
Figure 3
Figure 3
Ranking SVM. The learning algorithm of the ranking SVM yields a weight vector w that minimizes the pairwise loss dependent on the margin when the training instances are projected onto w. The overall ranking error is reduced to approximate the given ordering in the training set as effectively as possible along w. The principle of margin re-scaling allows for a ranking dependent on the degree of discrepancy in the ranking order and the pairwise loss is influenced by the k-partite ranking error. Therefore, ranking score 2 higher than score 4 is punished with a greater loss than a wrong order of the scores 4 and 3. This is indicated with an increasing margin dependent on the respective scores that are compared with each other.
Figure 4
Figure 4
Composition of the cytochrome P450 and dehydrogenase data sets. Both Venn diagrams show the composition of the active compounds with respect to their activity profiles in the cytochrome P450 data set (left) and the dehydrogenase data set (right).
Figure 5
Figure 5
Distribution of pK i values of the trypsin-like protease data set. This figure shows the distribution of pKi values of the three trypsin-like protease targets Factor Xa (FXa), Thrombin (Thr), and Trypsin (Try). The initial activity cutoff is drawn as a vertical dashed black line at 6.1.
Figure 6
Figure 6
Performance of the cytochrome P450 and dehydrogenase baseline data sets for single-target activity. Each boxplot depicts the mean ranking error on the 20 randomly generated test sets for each target. The given ranking error is equal to 1−A U C.
Figure 7
Figure 7
Performance of the cytochrome P450 and dehydrogenase baseline data sets for dual-target activity. Each boxplot depicts the mean ranking error on the 20 randomly generated test sets for each target. The given ranking error is equal to 1−A U C.
Figure 8
Figure 8
Performance of the cytochrome P450 and dehydrogenase single-target data sets with binary test sets. Each boxplot depicts the mean ranking error on the 20 randomly generated test sets for each target. The given ranking error is equal to 1−A U C.
Figure 9
Figure 9
Performance of the cytochrome P450 and dehydrogenase single-target data sets with ranking test sets. Each boxplot depicts the mean ranking error on the 20 randomly generated test sets for each target.
Figure 10
Figure 10
Performance of the cytochrome P450s single-target data set with binary test sets. Each boxplot depicts the mean ranking error on the 20 randomly generated test sets for each target separated according to the secondary target that should be avoided with higher priority. The given ranking error is equal to 1−A U C.
Figure 11
Figure 11
Performance of the dehydrogenases single-target data set with binary test sets. Each boxplot depicts the mean ranking error on the 20 randomly generated test sets for each target separated according to the secondary target that should be avoided with higher priority. The given ranking error is equal to 1−A U C.
Figure 12
Figure 12
Performance of the cytochrome P450s single-target data set with ranking test sets. Each boxplot depicts the mean ranking error on the 20 randomly generated test sets for each target separated according to the secondary target that should be avoided with higher priority.
Figure 13
Figure 13
Performance of the dehydrogenases single-target data set with ranking test sets. Each boxplot depicts the mean ranking error on the 20 randomly generated test sets for each target separated according to the secondary target that should be avoided with higher priority.
Figure 14
Figure 14
Performance of the cytochrome P450 and dehydrogenase dual-target data sets with binary test sets. Each boxplot depicts the mean ranking error on the 20 randomly generated test sets for each target. The given ranking error is equal to 1−A U C.
Figure 15
Figure 15
Performance of the cytochrome P450 and dehydrogenase dual-target data sets with ranking test sets. Each boxplot depicts the mean ranking error on the 20 randomly generated test sets for each target.
Figure 16
Figure 16
Performance of the cytochrome P450s dual-target data set with binary test sets. Each boxplot depicts the mean ranking error on the 20 randomly generated test sets for each target separated according to which of both main target should be regarded with higher priority. The given ranking error is equal to 1−A U C.
Figure 17
Figure 17
Performance of the dehydrogenases dual-target data set with binary test sets. Each boxplot depicts the mean ranking error on the 20 randomly generated test sets for each target separated according to which of both main target should be regarded with higher priority. The given ranking error is equal to 1−A U C.
Figure 18
Figure 18
Performance of the cytochrome P450s dual-target data set with ranking test sets. Each boxplot depicts the mean ranking error on the 20 randomly generated test sets for each target separated according to which of both main target should be regarded with higher priority.
Figure 19
Figure 19
Performance of the dehydrogenases dual-target data set with ranking test sets. Each boxplot depicts the mean ranking error on the 20 randomly generated test sets for each target separated according to which of both main target should be regarded with higher priority.
Figure 20
Figure 20
Performance of the trypsin-like protease data set with FXa as main target. Each boxplot depicts the mean ranking error on the 20 randomly generated test sets for each target separated according to the selected activity cutoff and which of the secondary targets should avoided with higher priority.

Similar articles

References

    1. Roth BL, Sheffler DJ, Kroeze WK. Magic shotguns versus magic bullets selectively non-selective drugs for mood disorders and schizophrenia. Nat Rev Drug Discov. 2004;3(4):353–9. doi: 10.1038/nrd1346. - DOI - PubMed
    1. Ashburn TT, Thor KB. Drug repositioning: identifying and developing new uses for existing drugs. Nat Rev Drug Discov. 2004;3(8):673–83. doi: 10.1038/nrd1468. - DOI - PubMed
    1. Kitano H. A robustness-based approach to systems-oriented drug design. Nat Rev Drug Discov. 2007;5(3):202–10. doi: 10.1038/nrd2195. - DOI - PubMed
    1. Zimmermann GR, Lehar J, Keith CT. Multi-target therapeutics: when the whole is greater than the sum of the parts. Drug Discov Today. 2007;12:34–42. doi: 10.1016/j.drudis.2006.11.008. - DOI - PubMed
    1. Hopkins AL. Network pharmacology. Nat Biotechnol. 2007;25(10):1110. doi: 10.1038/nbt1007-1110. - DOI - PubMed

LinkOut - more resources