

Analysis of rapid multi-focal-zone ARFI imaging
- PMID: 25643078
- PMCID: PMC4526238
- DOI: 10.1109/TUFFC.2014.006594
Analysis of rapid multi-focal-zone ARFI imaging
Abstract
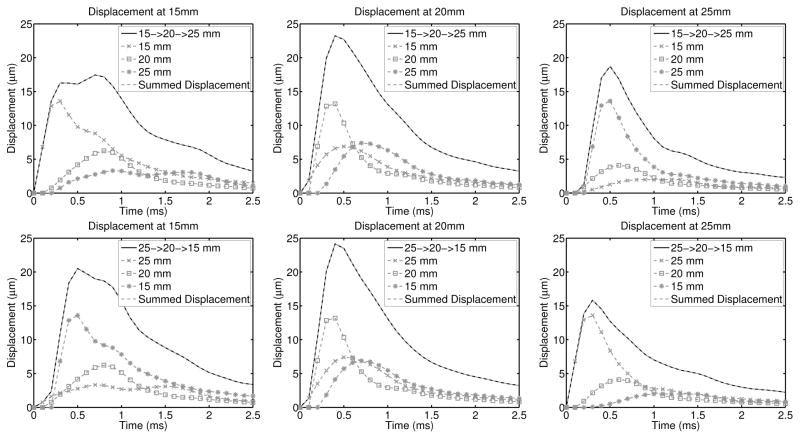
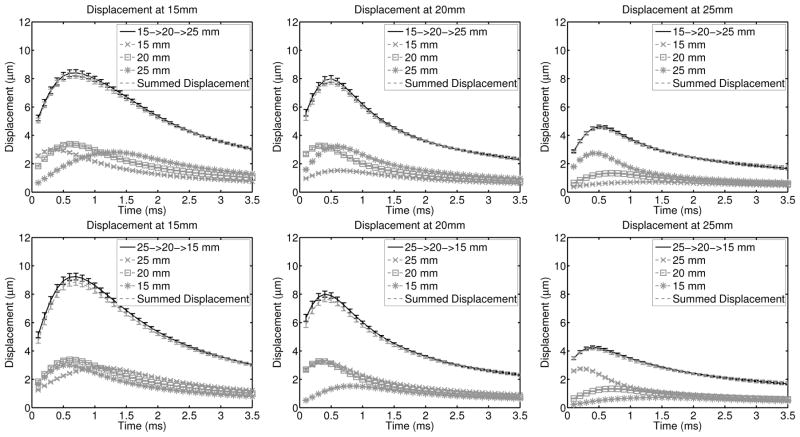
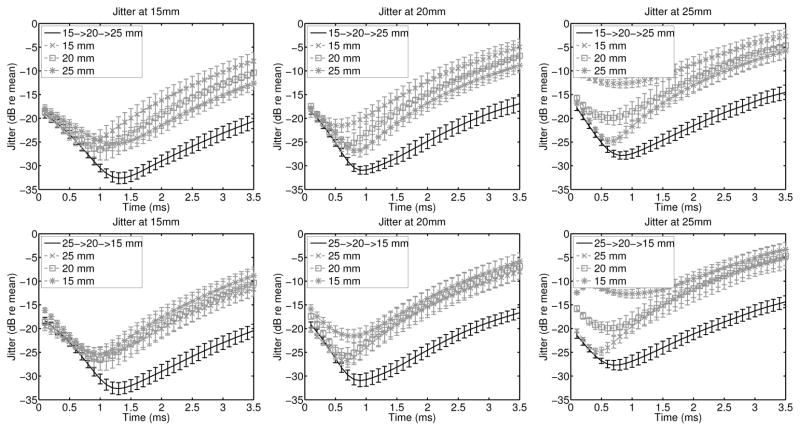
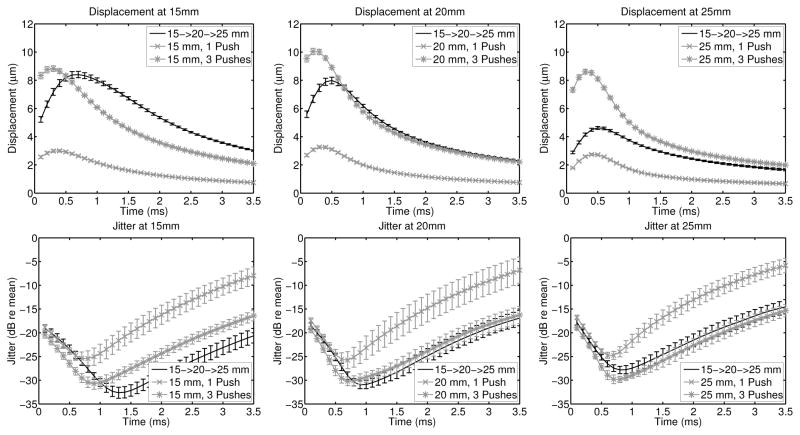
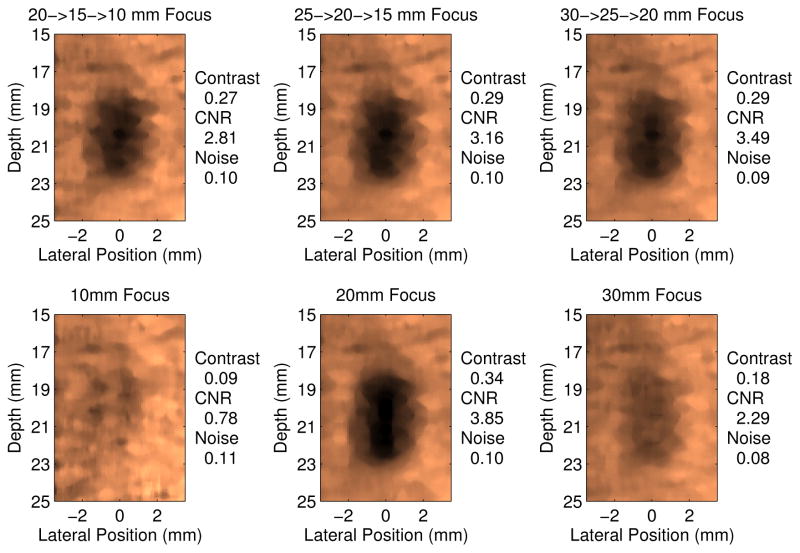
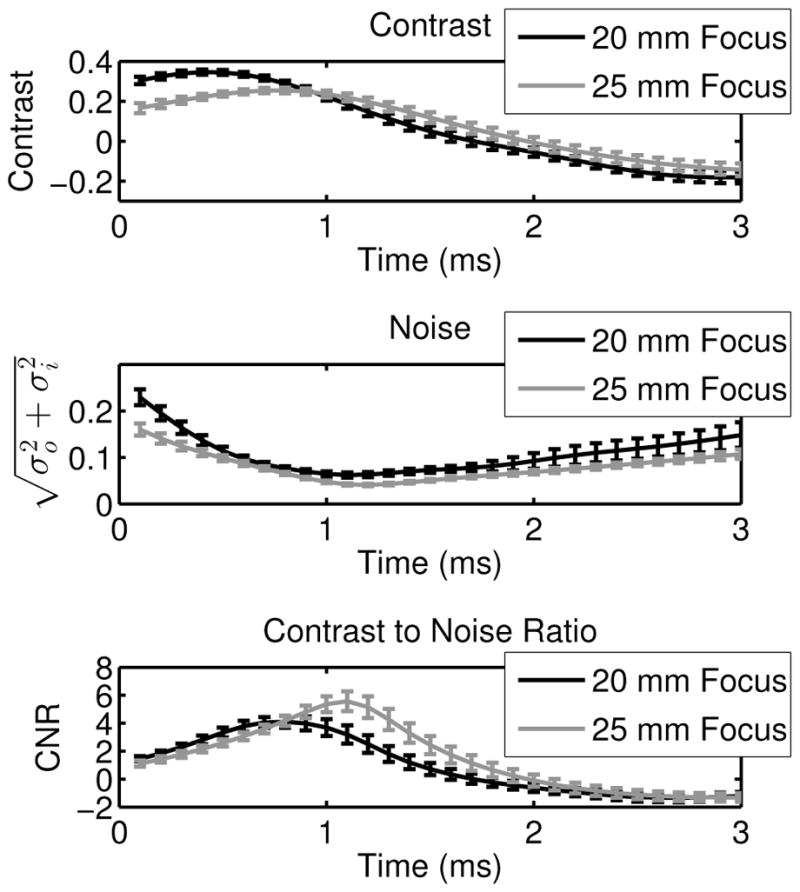
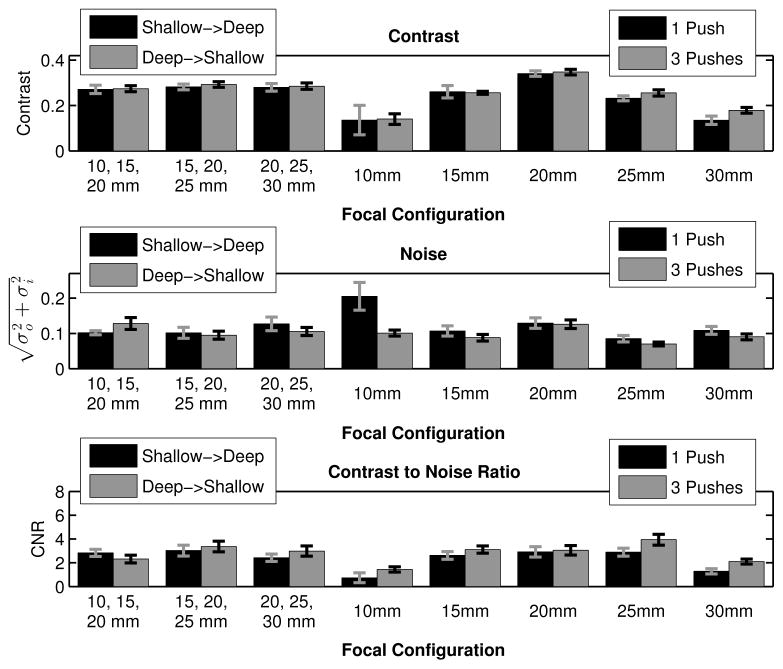
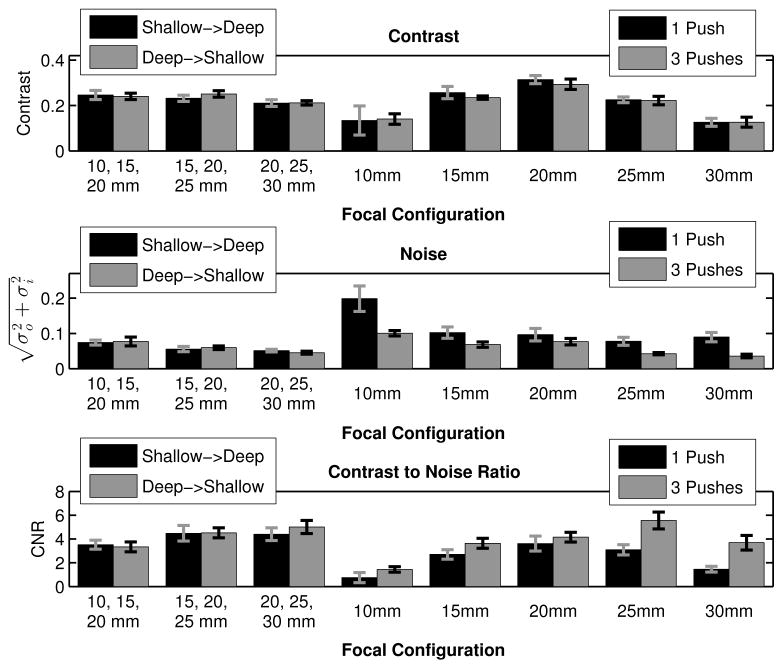
Acoustic radiation force impulse (ARFI) imaging has shown promise for visualizing structure and pathology within multiple organs; however, because the contrast depends on the push beam excitation width, image quality suffers outside of the region of excitation. Multi-focal-zone ARFI imaging has previously been used to extend the region of excitation (ROE), but the increased acquisition duration and acoustic exposure have limited its utility. Supersonic shear wave imaging has previously demonstrated that through technological improvements in ultrasound scanners and power supplies, it is possible to rapidly push at multiple locations before tracking displacements, facilitating extended depth of field shear wave sources. Similarly, ARFI imaging can utilize these same radiation force excitations to achieve tight pushing beams with a large depth of field. Finite element method simulations and experimental data are presented, demonstrating that single- and rapid multi-focal-zone ARFI have comparable image quality (less than 20% loss in contrast), but the multi-focal-zone approach has an extended axial region of excitation. Additionally, as compared with single-push sequences, the rapid multi-focalzone acquisitions improve the contrast-to-noise ratio by up to 40% in an example 4-mm-diameter lesion.
Figures
Similar articles
-
Combined ARFI and Shear Wave Imaging of Prostate Cancer: Optimizing Beam Sequences and Parameter Reconstruction Approaches.Ultrason Imaging. 2023 Jul;45(4):175-186. doi: 10.1177/01617346231171895. Epub 2023 May 2. Ultrason Imaging. 2023. PMID: 37129257 Free PMC article.
-
Harmonic tracking of acoustic radiation force-induced displacements.IEEE Trans Ultrason Ferroelectr Freq Control. 2013 Nov;60(11):2347-58. doi: 10.1109/TUFFC.2013.6644738. IEEE Trans Ultrason Ferroelectr Freq Control. 2013. PMID: 24158290 Free PMC article.
-
Modeling shear waves through a viscoelastic medium induced by acoustic radiation force.Int J Numer Method Biomed Eng. 2012 Jun-Jul;28(6-7):678-96. doi: 10.1002/cnm.1488. Epub 2012 Jan 17. Int J Numer Method Biomed Eng. 2012. PMID: 25364845
-
Multi-source and multi-directional shear wave generation with intersecting steered ultrasound push beams.IEEE Trans Ultrason Ferroelectr Freq Control. 2015 Apr;62(4):647-62. doi: 10.1109/TUFFC.2014.006805. IEEE Trans Ultrason Ferroelectr Freq Control. 2015. PMID: 25881343 Free PMC article.
-
Acoustic radiation force elasticity imaging in diagnostic ultrasound.IEEE Trans Ultrason Ferroelectr Freq Control. 2013 Apr;60(4):685-701. doi: 10.1109/TUFFC.2013.2617. IEEE Trans Ultrason Ferroelectr Freq Control. 2013. PMID: 23549529 Free PMC article. Review.
Cited by
-
Quality Measurement of Two-dimensional Shear Wave Speed Imaging for Breast Lesions: the Associated Factors and the Impact to Diagnostic Performance.Sci Rep. 2017 Jul 11;7(1):5076. doi: 10.1038/s41598-017-05281-5. Sci Rep. 2017. PMID: 28698632 Free PMC article.
-
Ultrasonographic Elastography of the Spleen for Diagnosing Neoplastic Myeloproliferation: Identifying the Most Promising Methods-A Systematic Review.J Clin Med. 2025 Jul 31;14(15):5400. doi: 10.3390/jcm14155400. J Clin Med. 2025. PMID: 40807021 Free PMC article. Review.
-
Performance of acoustic radiation force impulse ultrasound imaging for carotid plaque characterization with histologic validation.J Vasc Surg. 2017 Dec;66(6):1749-1757.e3. doi: 10.1016/j.jvs.2017.04.043. Epub 2017 Jul 13. J Vasc Surg. 2017. PMID: 28711401 Free PMC article.
-
Prostate Cancer Detection Using 3-D Shear Wave Elasticity Imaging.Ultrasound Med Biol. 2021 Jul;47(7):1670-1680. doi: 10.1016/j.ultrasmedbio.2021.02.006. Epub 2021 Apr 6. Ultrasound Med Biol. 2021. PMID: 33832823 Free PMC article.
-
Identifying Clinically Significant Prostate Cancers using 3-D In Vivo Acoustic Radiation Force Impulse Imaging with Whole-Mount Histology Validation.Ultrasound Med Biol. 2016 Jun;42(6):1251-62. doi: 10.1016/j.ultrasmedbio.2016.01.004. Epub 2016 Mar 3. Ultrasound Med Biol. 2016. PMID: 26947445 Free PMC article.
References
-
- Nightingale KR, Palmeri M, Nightingale R, Trahey G. On the feasibility of remote palpation using acoustic radiation force. J Acoust Soc Am. 2001;110:625–634. - PubMed
-
- Nightingale KR, Soo M, Nightingale R, Trahey GE. Acoustic radiation force impulse imaging: In vivo demonstration of clinical feasibility. Ultrasound Med Biol. 2002;28:227–235. - PubMed
-
- Sharma AC, Soo MS, Trahey GE, Nightingale KR, Congdon AN. Acoustic Radiation Force Impulse (ARFI) imaging of in vivo breast masses. IEEE Ultrasonics, Ferroelectrics and Frequency Control Joint Symposium. 2004;(1):728–731.
-
- Rosenzweig S, Palmeri M, Rouze N, Lipman S, Kulbacki E, Madden J, Polascik T, Nightingale K. Comparison of Concurrently Acquired In Vivo 3D ARFI and SWEI Images of the Prostate. IEEE Ultrasonics Symposium. 2012:97–100.
Publication types
MeSH terms
Grants and funding
LinkOut - more resources
Full Text Sources
Other Literature Sources
