

Modular construction of mammalian gene circuits using TALE transcriptional repressors
- PMID: 25643171
- PMCID: PMC4333066
- DOI: 10.1038/nchembio.1736
Modular construction of mammalian gene circuits using TALE transcriptional repressors
Abstract
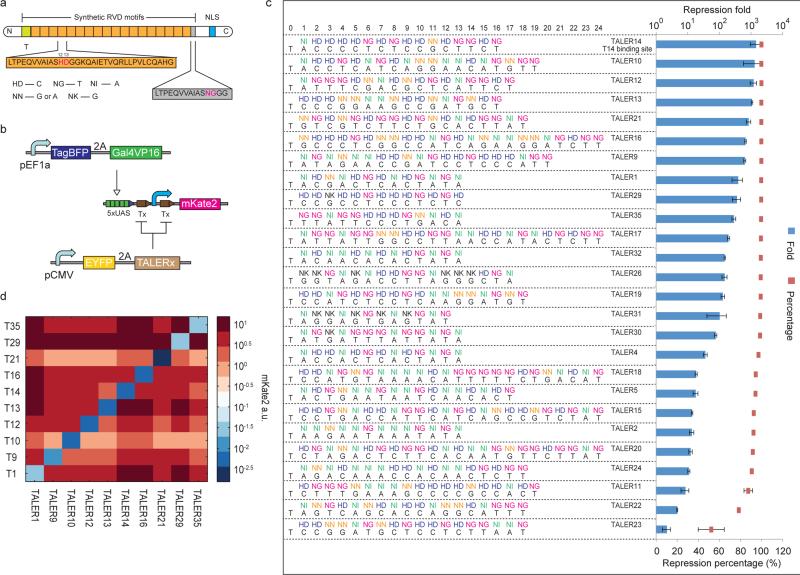
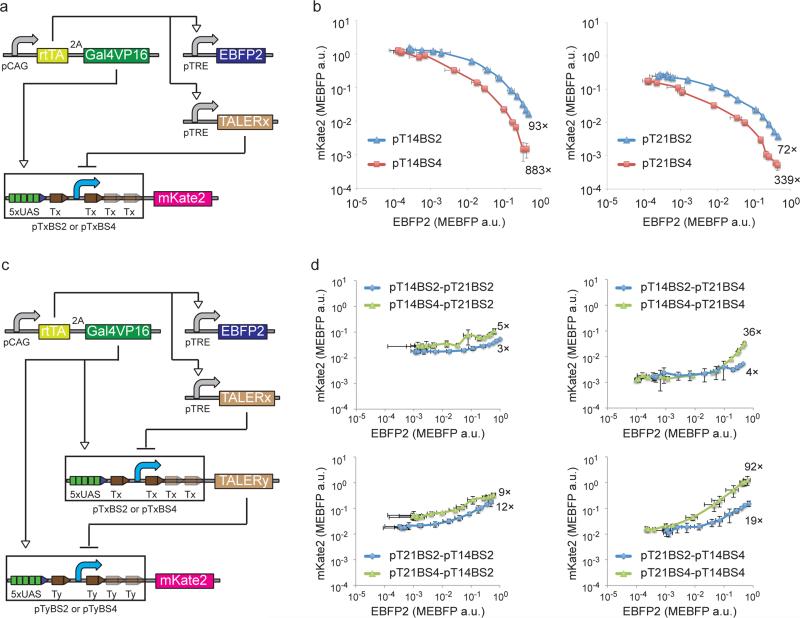
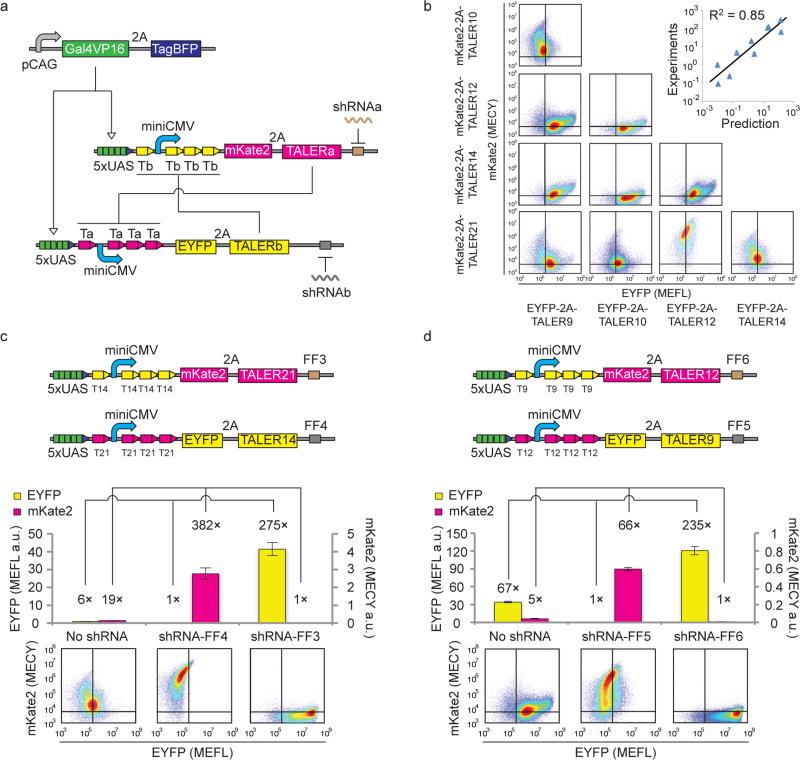
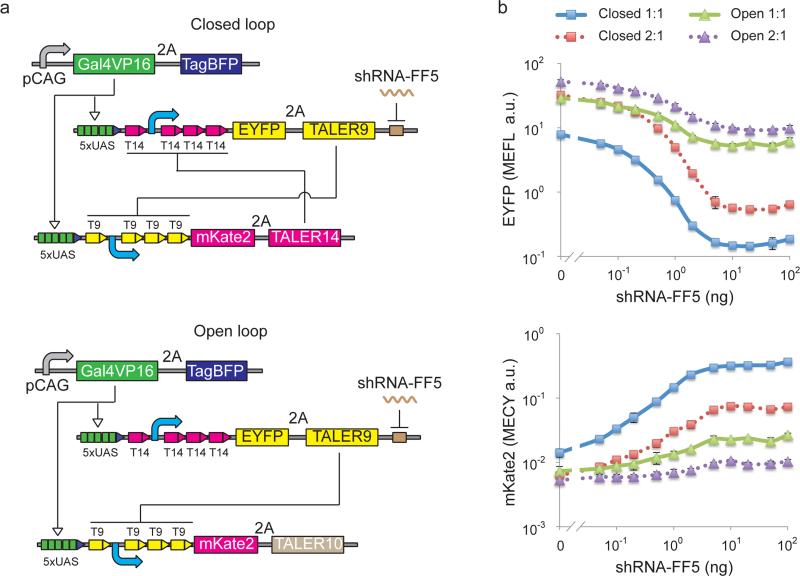
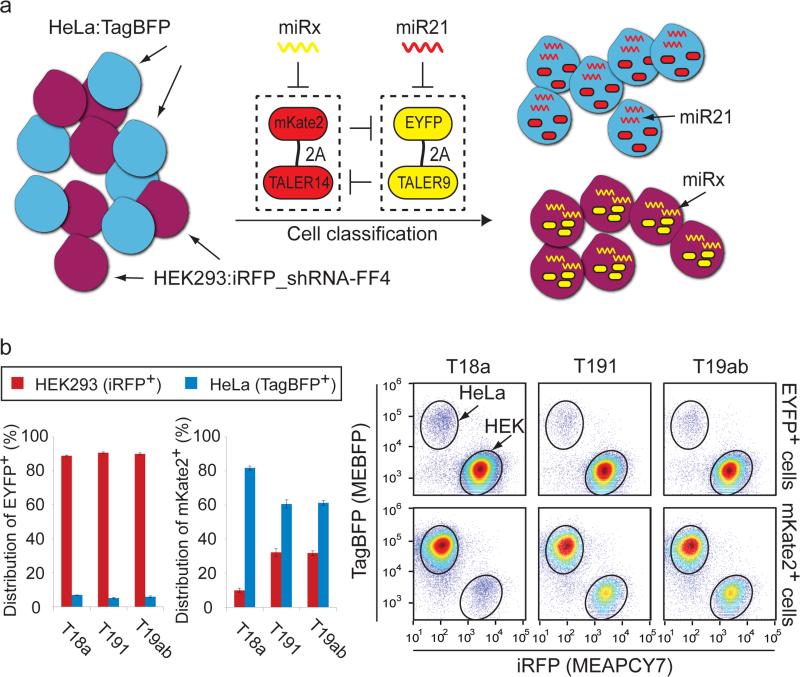
An important goal of synthetic biology is the rational design and predictable implementation of synthetic gene circuits using standardized and interchangeable parts. However, engineering of complex circuits in mammalian cells is currently limited by the availability of well-characterized and orthogonal transcriptional repressors. Here, we introduce a library of 26 reversible transcription activator-like effector repressors (TALERs) that bind newly designed hybrid promoters and exert transcriptional repression through steric hindrance of key transcriptional initiation elements. We demonstrate that using the input-output transfer curves of our TALERs enables accurate prediction of the behavior of modularly assembled TALER cascade and switch circuits. We also show that TALER switches using feedback regulation exhibit improved accuracy for microRNA-based HeLa cancer cell classification versus HEK293 cells. Our TALER library is a valuable toolkit for modular engineering of synthetic circuits, enabling programmable manipulation of mammalian cells and helping elucidate design principles of coupled transcriptional and microRNA-mediated post-transcriptional regulation.
Figures
Similar articles
-
Synthetic mammalian trigger-controlled bipartite transcription factors.Nucleic Acids Res. 2013 Jul;41(13):e134. doi: 10.1093/nar/gkt405. Epub 2013 May 17. Nucleic Acids Res. 2013. PMID: 23685433 Free PMC article.
-
Design, Assembly, and Characterization of TALE-Based Transcriptional Activators and Repressors.Methods Mol Biol. 2016;1338:71-88. doi: 10.1007/978-1-4939-2932-0_7. Methods Mol Biol. 2016. PMID: 26443215 Free PMC article.
-
Benchmarking of TALE- and CRISPR/dCas9-Based Transcriptional Regulators in Mammalian Cells for the Construction of Synthetic Genetic Circuits.ACS Synth Biol. 2016 Oct 21;5(10):1050-1058. doi: 10.1021/acssynbio.5b00259. Epub 2016 Jun 28. ACS Synth Biol. 2016. PMID: 27344932
-
Towards combinatorial transcriptional engineering.Biotechnol Adv. 2017 May-Jun;35(3):390-405. doi: 10.1016/j.biotechadv.2017.03.006. Epub 2017 Mar 11. Biotechnol Adv. 2017. PMID: 28300614 Review.
-
Synthetic gene networks in mammalian cells.Curr Opin Biotechnol. 2010 Oct;21(5):690-6. doi: 10.1016/j.copbio.2010.07.006. Epub 2010 Aug 4. Curr Opin Biotechnol. 2010. PMID: 20691580 Review.
Cited by
-
Programming gene and engineered-cell therapies with synthetic biology.Science. 2018 Feb 9;359(6376):eaad1067. doi: 10.1126/science.aad1067. Science. 2018. PMID: 29439214 Free PMC article. Review.
-
Repression of Divergent Noncoding Transcription by a Sequence-Specific Transcription Factor.Mol Cell. 2018 Dec 20;72(6):942-954.e7. doi: 10.1016/j.molcel.2018.10.018. Mol Cell. 2018. PMID: 30576656 Free PMC article.
-
In silico and in vitro protocols for quantifying gene expression noise modulated by microRNAs.STAR Protoc. 2022 Feb 26;3(1):101205. doi: 10.1016/j.xpro.2022.101205. eCollection 2022 Mar 18. STAR Protoc. 2022. PMID: 35243382 Free PMC article.
-
The Contribution of the Minimal Promoter Element to the Activity of Synthetic Promoters Mediating CAR Expression in the Tumor Microenvironment.Int J Mol Sci. 2022 Jul 4;23(13):7431. doi: 10.3390/ijms23137431. Int J Mol Sci. 2022. PMID: 35806439 Free PMC article.
-
Synthetic Biological Circuits within an Orthogonal Central Dogma.Trends Biotechnol. 2021 Jan;39(1):59-71. doi: 10.1016/j.tibtech.2020.05.013. Epub 2020 Jun 22. Trends Biotechnol. 2021. PMID: 32586633 Free PMC article. Review.
References
-
- Tigges M, Marquez-Lago TT, Stelling J, Fussenegger M. A tunable synthetic mammalian oscillator. Nature. 2009;457:309–312. - PubMed
-
- Gardner TS, Cantor CR, Collins JJ. Construction of a genetic toggle switch in Escherichia coli. Nature. 2000;403:339–342. - PubMed
-
- Kramer BP, et al. An engineered epigenetic transgene switch in mammalian cells. Nat Biotechnol. 2004;22:867–870. - PubMed
Publication types
MeSH terms
Substances
Grants and funding
LinkOut - more resources
Full Text Sources
Other Literature Sources
