

Lipid vesicles trigger α-synuclein aggregation by stimulating primary nucleation
- PMID: 25643172
- PMCID: PMC5019199
- DOI: 10.1038/nchembio.1750
Lipid vesicles trigger α-synuclein aggregation by stimulating primary nucleation
Abstract
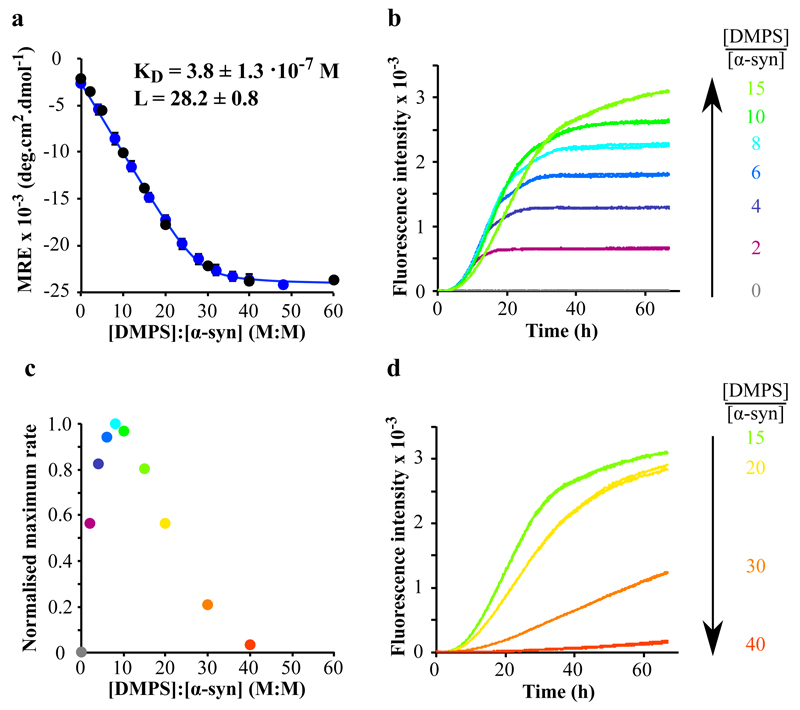
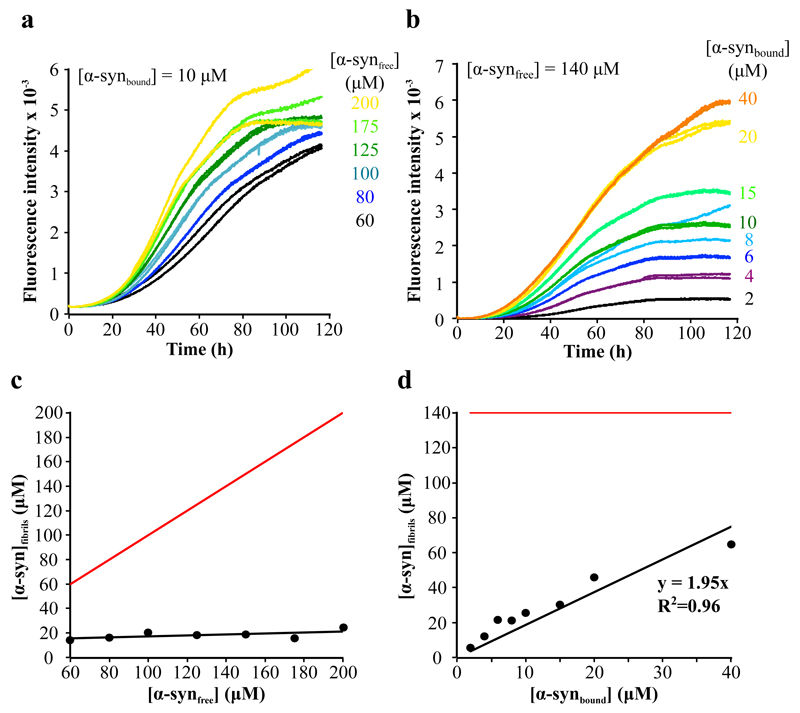
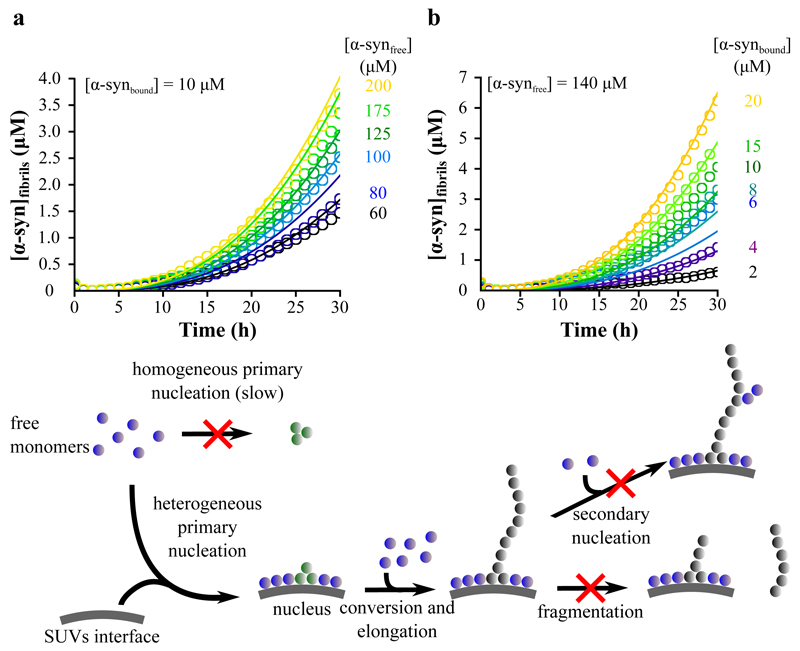
α-Synuclein (α-syn) is a 140-residue intrinsically disordered protein that is involved in neuronal and synaptic vesicle plasticity, but its aggregation to form amyloid fibrils is the hallmark of Parkinson's disease (PD). The interaction between α-syn and lipid surfaces is believed to be a key feature for mediation of its normal function, but under other circumstances it is able to modulate amyloid fibril formation. Using a combination of experimental and theoretical approaches, we identify the mechanism through which facile aggregation of α-syn is induced under conditions where it binds a lipid bilayer, and we show that the rate of primary nucleation can be enhanced by three orders of magnitude or more under such conditions. These results reveal the key role that membrane interactions can have in triggering conversion of α-syn from its soluble state to the aggregated state that is associated with neurodegeneration and to its associated disease states.
Conflict of interest statement
The authors declare they have no competing interests as defined by Nature Publishing Group, or other interests that might be perceived to influence the results and discussion reported in this paper.
Figures


Comment in
-
Protein aggregation: close encounters of the greasy kind.Nat Chem Biol. 2015 Mar;11(3):176-7. doi: 10.1038/nchembio.1759. Nat Chem Biol. 2015. PMID: 25689332 No abstract available.
Similar articles
-
Effects of phosphatidylcholine membrane fluidity on the conformation and aggregation of N-terminally acetylated α-synuclein.J Biol Chem. 2018 Jul 13;293(28):11195-11205. doi: 10.1074/jbc.RA118.002780. Epub 2018 May 31. J Biol Chem. 2018. PMID: 29853639 Free PMC article.
-
Biasing the native α-synuclein conformational ensemble towards compact states abolishes aggregation and neurotoxicity.Redox Biol. 2019 Apr;22:101135. doi: 10.1016/j.redox.2019.101135. Epub 2019 Feb 5. Redox Biol. 2019. PMID: 30769283 Free PMC article.
-
The Role of Lipids Interacting with α-Synuclein in the Pathogenesis of Parkinson's Disease.J Parkinsons Dis. 2017;7(3):433-450. doi: 10.3233/JPD-171103. J Parkinsons Dis. 2017. PMID: 28671142 Review.
-
Lipids: Key Players That Modulate α-Synuclein Toxicity and Neurodegeneration in Parkinson's Disease.Int J Mol Sci. 2020 May 7;21(9):3301. doi: 10.3390/ijms21093301. Int J Mol Sci. 2020. PMID: 32392751 Free PMC article. Review.
-
Cholesterol-containing lipid nanodiscs promote an α-synuclein binding mode that accelerates oligomerization.FEBS J. 2021 Mar;288(6):1887-1905. doi: 10.1111/febs.15551. Epub 2020 Sep 26. FEBS J. 2021. PMID: 32892498
Cited by
-
"Prion-like" seeding and propagation of oligomeric protein assemblies in neurodegenerative disorders.Front Neurosci. 2024 Aug 5;18:1436262. doi: 10.3389/fnins.2024.1436262. eCollection 2024. Front Neurosci. 2024. PMID: 39161653 Free PMC article. Review.
-
Large self-assembled clathrin lattices spontaneously disassemble without sufficient adaptor proteins.PLoS Comput Biol. 2022 Mar 21;18(3):e1009969. doi: 10.1371/journal.pcbi.1009969. eCollection 2022 Mar. PLoS Comput Biol. 2022. PMID: 35312692 Free PMC article.
-
Glycoconjugate journal special issue on: the glycobiology of Parkinson's disease.Glycoconj J. 2022 Feb;39(1):55-74. doi: 10.1007/s10719-021-10024-w. Epub 2021 Nov 10. Glycoconj J. 2022. PMID: 34757539 Review.
-
Solution NMR of SNAREs, complexin and α-synuclein in association with membrane-mimetics.Prog Nucl Magn Reson Spectrosc. 2018 Apr;105:41-53. doi: 10.1016/j.pnmrs.2018.02.001. Epub 2018 Feb 8. Prog Nucl Magn Reson Spectrosc. 2018. PMID: 29548366 Free PMC article. Review.
-
α-Synuclein Aggregation Is Triggered by Oligomeric Amyloid-β 42 via Heterogeneous Primary Nucleation.J Am Chem Soc. 2023 Aug 23;145(33):18276-18285. doi: 10.1021/jacs.3c03212. Epub 2023 Aug 9. J Am Chem Soc. 2023. PMID: 37556728 Free PMC article.
References
-
- Bellucci A, Navarria L, Zaltieri M, Missale C, Spano P. Alpha-synuclein synaptic pathology and its implications in the development of novel therapeutic approaches to cure Parkinson's disease. Brain Res. 2012;1432:95–113. - PubMed
-
- Bellucci A, et al. From alpha-synuclein to synaptic dysfunctions: new insights into the pathophysiology of Parkinson's disease. Brain Res. 2012;1476:183–202. - PubMed
-
- Chiti F, Dobson CM. Protein misfolding, functional amyloid, and human disease. Annu Rev Biochem. 2006;75:333–66. - PubMed
-
- Dobson CM. Protein misfolding, evolution and disease. Trends Biochem Sci. 1999;24:329–32. - PubMed
-
- Knowles TP, Vendruscolo M, Dobson CM. The amyloid state and its association with protein misfolding diseases. Nat Rev Mol Cell Biol. 2014;15:384–396. - PubMed
Publication types
MeSH terms
Substances
Grants and funding
LinkOut - more resources
Full Text Sources
Other Literature Sources
Molecular Biology Databases
Miscellaneous
