. 2015 Mar;18(3):415-22.
doi: 10.1038/nn.3932. Epub 2015 Feb 2.

Epigenetic basis of opiate suppression of Bdnf gene expression in the ventral tegmental area

Affiliations

Epigenetic basis of opiate suppression of Bdnf gene expression in the ventral tegmental area

Ja Wook Koo et al. Nat Neurosci. 2015 Mar.

Abstract

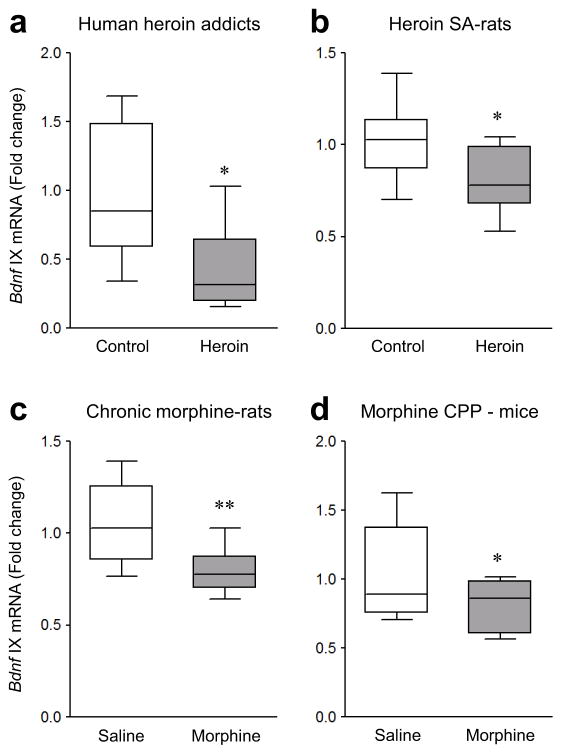
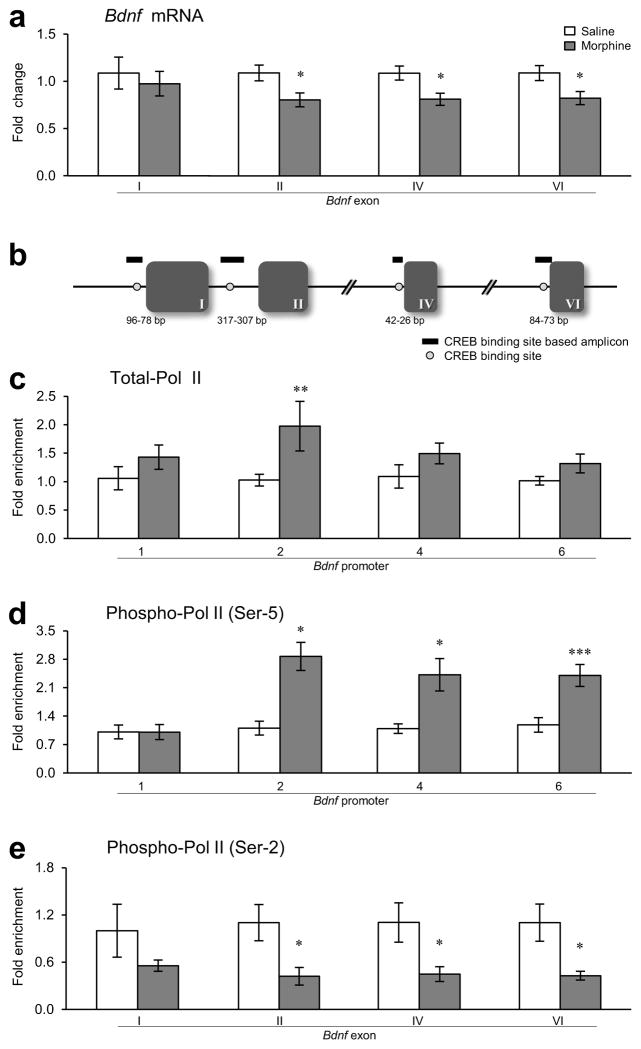
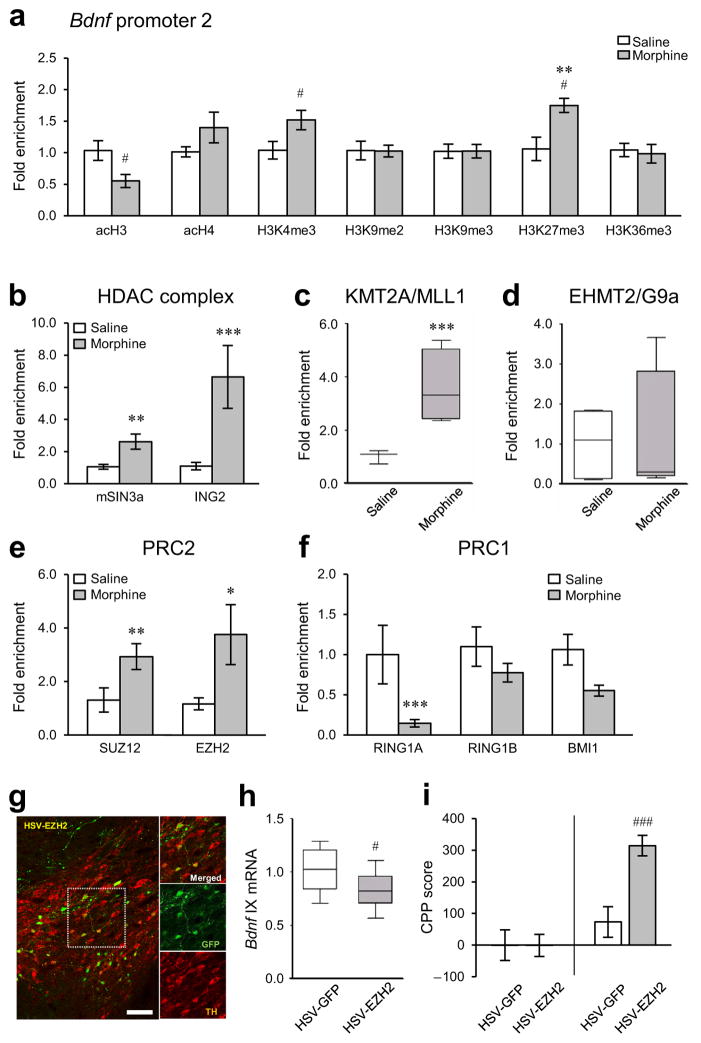
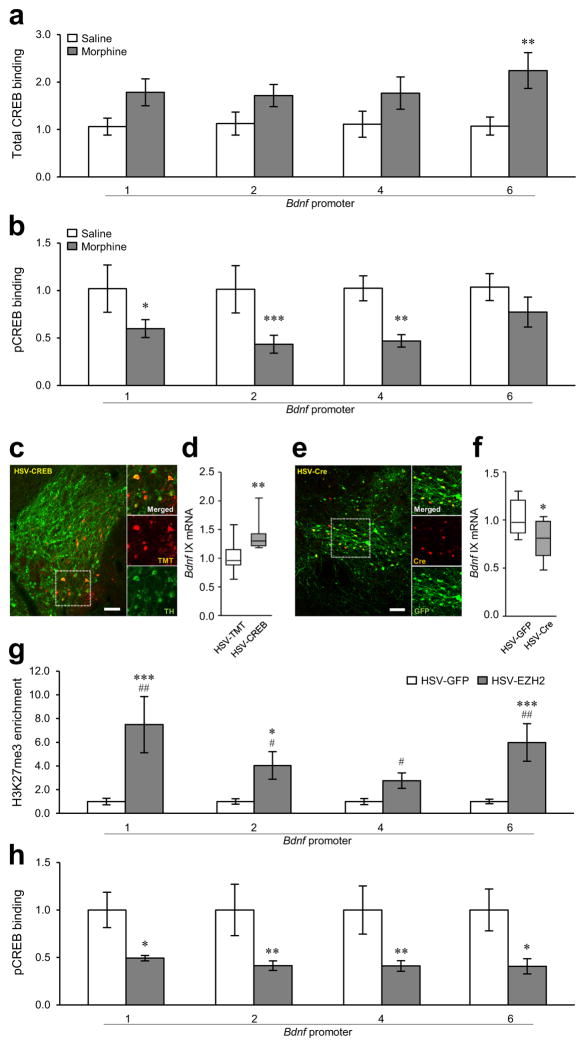
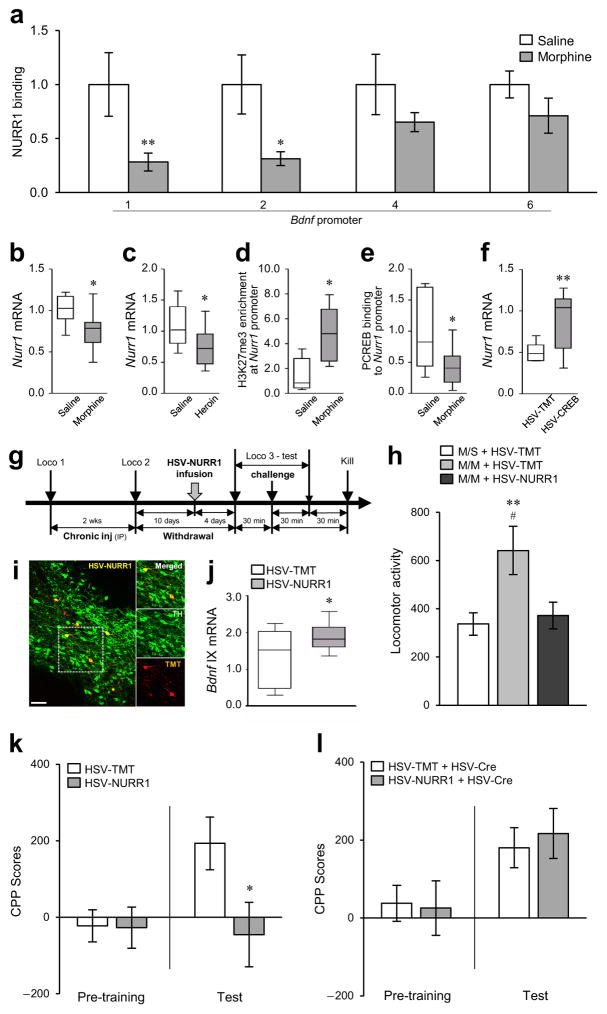
Brain-derived neurotrophic factor (BDNF) has a crucial role in modulating neural and behavioral plasticity to drugs of abuse. We found a persistent downregulation of exon-specific Bdnf expression in the ventral tegmental area (VTA) in response to chronic opiate exposure, which was mediated by specific epigenetic modifications at the corresponding Bdnf gene promoters. Exposure to chronic morphine increased stalling of RNA polymerase II at these Bdnf promoters in VTA and altered permissive and repressive histone modifications and occupancy of their regulatory proteins at the specific promoters. Furthermore, we found that morphine suppressed binding of phospho-CREB (cAMP response element binding protein) to Bdnf promoters in VTA, which resulted from enrichment of trimethylated H3K27 at the promoters, and that decreased NURR1 (nuclear receptor related-1) expression also contributed to Bdnf repression and associated behavioral plasticity to morphine. Our findings suggest previously unknown epigenetic mechanisms of morphine-induced molecular and behavioral neuroadaptations.


Conflict of interest statement

Competing Financial Interests: The authors declare no competing financial interests.

Figures

Figure 1
Figure 1
Opiate-induced down-regulation of Bdnf expression in human, rat, and mouse VTA. (a) qPCR showed that mRNA levels of Bdnf exon IX were reduced in VTA of human heroin addicts compared to control subjects (unpaired Student’s t-test, t12 = 2.623, p = 0.0223, n = 5,9 human samples). (b,c) mRNA levels of Bdnf exon IX were decreased in VTA of heroin self-administering rats (b, t-test, t22 = 2.793, p = 0.0106, n = 10,14 rats), and in VTA of rats given 14 daily morphine injections (5 mg/kg, IP) and examined after 14 days of withdrawal (c, t-test, t16 = 2.923, p = 0.00995, n = 9 rats), compared to respective control groups. (d) Morphine conditioned place preference (CPP) (15 mg/kg, IP) also decreased mRNA levels of Bdnf exon IX in mouse VTA compared to saline-treated mice (t-test, t22 = 2.155, p = 0.0423, n = 12 mice). Unpaired t-tests, *p < 0.05 and **p < 0.01. Box plots present, in ascending order, minimum sample value, first quartile, median, third quartile, maximum sample value.
Figure 2
Figure 2
Effect of chronic morphine on expression of Bdnf exons and on binding of Pol II to the Bdnf gene in rat VTA. (a) qPCR showed that mRNA levels of Bdnf exons II, IV, and VI were decreased in rat VTA after chronic (14 days) morphine administration followed by 14 days of withdrawal (as in Fig. 1c) relative to saline controls [two-way analysis of variance (ANOVA), drug effect: F1,64 = 12.898, p < 0.001; region effect: F3,64 = 0.923, p = 0.435; drug×region effect: F3,64 = 0.328, p = 0.805, n = 9 rats]. (b) Schematic diagram depicting the relative position of amplicons (green thick lines) generated by primers used to quantify immunoprecipitated chromatin-DNA. Exons are represented as boxes and the introns as lines. Numbers of the exons are indicated in roman numerals. The positions of CREB binding sites (red circles) at Bdnf promoter regions are indicated relative to the transcription start site of exon I (96-84 bp/90-78 bp), exon II (317-307 bp), exon IV (42-33 bp/36-26 bp), and exon VI (84-73 bp). Primer information is provided in Supplementary Table 3. (c) qChIP showed that binding of total-Pol II to Bdnf-p2 was increased in response to chronic morphine (drug effect: F1,39 =13.279, p < 0.001; region effect: F3,39 = 1.019, p = 0.395; drug×region effect: F3,39 = 1.096, p = 0.362, n = 6 rats). (d) Binding of phospho-Ser5-Pol II to Bdnf-p2, -p4, and -p6 was also increased in VTA of morphine-treated rats (drug effect: F1,31 = 18.820, p < 0.001; region effect: F3,31 =6.474, p = 0.002; drug×region effect: F3,31= 2.069, p = 0.069, n = 5 rats). (e) In contrast, binding of phospho-Ser2-Pol II to Bdnf-eII, -eIV, and -eVI was decreased after morphine exposure (drug effect: F1,32 = 19.921, p < 0.001; region effect: F3,32 = 0.00309, p = 1.000; drug×region effect: F3,32 = 0.165, p = 0.919, n = 5 rats). Two-way ANOVA with Fisher’s protected least significant difference (PLSD) post hoc tests, *p < 0.05, **p < 0.01, and ***p < 0.001. Bar graphs show mean ± SEM.
Figure 3
Figure 3
Morphine-induced histone modifications at Bdnf promoters in rat VTA. (a) qChIP showed that chronic morphine (14 days of morphine administration followed by 14 days of withdrawal; Fig. 1c) selectively altered H3K27me3 (two-way ANOVA, drug effect: F1,22 = 0.144, p = 0.708; region effect: F3,22 = 6.442, p = 0.003; drug×region effect: F3,22 = 6.178, p = 0.003, n = 4 rats, Supplementary Fig. 2f) at Bdnf-p2, particularly. Chronic morphine changed acH4 (drug effect: F1,27 = 11.509, p = 0.002; region effect: F3,27 = 0.482, p = 0.698; drug×region effect: F3,27 = 0.184, p = 0.906, n = 5, 4 rats, Supplementary Fig. 2b) at Bdnf-p4 in rat VTA, with no changes seen in several other histone modifications analyzed. Additional post hoc analyses with Student’s t-tests showed that chronic morphine also changed acH3 (unpaired t-test, t6= 2.581, p = 0.0417, n = 4 rats) and H3K4me3 (t-test, t8 = 2.312, p = 0.0495, n = 5 rats) at Bdnf-p2 in VTA. Histone modifications by chronic morphine at other Bdnf promoters (Bdnf-p1, -p4, and -p6) are available in the Supplementary Fig. 2a–g. (b) Binding of mSIN3a (two-way ANOVA, drug effect: F1,36 = 25.829, p < 0.001; region effect: F3,36 = 0.541, p = 0.653; drug×region effect: F3,36 = 0.464, p = 0.709, n = 6,5 rats) and ING2 (drug effect: F1,28 = 37.786, p < 0.001; region effect: F3,28 = 2.450, p = 0.614; drug×region effect: F3,28 = 0.552, p = 0.651, n = 5,4 rats), core components of a major repressor complex, to Bdnf-p2 were increased by chronic morphine. (c) Consistent with enhancement in H3K4me3 levels, binding of MLL1 (KMT2A) to Bdnf-p2 was increased by chronic morphine (drug effect: F1,23 = 24.884, p < 0.001; region effect: F3,23 = 2.285, p = 0.106; drug×region effect: F3,23 = 2.177, p = 0.118, n = 4 rats). (d) There was no morphine-induced alteration in binding of G9a (EHMT2) to Bdnf-p2 (drug effect: F1,27 = 0.00384, p = 0.951; region effect: F3,27 = 0.153, p = 0.927; drug×region effect: F3,27 = 0.153, p = 0.927, n = 5,4 rats). (e) Consistent with enhancement in H3K27me3 levels, binding of SUZ12 (drug effect: F1,24 = 12.662, p = 0.002; region effect: F3,24 = 1.211, p = 0.327; drug×region effect: F3,24 = 0.526, p = 0.668, n = 4 rats) and EZH2 (drug effect: F1,20 =16.872, p < 0.001; region effect: F3,20 = 1.209, p = 0.332; drug×region effect: F3,20 = 1.111, p = 0.368, n = 4,3 rats), members of PRC2, to Bdnf-p2 was enhanced by chronic morphine. (f) In contrast, binding of PRC1 members, RING1A (drug effect: F1,24 = 13.708, p < 0.001; region effect: F3,24 = 0.0154, p = 0.997; drug×region effect: F3,24 = 2.713, p = 0.067, n = 4 rats) and BMI1 (drug effect: F1,32 = 10.975, p <= 0.002; region effect: F3,32 = 0.117, p = 0.950; drug×region effect: F3,32 = 0.0345, p = 0.991, n = 5 rats), to Bdnf-p2 were decreased by chronic morphine, but RING1B binding was unaffected (drug effect: F1,23 =1.372, p = 0.253; region effect: F3,23 = 0.267, p = 0.848; drug×region effect: F3,23 = 0.298, p = 0.827, n = 4 rats). Morphine-induced epigenetic alterations by key histone modifying enzymes and related regulatory proteins at other Bdnf promoters (Bdnf- p1, -p4, and -p6) are available in Supplementary Fig. 2h–p. (g) Representative low-magnification photomicrographs with an inset depicting localized HSV-mediated EZH2 expression (GFP+, green) in dopaminergic neurons (TH+, red) in mouse VTA (scale bar, 50 μm). The results were replicated in three independent experiments. (h) Intra-VTA HSV-EZH2 suppressed the expression of Bdnf exon IX mRNA in mouse VTA compared to HSV-GFP controls (unpaired t-test, t16 = 2.168, p = 0.0456, n = 9 mice). (i) EZH2 overexpression in mouse VTA dramatically enhances morphine reward (t-test, t22 = 4.134, p = 0.000435, n = 12 mice). Two-way ANOVA with Fisher’s PLSD post hoc tests, *p < 0.05, **p < 0.01, and ***p < 0.001; t-tests, #p < 0.05 and ###p < 0.001. Bar graphs show mean ± SEM. Box plots present, in ascending order, minimum sample value, first quartile, median, third quartile, maximum sample value.
Figure 4
Figure 4
Chronic morphine regulation of CREB binding to Bdnf promoters in VTA. (a) Chronic morphine (14 days of morphine administration followed by 14 days of withdrawal; Fig. 1c) increased total-CREB binding to Bdnf-p6 in rat VTA, with no effects seen at other Bdnf promoters (two-way ANOVA, drug effect: F1,32 = 15.053, p < 0.001; region effect: F3,32 = 0.371, p = 0.774; drug×region effect: F3,32 = 0.412, p = 0.745, n = 5 rats). (b) In contrast, chronic morphine reduced phospho-CREB binding to Bdnf-p1, -p2, and -p4 (drug effect: F1,24 = 32.487, p < 0.001; region effect: F3,24 = 1.026, p = 0.399; drug×region effect: F3,24 = 0.834, p = 0.489, n = 4 rats). (c) Representative low-magnification photomicrographs with an inset depicting localized HSV-mediated CREB expression [tdTomato+ (TMT+), red] in dopaminergic neurons (TH+, green) in VTA of c57BL/6 mice (scale bar, 50 μm). (d) HSV-mediated CREB1 overexpression increases the expression of Bdnf exon IX in mouse VTA (Mann Whitney U test, U = 7, p = 0.006, n = 9,8 mice). (e) Representative low-magnification photomicrographs with an inset depicting localized HSV-mediated Cre expression (red) in dopaminergic neurons (TH+, green) in VTA of floxed CREB mice (scale bar, 50 μm). (c,e) Histological results were replicated in three independent experiments. (f) In contrast, knockdown of Creb1 in the VTA of floxed CREB mice decreases the expression of Bdnf exon IX (unpaired t-test, t18 = 2.506, p = 0.0220, n = 10 mice). (g) HSV-mediated EZH2 overexpression (in the absence of morphine) significantly increased H3K27me3 levels at Bdnf-p1, -p2, and -p6 (two-way ANOVA, drug effect: F1,48 = 35.413, p < 0.001; region effect: F3,48 = 2.318, p = 0.087; drug×region effect: F3,48 = 2.318, p = 0.087, n = 8,6 rats). Additional post hoc analyses with Mann Whitney U tests and Student’s t-tests showed that EZH2 overexpression increased H3K27me3 levels at all Bdnf-promoters examined (Bdnf-p1, U test, U = 5, p = 0.013; Bdnf-p2, t-test, t12 = 2.957, p = 0.012; Bdnf-p4, t-test, t12 = 2.781, p = 0.0166; Bdnf-p6, U test, U =2, p = 0.003). (h) EZH2 overexpression significantly reduced phospho-CREB binding to Bdnf-p1, -p2, -p4, and -p6 (two-way ANOVA, drug effect: F1,36 =25.091, p < 0.001; region effect: F3,36 = 0.182, p = 0.908; drug×region effect: F3,36 = 0.104, p = 0.957, n = 5,6 rats). (a,b,g,h) Two-way ANOVA with Fisher’s PLSD post hoc tests, *p < 0.05, **p < 0.01, and ***p < 0.001; (d) Mann-Whitney U test, **p < 0.01; (f) Student’s t-test, *p < 0.05; (g) Mann-Whitney U tests at Bdnf-p1 and -p6 and Student’s t-tests at Bdnf-p2 and -p4, #p < 0.05 and ##p < 0.01. Bar graphs show mean ± SEM. Box plots present, in ascending order, minimum sample value, first quartile, median, third quartile, maximum sample value.
Figure 5
Figure 5
Epigenetic regulation of Bdnf by NURR1 and its concomitant behavioral effects. (a) Chronic morphine (14 days of morphine administration followed by 14 days of withdrawal; Fig. 1c) decreased NURR1 binding to Bdnf-p1 and -p2 in rat VTA. Two-way ANOVA (drug effect: F1,27 = 17.990, p < 0.001; region effect: F3,27 = 0.403, p = 0.752; drug×region effect: F3,27 = 0.990, p = 0.412, n = 4,5 rats) with Fisher’s PLSD post hoc tests, *p < 0.05 and **p < 0.01. (b,c) Chronic morphine (b, unpaired t-test, t15 = 2.509, p = 0.0241, n = 9,8 rats) and self-administered heroin (c, t-test, t16 = 2.162, p = 0.0461, n = 8,10 rats) decreased Nurr1 mRNA expression in rat VTA. (d) H3K27me3 binding at the Nurr1 gene promoter was increased by chronic morphine in rat VTA (t-test, t8 = 2.733, p = 0.0257, n = 5 rats). (e) Binding of phospho-CREB to the Nurr1 gene promoter was decreased by chronic morphine in rat VTA (t-test, t16 = 2.285, p = 0.0363, n = 10,8 rats) (f) HSV-mediated CREB1 overexpression induced Nurr1 expression in mouse VTA (unpaired t-test with Welch’s correction, t9.496 = 2.935, p = 0.0157, n = 9 mice). (g) Scheme of the morphine treatment regimen used for locomotor tests in rats. HSV-NURR1 or its control HSV-TMT was infused into VTA of rats that were given chronic morphine (14 days, 5 mg/kg IP, followed by 10 days of withdrawal) and, 4 days later, the rats were challenged with morphine during the locomotor test. (h) Morphine-treated rats that were injected with HSV-TMT and then given a morphine challenge (M/M+HSV-TMT) showed higher locomotor activity compared to morphine-treated rats injected with HSV-TMT and then given a saline challenge (M/S+HSV-TMT). HSV-mediated overexpression of NURR1 in VTA blocked the morphine challenge-induced locomotor activation (M/M+HSV-NURR1). One-way ANOVA (F2,24 = 4.712, p = 0.0188, n = 10,8,9 rats) with Fisher’s PLSD post hoc tests, **p < 0.01 compared to M/S+HSV-TMT; #p < 0.05 compared to M/M+HSV-NURR1. (i) Representative low-magnification photomicrographs with an inset depicting localized HSV-NURR1 (TMT+, red) in dopaminergic neurons (TH+, green) of rat VTA (scale bar, 50 μm). The results were replicated in two independent experiments. (j) HSV-mediated NURR1 overexpression increased the expression of Bdnf exon IX mRNA in rat VTA (unpaired t-test with Welch’s correction, t10.98 = 2.440, p = 0.0328, n = 9,10 rats). (k) NURR1 overexpression in mouse VTA significantly decreased morphine reward (15 mg/kg, IP) (unpaired t-test, t13 = 2.165, p = 0.0496, n = 8,7 mice). (l) However, there was no effect of NURR1 overexpression on morphine reward in mice with a local knockout of BDNF in VTA (t-test, t17 = 0.4062, p = 0.690, n = 10,9 mice). (b–e,k,l) Student’s t-tests, *p < 0.05; (f,j) Student’s t-tests with Welch’s correction, *p < 0.05 and **p < 0.01. Bar graphs show mean ± SEM. Box plots present, in ascending order, minimum sample value, first quartile, median, third quartile, maximum sample value.

Comment in

References

    1. Lobo MK, et al. Cell type-specific loss of BDNF signaling mimics optogenetic control of cocaine reward. Science. 2010;330:385–390. - PMC - PubMed
    1. Pu L, Liu QS, Poo MM. BDNF-dependent synaptic sensitization in midbrain dopamine neurons after cocaine withdrawal. Nat Neurosci. 2006;9:605–607. - PubMed
    1. Russo SJ, Mazei-Robison MS, Ables JL, Nestler EJ. Neurotrophic factors and structural plasticity in addiction. Neuropharmacology. 2009;56 (Suppl 1):73–82. - PMC - PubMed
    1. Filip M, et al. Alterations in BDNF and trkB mRNAs following acute or sensitizing cocaine treatments and withdrawal. Brain Res. 2006;1071:218–225. - PubMed
    1. Graham DL, et al. Dynamic BDNF activity in nucleus accumbens with cocaine use increases self-administration and relapse. Nat Neurosci. 2007;10:1029–1037. - PubMed

Publication types

MeSH terms

LinkOut - more resources