. 2015 Feb 2:4:e04645.
doi: 10.7554/eLife.04645.

Vascular remodeling is governed by a VEGFR3-dependent fluid shear stress set point

Affiliations

Vascular remodeling is governed by a VEGFR3-dependent fluid shear stress set point

Nicolas Baeyens et al. Elife. .

Abstract

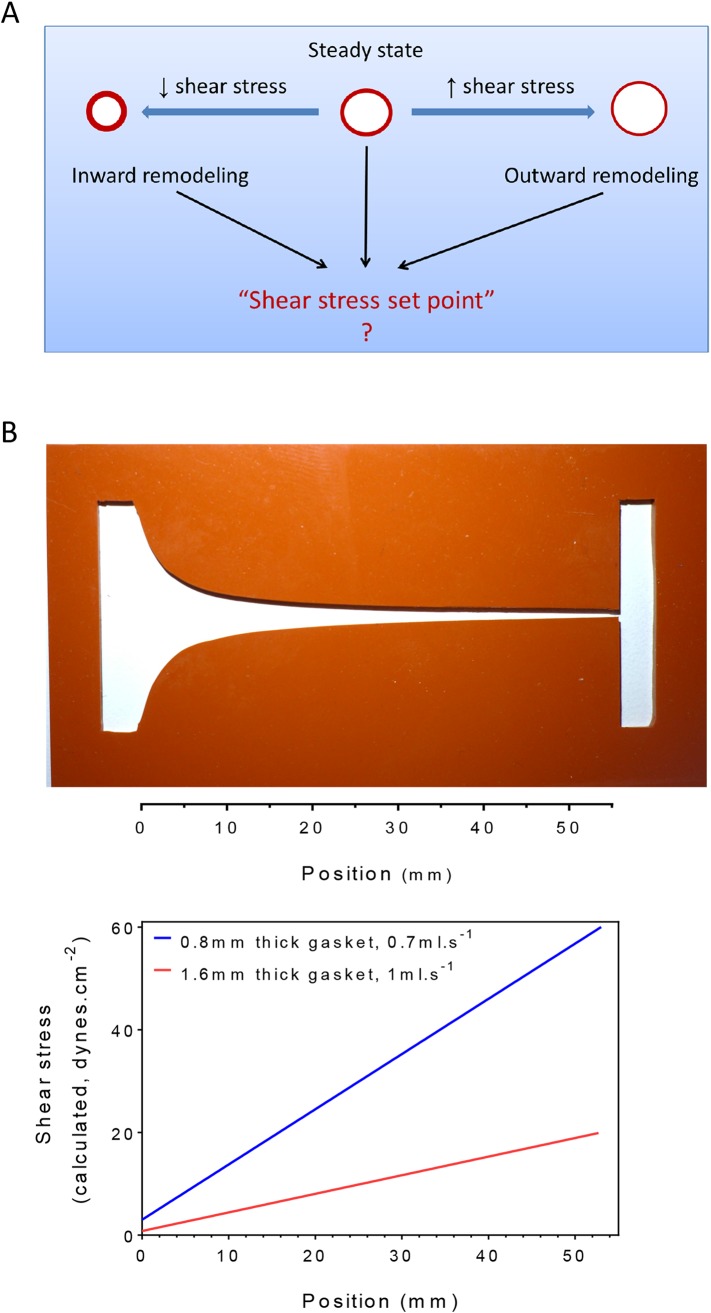
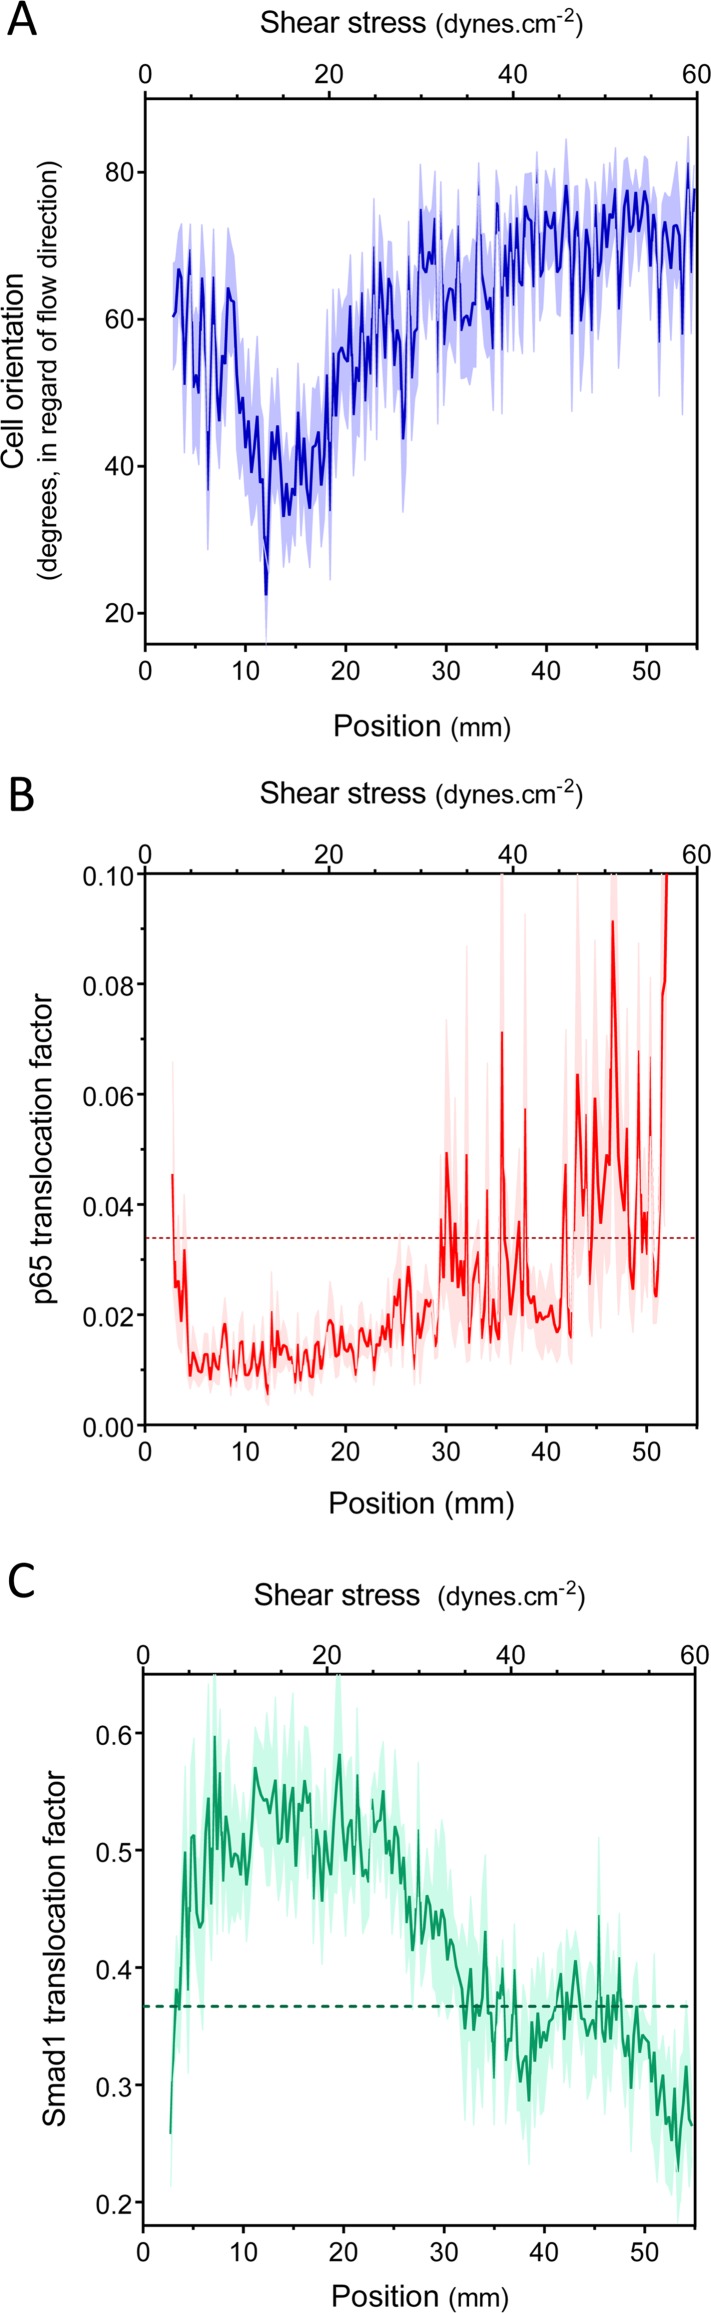
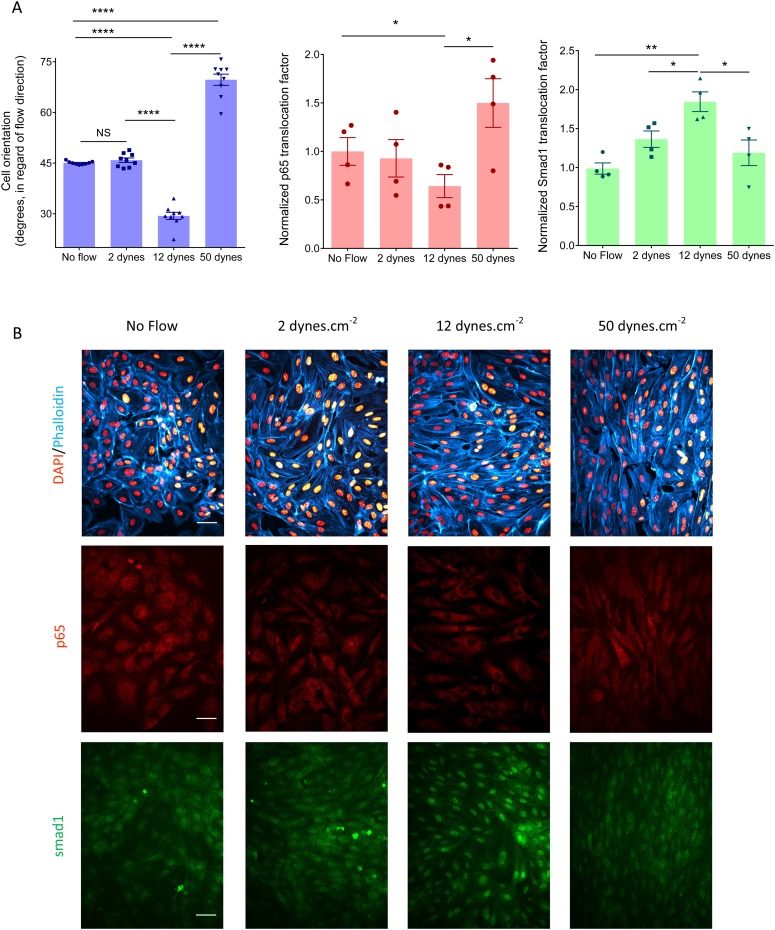
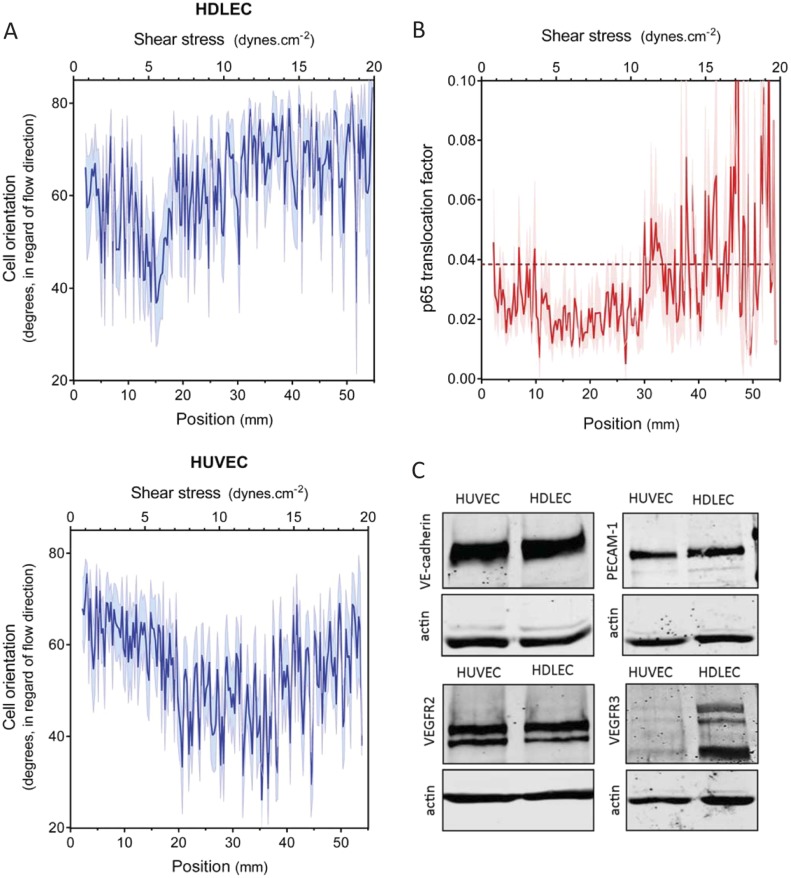
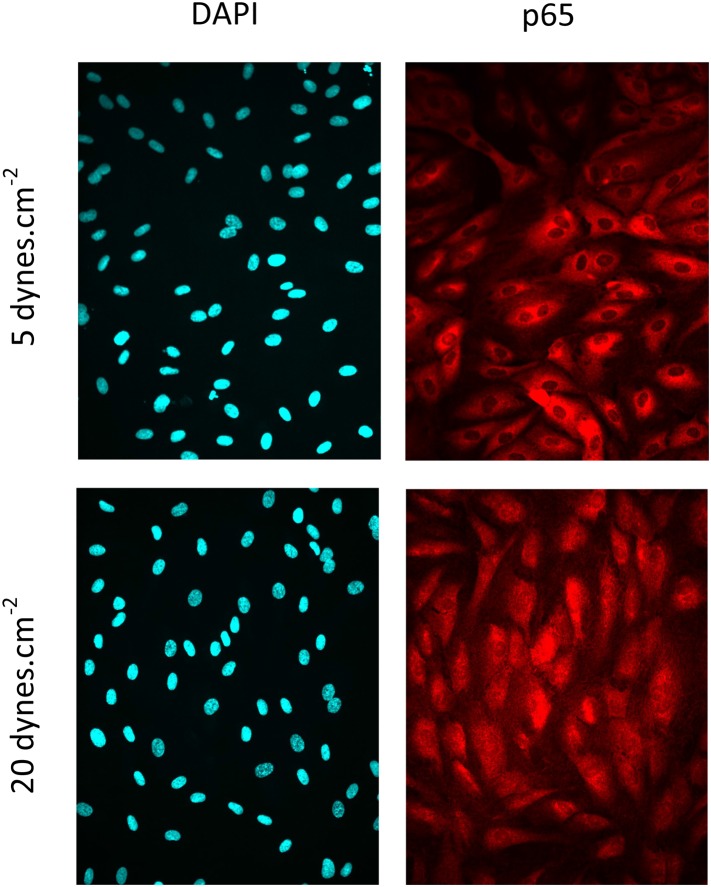
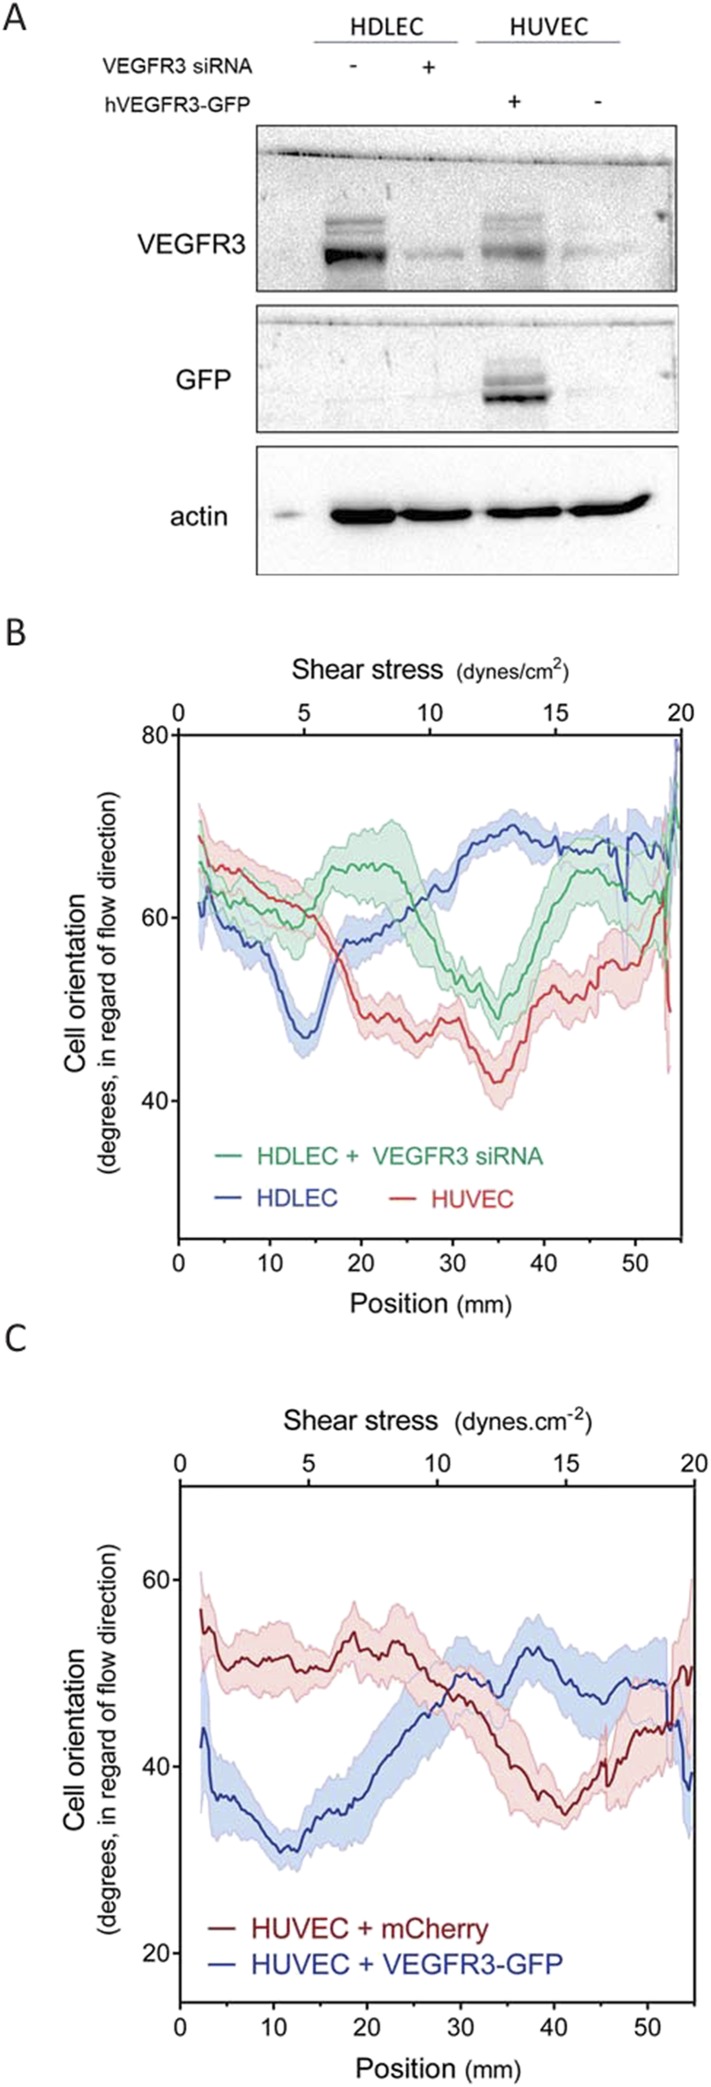
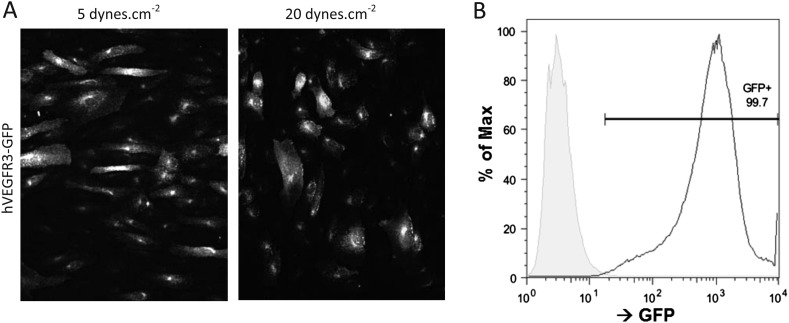
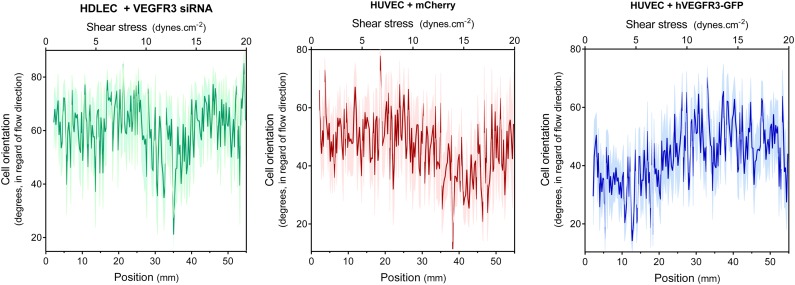
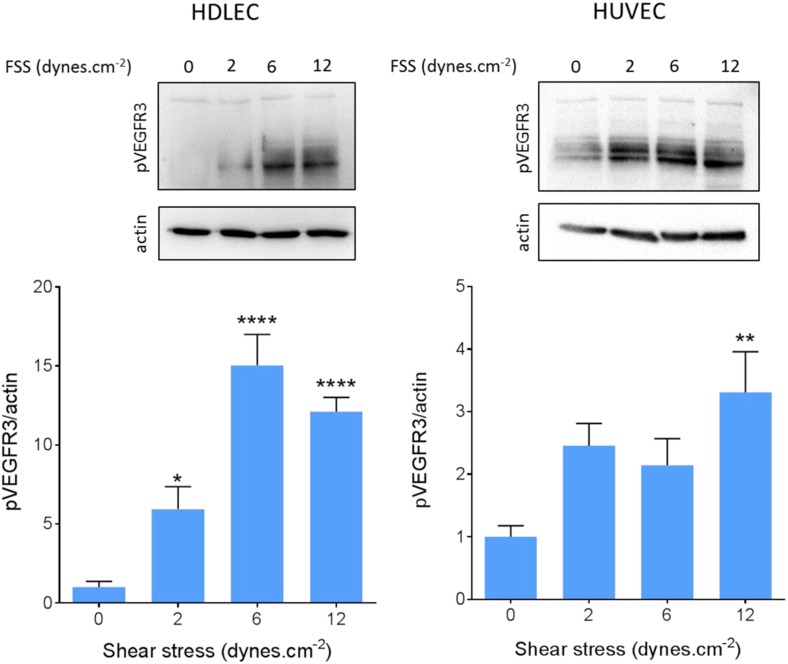
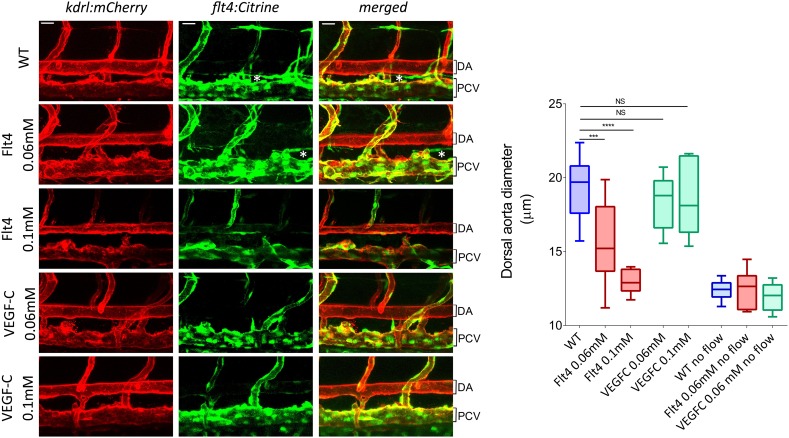
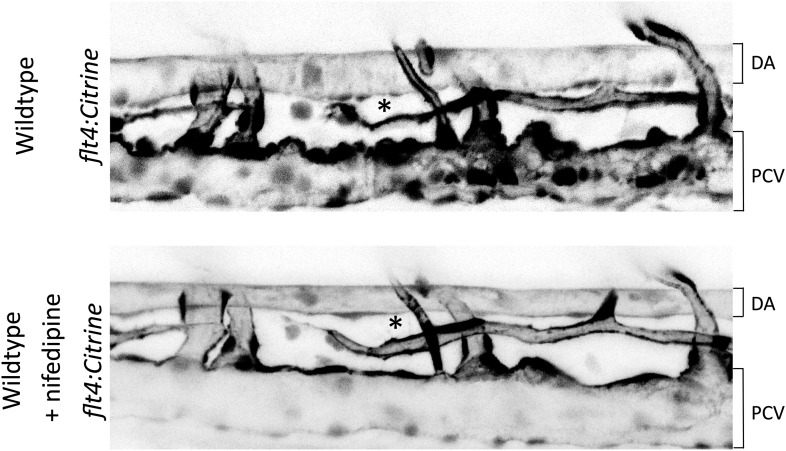
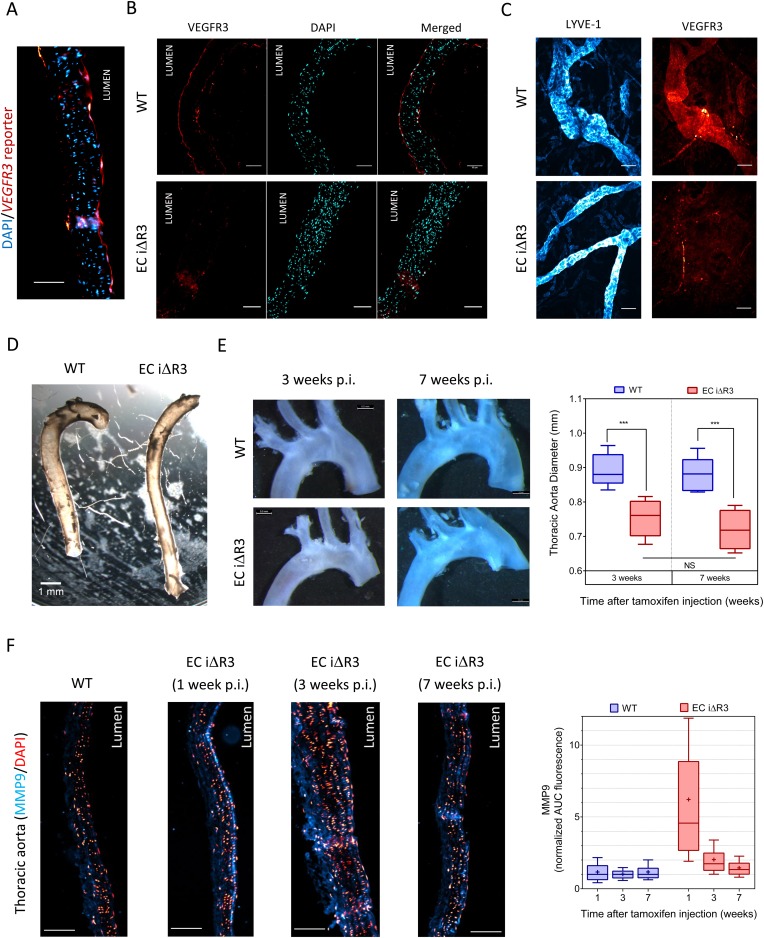
Vascular remodeling under conditions of growth or exercise, or during recovery from arterial restriction or blockage is essential for health, but mechanisms are poorly understood. It has been proposed that endothelial cells have a preferred level of fluid shear stress, or 'set point', that determines remodeling. We show that human umbilical vein endothelial cells respond optimally within a range of fluid shear stress that approximate physiological shear. Lymphatic endothelial cells, which experience much lower flow in vivo, show similar effects but at lower value of shear stress. VEGFR3 levels, a component of a junctional mechanosensory complex, mediate these differences. Experiments in mice and zebrafish demonstrate that changing levels of VEGFR3/Flt4 modulates aortic lumen diameter consistent with flow-dependent remodeling. These data provide direct evidence for a fluid shear stress set point, identify a mechanism for varying the set point, and demonstrate its relevance to vessel remodeling in vivo.

Keywords: arteriogenesis; cell biology; homeostasis; human; human biology; mechanotransduction; medicine; mouse; shear stress; vascular remodeling; zebrafish.


Conflict of interest statement

The authors declare that no competing interests exist.

Figures

Figure 1.
Figure 1.. Testing the set point hypothesis.
(A) Definition of the ‘shear stress set point’. (B) Picture of a silicone gasket used in the gradient flow chamber with the corresponding calculation of the theoretical shear stress level across the channel with two different conditions of gasket thickness and flow rate. DOI: http://dx.doi.org/10.7554/eLife.04645.003
Figure 2.
Figure 2.. Set point for shear stress.
(A) Cell orientation: the average orientation of HUVEC nuclei was measured in each picture, to obtain average orientation at a given shear stress. (n = 16, Mean ± SEM, ANOVA: F = 15.02, p < 0.0001). With no flow, cell orientation was random (average = 45°). (B) NF-κB activation: p65 nuclear translocation in HUVEC was measured either in no flow (dotted line: average) or after 16 hr of flow in the gradient chamber (n = 6, Mean ± SEM, ANOVA: F = 10.97, p < 0.0001). (C) Smad1 activation: Smad1 nuclear translocation in HUVECs was measured without flow (dotted line: average) or after 16 hr of flow in the gradient chamber (n = 6, Mean ± SEM, ANOVA: F = 13.47, p < 0.0001). DOI: http://dx.doi.org/10.7554/eLife.04645.004
Figure 2—figure supplement 1.
Figure 2—figure supplement 1.. (A) Quantification of cell orientation, p65 nuclear translocation or smad1 nuclear translocation without flow or after 16 hr laminar flow at the indicated values (NS: not significant, *: p < 0.05, **: p < 0.01, ****: p < 0.0001).
(B) Representative pictures of HUVECs with labeled nuclei (DAPI), actin stress fibers (phalloidin), p65 or Smad1 without flow or after 16 hr of flow. Flow direction is from left to right. Scale bar = 50 µm. DOI: http://dx.doi.org/10.7554/eLife.04645.005
Figure 3.
Figure 3.. Set point in HUVECs vs lymphatic endothelial cells.
(A) The average orientation of venous cell (HUVEC) or lymphatic cell (HDLEC) nuclei across the slide was measured as in Figure 2A. (n = 11, Mean ± SEM). The difference between HUVECs and HDLECs is statistically significant (ANOVA Two-way, p < 0.0001). (B) NF-κB activation: p65 nuclear translocation in HDLEC was measured either in no flow (dotted line: average) or after 16 hr of flow in the gradient chamber (n = 4, Mean ± SEM, ANOVA: F = 34.32, p < 0.0001). (C) Expression of VE-cadherin, PECAM-1, VEGFR2 and VEGFR3, proteins involved in the shear stress mechanotransduction through the junctional complex. Actin was used as a loading control. DOI: http://dx.doi.org/10.7554/eLife.04645.006
Figure 3—figure supplement 1.
Figure 3—figure supplement 1.. Representative pictures of HDLEC probed for DAPI and p65 at 5 and 20 dynes.cm−2.
DOI: http://dx.doi.org/10.7554/eLife.04645.007
Figure 4.
Figure 4.. VEGFR3 expression controls the shear stress set point.
(A) Western Blot of VEGFR3 and GFP in HDLECs with and without VEGFR3 siRNA (10 nM), and in HUVECs with and without adenoviral expression of hVEGFR3-GFP. Actin serves as a loading control. (B) Effect of VEGFR3 siRNA in HDLECs on set point. Cell alignment was assayed after shear stress for 16 hr (n = 6). Data were smoothed with a LOWESS fit to improve visualization (mean ± SEM; HDLEC vs HDLC + VEGFR3 siRNA: p = 0.004; HDLEC + VEGFR3 siRNA vs HUVEC: p = 0.45). (C) Effect of VEGFR3 over-expression on set point. Alignment after 16 hr flow was assayed in HUVECs infected with adenovirus expressing mCherry or hVEGFR3-GFP as before. Data were smoothed with a LOWESS fit to improve visualization (n = 10, values are means ± SEM; HUVEC + mCherry vs HUVEC + VEGFR3-GFP: p < 0.0001). DOI: http://dx.doi.org/10.7554/eLife.04645.008
Figure 4—figure supplement 1.
Figure 4—figure supplement 1.. (A) Representative pictures of HUVEC cells expressing hVEGFR3-GFP (GFP signal displayed) after 16 hr of stimulation at 5 and 20 dynes.cm−2.
Flow direction is from left to right. (B) FACS analysis of the GFP signal from HUVEC (grey) and HUVEC infected with VEGFR3-GFP (GFP+). DOI: http://dx.doi.org/10.7554/eLife.04645.009
Figure 4—figure supplement 2.
Figure 4—figure supplement 2.. Non-smoothened data of the graphs displayed in Figure 4B,C.
DOI: http://dx.doi.org/10.7554/eLife.04645.010
Figure 5.
Figure 5.. VEGFR3 activation by shear stress.
HDLECs (left) and HUVECs (right) were stimulated for 15 min with shear stress at the indicated levels. VEGFR3 transactivation was assayed by phosphorylation on Y1230, detected by Western blotting with pY1230 antibody (n = 5 independent experiments; *: p < 0.05, **: p < 0.01, ****: p < 0.0001). DOI: http://dx.doi.org/10.7554/eLife.04645.011
Figure 6.
Figure 6.. VEGFR3 (Flt4) controls blood vessel caliber in zebrafish.
Representative pictures of the dorsal aorta (DA), posterior cardinal vein (PCV) and thoracic duct (white *) at 72 hr post-fertilization (hpf) in wild type zebrafish embryos or embryos injected with Flt4 (VEGFR3) morpholino at 0.06 or 0.1 mM, or with VEGF-C morpholino at 0.06 or 0.1 mM. The mCherry reporter driven by the KDR (VEGFR2) promoter (kdrl:mCherry) is depicted in red and the citrine reporter driven by the Flt4 promoter (flt4:citrine) is depicted in green. Scale = 20 µm and applies to all pictures. n = 6-15 fishes for each condition, whiskers represents the minimum and maximum data point (NS: non-significant, ***: p < 0.001 and ****: p < 0.0001, ANOVA). DOI: http://dx.doi.org/10.7554/eLife.04645.012
Figure 6—figure supplement 1.
Figure 6—figure supplement 1.. Representative pictures of the dorsal aorta (DA) and posterior cardinal vein (PCV) and developing thoracic duct (*) in wild type zebrafish embryos with a citrine reporter associated to Flt4 promoter (flt4:citrine) before and approximatively 2 hr after nifedipine treatment.
DOI: http://dx.doi.org/10.7554/eLife.04645.013
Figure 7.
Figure 7.. Transient vascular remodeling in EC iΔR3 mice.
(A) Longitudinal paraffin section of the thoracic aorta of a Vegfr3::YFP (VEGFR3 reporter) mouse. YFP was detected with an anti-GFP antibody. Scale bar = 50 µm. (B) VEGFR3 and DAPI staining of a longitudinal section of the thoracic aorta of Vegfr3fl/fl (WT) or EC iΔR3 mice, 3 weeks after Tx injection. Scale bar: 50 µm. (C) Lyve1 and VEGFR3 staining of the lymphatic network in ear skin from Vegfr3fl/fl (WT) or EC iΔR3 mice. Pictures were taken 1 week after Tx injection. Scale bar = 50 µm. (D) Aorta from oil injected-EC iΔR3 (WT) or Tx-injected EC iΔR3 mice, 2 weeks after Tx injection. Scale bar = 1 mm. (E) Diameters (graph on right) were measured in thoracic aortas (images on left) from Vegfr3fl/fl (WT) or EC iΔR3 mice, 3 weeks (WT: n = 8 and EC iΔR3: n = 7) and 7 weeks (WT: n = 6 and EC iΔR3: n = 5) after Tx treament (whiskers indicate the minimum and maximum data point, ***: p < 0.001, ANOVA). The measurement was performed right after the curvature, 1 mm below the subclavian artery bifurcation. (F) Longitudinal paraffin sections of the thoracic aorta from Vegfr3fl/fl (WT) or EC iΔR3 mice or EC iΔR3 mice, probed for MMP9 (blue) and nuclei (red) after injection of Tx for the indicated time (WT is 1 week post-injection). Distribution of the area under the curve of MMP9 fluorescence from the media is plotted on the left (n ≥ 3 mice for each condition, whiskers are 10–90%, cross is the arithmetic mean). DOI: http://dx.doi.org/10.7554/eLife.04645.014
Figure 7—figure supplement 1.
Figure 7—figure supplement 1.. VEGFR3 and DAPI staining of a longitudinal section different portions of the aorta. Scale bar: 50 µm.
DOI: http://dx.doi.org/10.7554/eLife.04645.015

Similar articles

Cited by

References

    1. Aranguren XL, Agirre X, Beerens M, Coppiello G, Uriz M, Vandersmissen I, Benkheil M, Panadero J, Aguado N, Pascual-Montano A, Segura V, Prósper F, Luttun A. Unraveling a novel transcription factor code determining the human arterial-specific endothelial cell signature. Blood. 2013;122:3982–3992. doi: 10.1182/blood-2013-02-483255. - DOI - PubMed
    1. Baeyens N, Mulligan-Kehoe MJ, Corti F, Simon DD, Ross TD, Rhodes JM, Wang TZ, Mejean CO, Simons M, Humphrey J, Schwartz MA. Syndecan 4 is required for endothelial alignment in flow and atheroprotective signaling. Proceedings of the National Academy of Sciences of USA. 2014;111:17308–17313. doi: 10.1073/pnas.1413725111. - DOI - PMC - PubMed
    1. Berk BC. Atheroprotective signaling mechanisms activated by steady laminar flow in endothelial cells. Circulation. 2008;117:1082–1089. doi: 10.1161/CIRCULATIONAHA.107.720730. - DOI - PubMed
    1. Boito S, Struijk PC, Ursem NT, Stijnen T, Wladimiroff JW. Umbilical venous volume flow in the normally developing and growth-restricted human fetus. Ultrasound in Obstetrics & Gynecology. 2002;19:344–349. doi: 10.1046/j.1469-0705.2002.00671.x. - DOI - PubMed
    1. Bond M, Fabunmi RP, Baker AH, Newby AC. Synergistic upregulation of metalloproteinase-9 by growth factors and inflammatory cytokines: an absolute requirement for transcription factor NF-kappa B. FEBS Letters. 1998;435:29–34. doi: 10.1016/S0014-5793(98)01034-5. - DOI - PubMed

Publication types

Substances