Single muscle fiber proteomics reveals unexpected mitochondrial specialization
- PMID: 25643707
- PMCID: PMC4364878
- DOI: 10.15252/embr.201439757
Single muscle fiber proteomics reveals unexpected mitochondrial specialization
Abstract
Mammalian skeletal muscles are composed of multinucleated cells termed slow or fast fibers according to their contractile and metabolic properties. Here, we developed a high-sensitivity workflow to characterize the proteome of single fibers. Analysis of segments of the same fiber by traditional and unbiased proteomics methods yielded the same subtype assignment. We discovered novel subtype-specific features, most prominently mitochondrial specialization of fiber types in substrate utilization. The fiber type-resolved proteomes can be applied to a variety of physiological and pathological conditions and illustrate the utility of single cell type analysis for dissecting proteomic heterogeneity.
Keywords: exercise; metabolism; mitochondria; muscle fibers; single cell.
© 2015 The Authors. Published under the terms of the CC BY NC ND 4.0 license.
Figures

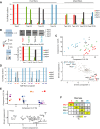
A Shotgun proteomics workflow for fibers and whole muscle fractions. For details see main text and Materials and Methods.
B Cumulative abundance of all proteins detected in muscle fibers, ranked on a log10 scale.
C Protein coverage in muscle fibers and whole muscle. Each bar represents a selected category of keyword annotations, for which the number of corresponding protein coding genes in the mouse genome is considered as 100%. Proteins identified in our fiber database correspond to dark and light blue bars combined and additional protein identified in our whole muscle database to light green.

A MS-based quantification of Myh isoforms reveals four basic pure-type fibers and different combinations of mixed-type fibers.
B Comparison of fiber type assignment using unbiased MS-based quantification and traditional method. Fiber lysates were split into two and processed in parallel on separate gels (see Supplementary Methods). MS and Myh silver staining of the corresponding half fibers.
C Top, principal component analysis performed on pure fibers (N + 48), using only proteins expressed in all fibers; bottom, loadings showing the main proteins driving segregation into components.
D Half fibers from EDL mechanically cut at isolation and processed separately may express a very similar pattern of Myh expression (fibers 7 and 11) or a different one (fibers 3 and 8). Colors match the PCA in (E).
E Principal component analysis showing association or segregation of half-fiber proteomes. Half fibers are marked by a square if similar and by a dot if different. Samples were filtered for 100% valid values. The main proteins driving segregation into components are indicated in the bottom part of the panel. The components scale is multiplied by 10 to magnify differences.
F Distribution of Myh expression in the fiber type-resolved proteome. Values represent the enrichment in Myh isoforms as percent, calculated on the median of each fiber type and color-coded according to the scale shown at the bottom.

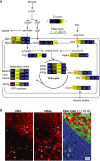
A Differential distribution of selected mitochondrial proteins or pathways according to muscle fiber type. The normalized expression (by actin) of each protein in different fiber types is reported; the color scale is based on Z-score as indicated. Boxes represent the values of each fiber type, always following the order type 1/2A/2X/2B from left to right, as indicated on top. Proteins are identified by the corresponding gene name (see also Supplementary Table S2 for reference). Brackets indicate less than 3 valid values in one group.
B Differential distribution of Idh3 and Idh2 in fiber types validated by immunohistochemistry in serial sections of soleus and EDL muscles. Fiber type distribution is shown in the right panel using a combination of antibodies specific to Myh isoforms; pseudocolors have been adjusted to match the fiber type color coding used throughout the paper. Representative type 1 (dot), 2A (arrowhead) and 2X (asterisk) are indicated.
References
Publication types
MeSH terms
Substances
LinkOut - more resources
Full Text Sources
Other Literature Sources

