. 2015 Oct;26(10):2414-22.
doi: 10.1681/ASN.2014090886. Epub 2015 Feb 2.

Developmental Programming of Branching Morphogenesis in the Kidney

Affiliations

Developmental Programming of Branching Morphogenesis in the Kidney

Rosemary V Sampogna et al. J Am Soc Nephrol. 2015 Oct.

Abstract

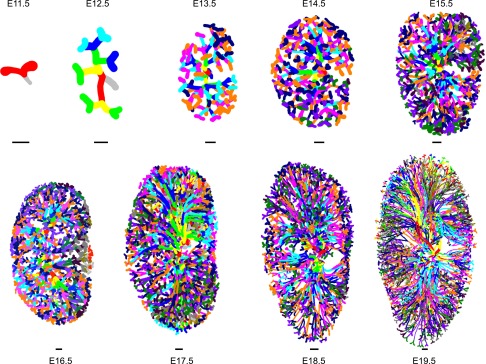
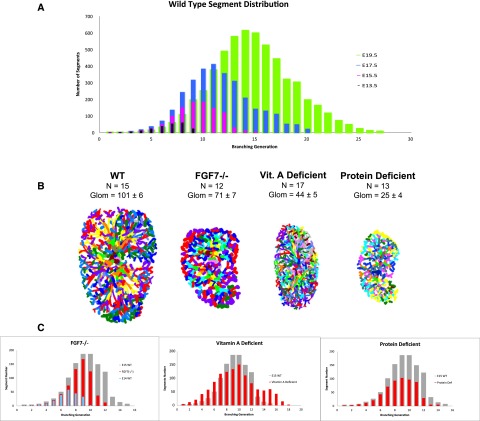
The kidney developmental program encodes the intricate branching and organization of approximately 1 million functional units (nephrons). Branching regulation is poorly understood, as is the source of a 10-fold variation in nephron number. Notably, low nephron count increases the risk for developing hypertension and renal failure. To better understand the source of this variation, we analyzed the complete gestational trajectory of mouse kidney development. We constructed a computerized architectural map of the branching process throughout fetal life and found that organogenesis is composed of two distinct developmental phases, each with stage-specific rate and morphologic parameters. The early phase is characterized by a rapid acceleration in branching rate and by branching divisions that repeat with relatively reproducible morphology. The latter phase, however, is notable for a significantly decreased yet constant branching rate and the presence of nonstereotyped branching events that generate progressive variability in tree morphology until birth. Our map identifies and quantitates the contribution of four developmental mechanisms that guide organogenesis: growth, patterning, branching rate, and nephron induction. When applied to organs that developed under conditions of malnutrition or in the setting of growth factor mutation, our normative map provided an essential link between kidney architecture and the fundamental morphogenetic mechanisms that guide development. This morphogenetic map is expected to find widespread applications and help identify modifiable targets to prevent developmental programming of common diseases.

Keywords: branching morphogenesis; kidney development; nephron number; variability.


Figures

Figure 1.
Figure 1.
Reconstruction of the ureteric tree throughout intrauterine development. One representative three-dimensional tracing is shown for each gestational day. Each successive branching generation is represented by a different color. Note that the color scheme is repeated after 14 branching orders starting at E15.5. Scale bar, 100 μm.
Figure 2.
Figure 2.
Growth and branching rates throughout gestation. (A) Growth curves for total tip and glomerulus count at each day (semi-log2 plot). The rate of glomerulus formation lags behind tip formation. Vertical bars represent variance. (B) Observed tip branching probability per day calculated from the time course of the mean in A. Early and late branching phases are indicated.
Figure 3.
Figure 3.
Stereotyped and variable branching patterns. (A) Three-dimensional tracing representing the topology and lineage of binary (blue) and variable (red) branching patterns at E12.5. (B) Dendrograms are tree diagrams that are generated from the manual tracing of each specimen that outline branch lengths and lineage. Horizontal lines represent measured branch lengths, and intersections represent branch nodes. Vertical line lengths are arbitrary. Numbers represent centrifugal order assignment of nodes where the root is shown by order 0. Early branching events follow a stereotyped pattern such that, on average, two daughters are produced per division. These (shown in blue) comprise a full binary tree (also see Supplemental Figure 3). (C) The tracing at E13.5 localizes blue segments to the interior and red to the periphery and tips. (D) Representative dendrogram at E13.5. Segments shown in red represent branch processes outside the full binary tree that are composed of asymmetric and variable patterns. (E) The graph shows maximum branch orders occupied by the stereotyped and variable patterns during gestation. At each day, the height (maximum order) of the full binary tree generated by stereotyped branching events increases linearly (blue). However, the curve for subtrees that divide beyond the full binary tree significantly increases at the beginning of the late branching phase (red). This slope reflects progressive contribution of variable pattering until birth. (F) Average total node number per order in four kidneys taken from littermates at E13.5. Ureteric tree branching for orders 1 to about 5 primarily form by bifurcation of each tip and show an exponential growth phase. Thereafter, variance (vertical bars) increases as branches from orders 6–10 occupy increasingly different configurations. (G) The curve for branch segment lengths summed over each order shows analogous shape and behavior. Similar curves were found on all gestational days (data not shown).
Figure 4.
Figure 4.
Symmetry, asymmetry, and stochasticity in kidney development. (A) Dendrogram for E13.5 wild-type kidney showing lineage of each tree. Colored ellipses outline four lobes in the upper and three lobes in the lower half of the kidney. These are defined by clusters of associated nodes and branch segments, are conserved in all kidneys studied, and correlate with kidney anatomy. (B) The dendrogram adjusted radially to show two-dimensional lobe arrangement. (C) The average number of tips present within each lobe is indicated. n=4 kidneys, each extracted from each of four (identically aged) littermates at E13.5.
Figure 5.
Figure 5.
Growth curves and architecture of wild-type and mutant kidneys. (A) Wild-type segment distribution at embryonic days E13.5, E15.5, E17.5, and E19.5. The total number of branch segments per order is plotted. The left edge of each curve increases exponentially between orders 1 and 6 for E13.5, 1 and 7 for E15.5, 1 and 8 for E17.5, and 1 and 9 for E19.5. The right tail represents the average maximal number of branching generations at each age. The AUC represents the total number of segments per kidney. Characteristic curve shape is maintained at each day of gestation. (B) E15.5 ureteric tree tracings for each condition (to scale). N is the maximum generation number and glom represents the mean glomerular count (minimum of three kidneys studied per condition). In each case, glomerular count is reduced compared with the wild type. The number of branching generations is specific to each condition. (C) Growth curves for each deficient condition are in red at E15.5. The E15.5 wild type is shown in gray. In the case of the FGF7 mutant, the E14.5 wild type is shown in blue. WT, wild type; Vit, vitamin.

Similar articles

Cited by

References

    1. Luyckx VA, Bertram JF, Brenner BM, Fall C, Hoy WE, Ozanne SE, Vikse BE: Effect of fetal and child health on kidney development and long-term risk of hypertension and kidney disease. Lancet 382: 273–283, 2013 - PubMed
    1. Bagby SP: Developmental origins of renal disease: Should nephron protection begin at birth? Clin J Am Soc Nephrol 4: 10–13, 2009 - PubMed
    1. Brenner BM, Garcia DL, Anderson S: Glomeruli and blood pressure. Less of one, more the other? Am J Hypertens 1: 335–347, 1988 - PubMed
    1. Barker DJ, Bull AR, Osmond C, Simmonds SJ: Fetal and placental size and risk of hypertension in adult life. BMJ 301: 259–262, 1990 - PMC - PubMed
    1. Puelles VG, Hoy WE, Hughson MD, Diouf B, Douglas-Denton RN, Bertram JF: Glomerular number and size variability and risk for kidney disease. Curr Opin Nephrol Hypertens 20: 7–15, 2011 - PubMed

Publication types

LinkOut - more resources