. 2015 Oct;26(10):2399-413.
doi: 10.1681/ASN.2014070673. Epub 2015 Feb 2.

Neutrophil Extracellular Trap-Related Extracellular Histones Cause Vascular Necrosis in Severe GN

Affiliations

Neutrophil Extracellular Trap-Related Extracellular Histones Cause Vascular Necrosis in Severe GN

Santhosh V R Kumar et al. J Am Soc Nephrol. 2015 Oct.

Abstract

Severe GN involves local neutrophil extracellular trap (NET) formation. We hypothesized a local cytotoxic effect of NET-related histone release in necrotizing GN. In vitro, histones from calf thymus or histones released by neutrophils undergoing NETosis killed glomerular endothelial cells, podocytes, and parietal epithelial cells in a dose-dependent manner. Histone-neutralizing agents such as antihistone IgG, activated protein C, or heparin prevented this effect. Histone toxicity on glomeruli ex vivo was Toll-like receptor 2/4 dependent, and lack of TLR2/4 attenuated histone-induced renal thrombotic microangiopathy and glomerular necrosis in mice. Anti-glomerular basement membrane GN involved NET formation and vascular necrosis, whereas blocking NET formation by peptidylarginine inhibition or preemptive anti-histone IgG injection significantly reduced all aspects of GN (i.e., vascular necrosis, podocyte loss, albuminuria, cytokine induction, recruitment or activation of glomerular leukocytes, and glomerular crescent formation). To evaluate histones as a therapeutic target, mice with established GN were treated with three different histone-neutralizing agents. Anti-histone IgG, recombinant activated protein C, and heparin were equally effective in abrogating severe GN, whereas combination therapy had no additive effects. Together, these results indicate that NET-related histone release during GN elicits cytotoxic and immunostimulatory effects. Furthermore, neutralizing extracellular histones is still therapeutic when initiated in established GN.

Keywords: ARF; glomerular endothelial cells; immunology; pathology.


Figures

Figure 1.
Figure 1.
TLR2 and TLR4 expression in human crescentic glomerulonephritis. (A–C) TLR2 and TLR4 immunostaining is performed on healthy kidney tissue (A) or on kidney biopsies of patients with newly diagnosed ANCA vasculitis and clinical signs of GN (B and C). B shows representative glomeruli unaffected by loop necrosis or crescent formation, while glomeruli affected by such lesions are shown in C. Original magnification, ×400.
Figure 2.
Figure 2.
NETosis-related extracellular histones kill glomerular cells. (A) Murine glomerular endothelial cells, podocytes, and PECs are incubated with increasing doses of histones together with either control IgG or antihistone IgG. Cell viability is determined after 24 hours by MTT assay. (B) Immunostaining of naïve (left) and TNF-α–activated neutrophils (right) in culture. Staining for elastase (red) and histones (green) illustrates how TNF-α triggers NETosis leading to NET formation (i.e., expelling cytoplasmic and nuclear contents in the extracellular space). (C–E) Similar experiments are performed on monolayers of glomerular endothelial cells, which appear flat and evenly laid out on scanning electron microscopy (C, left). However, neutrophil NETosis leads to severe injury and death of endothelial cells appearing as bulging white balls with corrugated surfaces adjacent to activated NETs (C, middle). This effect is almost entirely prevented by antihistone IgG demonstrated by significant reversal of the structural integrity of the endothelial cell monolayer (C, right). (D) Immunostaining for elastase, histone, and DAPI illustrate the same effect. (E) MTT assay analysis of endothelial cell viability allows quantifying this effect, which is identical for TNF-α and PMA, two known inducers of NETosis. Data in A and E represent the mean OD±SEM of three experiments measured at a wavelength of 570 nm. *P<0.05; **P<0.01; ***P<0.001 versus control IgG. GEnC, glomerular endothelial cell; Cont, control; DAPI, 4′,6-diamidin-2-phenylindol; Hist, histone.
Figure 3.
Figure 3.
Extracellular histones injure glomeruli in a TLR2/TLR4-dependent manner. (A) Glomeruli are isolated from wild-type and Tlr2/Tlr4-deficient mice and incubated with histones (30 µg/ml). After 12 hours, LDH release into the supernatant is measured as a marker of glomerular cell injury. Data represent the mean OD±SEM of three experiments measured at a wavelength of 492 nm. **P<0.01; ***P<0.001 versus control. (B) For intra-arterial histone injection, the abdominal aorta is prepared and a microcannula is placed into the left renal artery to inject histones directly into the kidney. Images show hematoxylin and eosin staining of representative glomeruli of the different groups as indicated. (C–E) Fibrinogen immunostaining displays three different staining patterns: diffuse positivity of glomerular endothelial cells, entire luminal positivity indicating microthrombus formation, and global positivity of glomerular loop indicating loop necrosis. (F) A quantitative analysis of these lesions reveals that histone injection massively increases luminal and global fibrinogen positivity, which is partially prevented in Tlr2/Tlr4-deficient mice. **P<0.01; ***P<0.001 versus saline; #P<0.05; ##P<0.01 versus histone group. DKO, double knockout; LDH, lactate dehydrogenase. Original magnification, ×400 in B–E.
Figure 4.
Figure 4.
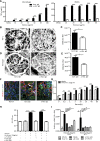
Neutralizing histones protects from severe GN. (A) CD31 and MPO immunostaining representing NETs formation in the glomeruli of vehicle group. PAD inhibition shows no NETs in terms of MPO positivity. (B) Quantification of mean fluorescence area for MPO and CD31 positivity in glomeruli. (C) The model of antiserum-induced GN using PAD inhibitor 24 hours after antiserum injection shows reduced proteinuria and BUN at day 7. (D) Glomerular lesions. (E) Crescents. (F) BUN levels are determined 1 and 7 days after intravenous injection of GBM antiserum. Mice are either treated with control IgG or antihistone IgG starting from the day before antiserum injection. (G) Representative hematoxylin and eosin stainings of glomeruli are shown. (H and I): Morphometric analysis of segmental and global glomerular lesions (left) and of glomeruli with crescents (right) as described in the Concise Methods. (J) CD31 and MPO immunostaining representing NETs formation in the glomeruli of control IgG group shows focal loss of endothelial cell positivity compared with the antihistone IgG group. (K) Quantification of mean fluorescence area for MPO and CD31 positivity in glomeruli. Data are means±SEM from five to six mice in each group. *P<0.05; **P<0.01; ***P<0.001 versus control IgG. Cont, control; Hist, histone; inh, inhibition; MPO, myeloperoxidase; PAD, peptidylarginine demininase; ve, vehicle. Original magnification, ×400.
Figure 5.
Figure 5.
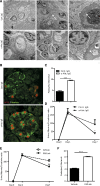
Neutralizing histones protects the glomerular filtration barrier in GN. (A) Transmission electron microscopy of antiserum-induced GN reveals extensive glomerular injury with fibrinoid necrosis (upper left), endothelial cell swelling, luminal thrombosis, and intraluminal granulocytes (upper middle and right). Podocytes show foot process effacement (all upper images). Preemptive treatment with antihistone IgG decreases most of these abnormalities, particularly endothelial cell and podocyte ultrastructure (lower images). (B and C) Immunostaining for WT-1 (red) and nephrin (green) is used to quantify podocytes. Antihistone IgG doubles the number of nephrin/WT-1+podocytes at day 7 of antiserum-induced GN. (D) The urinary albumin/creatinine ratio is determined at day 1 and day 7 after antiserum injection. (E and F) Urinary albumin/creatinine ratio and number of podocytes after blocking NETs with PAD inhibitor. Data represent the mean±SEM from five to six mice of each group. *P<0.05; ***P<0.001 versus control IgG. Cont, control; Hist, histone; PAD, peptidylarginine demininase.
Figure 6.
Figure 6.
Leukocyte recruitment and activation in GN. (A) Glomerular neutrophil (Ly-6B.2) and macrophage (Mac-2) infiltrates are quantified by immunostaining. Representative images are shown. (B) Leukocyte activation is quantified by flow cytometry of renal cell suspensions harvested 7 days after antiserum injection. Data represent the mean±SEM from five to six mice of each group. (C) Cultured bone marrow–derived dendritic cells are exposed to increasing doses of histones as indicated. After 24 hours, flow cytometry is used to determine the percentage of cells that express the activation markers MHC II, CD40, CD80, and CD86. Data are means±SEM from three independent experiments. *P<0.05; **P<0.01; ***P<0.001 versus control IgG. Cont, control; Hist, histone. Original magnification, ×400.
Figure 7.
Figure 7.
Histones activate TNF-α production. (A) Cultured J774 macrophages and BMDCs respond to histone exposure by inducing the secretion of TNF-α, which is blocked by antihistone IgG. Data are means±SEM from three independent experiments. ***P<0.001 versus control IgG. (B and D) TNF-α and fibrinogen immunostaining on renal sections from both treatment groups taken at day 7 after antiserum injection. Representative images are shown. (C and E) Real-time RT-PCR for TNF-α and fibrinogen mRNA on renal tissue at day 7 after antiserum injection. Data are means±SEM from at least five to six mice in each group. *P<0.05 versus control IgG. (F) Immunostaining of renal sections of all groups for claudin-1 (red, marker for PECs and some tubular cells), WT-1 (green, marker for podocytes and activated PECs), and DAPI (blue, DNA marker) illustrates that in severe GN, crescents consist of WT-1+PECs, which is reversed with antihistone IgG. (G) Mouse PEC viability (MTT assay) when cultured in the presence of different serum concentrations together with a low concentration (20 μg/ml) of histones, that without serum histones reduces PEC viability. Together with serum histones rather promote PEC growth. (H): Similar experiment showing that blocking anti-TLR2 and anti-TLR4 antibodies and antihistone IgG neutralize the histone effect on PEC growth. Data are the mean OD±SEM of three experiments measured at a wavelength of 570 nm. **P<0.01; ***P<0.001 versus control IgG. (I) RT-PCR analysis of PECs stimulated with histones and various neutralizing compounds (antihistone IgG, heparin 50 μg/ml, activated protein C 500 nM, anti-TLR2 or anti-TLR4 1 ng/ml). Note that all of these interventions block histone-induced CD44 and WT-1 mRNA expression, which serve as markers of PEC activation. Data are means±SEM of three experiments. #P<0.05; **P<0.01; ***P<0.001 versus histone group. Cont, control; Hist, histone; DAPI, 4′,6-diamidin-2-phenylindol. Original magnification, ×400 in B and D; 200 in F.
Figure 8.
Figure 8.
Delayed histone blockade still improves GN. (A) Glomeruli are isolated from wild-type mice and incubated with histones in the presence or absence of antihistone IgG, heparin, or aPC as before. LDH release is measured in supernatants as a marker of glomerular cell injury. Data are the mean OD±SEM of three experiments. *P<0.05; **P<0.01; ***P<0.001 versus control IgG or vehicle group histone group, respectively. (B) Further experiments again use the model of antiserum-induced GN using antihistone IgG, heparin, or recombinant aPC initiated only after disease onset (i.e., 24 hours after antiserum injection, when the urinary albumin/creatinine ratio was around 80 μg/mg). (C) Data show plasma creatinine levels at day 7 and albuminuria also at day 2. (D) Podocytes are quantified as nephrin/WT-1+cells on renal sections at day 7. (E–G) Glomerular lesions (E), crescents (F), and tubular injury (G) are quantified by morphometry from sections stained with periodic acid–Schiff taken at day 7. Glomerular podocyte numbers are assessed by WT-1/nephrin costaining on glomerular cross-sections. Data represent the mean±SEM from five to six mice of each group. *P<0.05; **P<0.01; ***P<0.001 versus control IgG or vehicle, respectively. Cont, control; Hist, histone; LDH, lactate dehydrogenase.

References

    1. Couser WG: Basic and translational concepts of immune-mediated glomerular diseases. J Am Soc Nephrol 23: 381–399, 2012 - PubMed
    1. Berden AE, Ferrario F, Hagen EC, Jayne DR, Jennette JC, Joh K, Neumann I, Noël LH, Pusey CD, Waldherr R, Bruijn JA, Bajema IM: Histopathologic classification of ANCA-associated glomerulonephritis. J Am Soc Nephrol 21: 1628–1636, 2010 - PubMed
    1. Jennette JC, Xiao H, Falk RJ: Pathogenesis of vascular inflammation by anti-neutrophil cytoplasmic antibodies. J Am Soc Nephrol 17: 1235–1242, 2006 - PubMed
    1. Bonsib SM: Glomerular basement membrane discontinuities. Scanning electron microscopic study of acellular glomeruli. Am J Pathol 119: 357–360, 1985 - PMC - PubMed
    1. Ryu M, Migliorini A, Miosge N, Gross O, Shankland S, Brinkkoetter PT, Hagmann H, Romagnani P, Liapis H, Anders HJ: Plasma leakage through glomerular basement membrane ruptures triggers the proliferation of parietal epithelial cells and crescent formation in non-inflammatory glomerular injury. J Pathol 228: 482–494, 2012 - PubMed

Publication types