. 2015 Feb 3;14(1):30.
doi: 10.1186/s12943-014-0286-9.

ID helix-loop-helix proteins as determinants of cell survival in B-cell chronic lymphocytic leukemia cells in vitro

Affiliations

ID helix-loop-helix proteins as determinants of cell survival in B-cell chronic lymphocytic leukemia cells in vitro

Sarah Weiler et al. Mol Cancer. .

Abstract

Background: Members of the inhibitor of DNA-binding (ID) family of helix-loop-helix proteins have been causally implicated in the pathogenesis of several types of B-cell lineage malignancy, either on the basis of mutation or by altered expression. B-cell chronic lymphocytic leukemia encompasses a heterogeneous group of disorders and is the commonest leukaemia type in the Western world. In this study, we have investigated the pathobiological functions of the ID2 and ID3 proteins in this disease with an emphasis on their role in regulating leukemic cell death/survival.

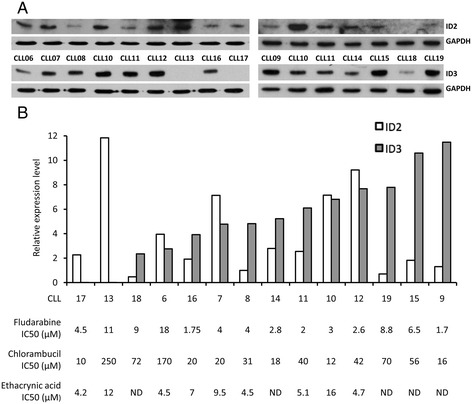
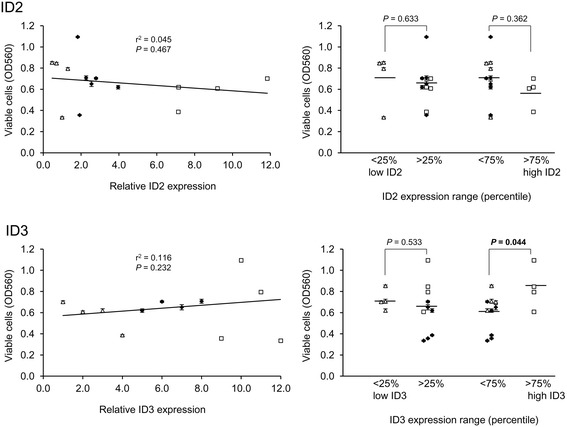
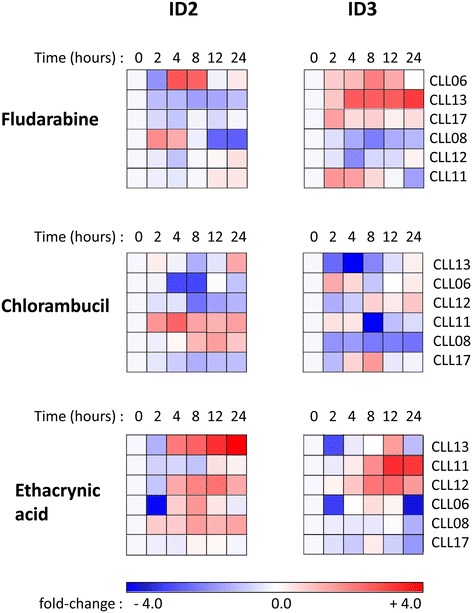
Methods: Bioinformatics analysis of microarray gene expression data was used to investigate expression of ID2/ID3 in leukemic versus normal B cells, their association with clinical course of disease and molecular sub-type and to reconstruct a gene regulatory network using the 'maximum information coefficient' (MIC) for target gene inference. In vitro cultured primary leukemia cells, either in isolation or co-cultured with accessory vascular endothelial cells, were used to investigate ID2/ID3 protein expression by western blotting and to assess the cytotoxic response of different drugs (fludarabine, chlorambucil, ethacrynic acid) by 3-(4,5-dimethylthiazol-2-yl)-2,5-diphenyltetrazolium bromide assay. ID2/ID3 protein levels in primary leukemia cells and in MEC1 cells were manipulated by transduction with siRNA reagents.

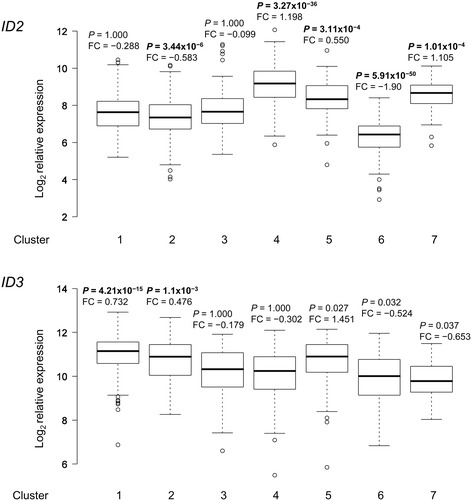
Results: Datamining showed that the expression profiles of ID2 and ID3 are associated with distinct pathobiological features of disease and implicated both genes in regulating cell death/survival by targeting multiple non-overlapping sets of apoptosis effecter genes. Consistent with microarray data, the overall pattern of ID2/ID3 protein expression in relation to cell death/survival responses of primary leukemia cells was suggestive of a pro-survival function for both ID proteins. This was confirmed by siRNA knock-down experiments in MEC1 cells and in primary leukemia cells, but with variability in the dependence of leukemic cells from different patients on ID protein expression for cell survival. Vascular endothelial cells rescued leukemia cells from spontaneous and cytotoxic drug-induced cell death at least in part, via an ID protein-coupled redox-dependent mechanism.

Conclusions: Our study provides evidence for a pro-survival function of the ID2/ID3 proteins in chronic lymphocytic leukemia cells and also highlights these proteins as potential determinants of the pathobiology of this disorder.


Figures

Figure 1
Figure 1
Meta-analysis of microarray data comparing ID2 / ID3 gene expression in CLL with normal B cells. For each dataset (identified by NCBI Gene Expression Omnibus GSE number), boxplot profiles are shown comparing normal B cells (open boxes) with CLL cells (shaded boxes). P values for the significance of difference in mean expression of the pair-wise comparisons were corrected for false discovery rate [51]. P values <0.05 are highlighted in bold-face. Log2 fold-change values (FC) are also given for each pair-wise comparison.
Figure 2
Figure 2
Kaplan-Meier plots showing the relation between ID2 expression and clinical outcome in CLL. A: analysis of time to first treatment for GSE39671 dataset; B: analysis of time to first treatment for GSE22762 dataset; C: analysis of survival time for GSE22762 dataset. For each dataset, patients were grouped according to high (red line) and low (blue line) ID2 expression. The significance of the difference in clinical end-point between high and low ID2 expression patient groups was determined by log rank test.
Figure 3
Figure 3
Boxplot profile of ID2 and ID3 expression in the seven molecular sub-types of CLL identified by consensus clustering. For each molecular sub-type (clusters 1–7), the distribution of relative ID2/ID3 expression values is shown together with the log2 fold-change (FC) and significance level of the difference between the mean expression for the sub-type compared to all other sub-types. Significant differences that indicate over- or under-expression of Id genes in individual sub-types are highlighted in bold-face. P values were corrected for false discovery rate [51].
Figure 4
Figure 4
Network graph showing interactions between ID2 and ID3 and their MIC-inferred ‘target’ genes regulating cell death. MIC-inferred apoptosis target genes, denoted by green nodes connected to ID2/ID3 by blue edges, were compiled from apoptosis pathway target genes in Additional file 6: Table S4. Green edges define protein-protein interactions, curated from the String database [28]. Pink edges denote literature-validated regulatory interactions mined from the UniHI database [29] that have been expanded to include first-neighbour interactions with additional targets as either pink nodes (not MIC-inferred target genes) or as grey (ID3) or white (ID2) MIC-inferred target genes listed in Additional file 5: Table S3. A Cytoscape network graph circle layout is shown.
Figure 5
Figure 5
Analysis of ID protein expression levels in primary CLL. (A) Western blotting analysis of ID2 and ID3 expression was performed in two separate experiments depicted in the two panels shown. CLL10 and CLL11 samples were included in both experiments to monitor internal consistency. Immunoblots were re-probed with anti-GAPDH antibody as a control for protein loading. The original western blot images that were used to compile Figure 5A are shown in Additional file 8: Figure S3. (B) Protein bands were quantified by densitometric scanning and normalized to the GAPDH loading control and, for each ID protein, expressed as fold-change (relative expression level) relative to the CLL sample with the lowest expression level on the left blot (CLL08 for ID2 and CLL17 for ID3). Densitometric quantification of the western blotting data is shown in Additional file 9: Figure S4. CLL samples are shown rank-ordered by increasing levels of ID3 expression. In vitro IC50 values were determined following 72 hrs of treatment for each CLL sample; ND: not determined.
Figure 6
Figure 6
Relation between in vitro fludarabine resistance and ID protein expression levels in 14 CLL samples. Data for relative ID expression levels and IC50 values are given in Figure 5B in the main manuscript. The left-hand plots show linear regression analysis where samples are coded according to ID protein expression range (open triangles: lowest 25th percentile; open squares: highest 75th percentile; solid diamonds: remaining samples). The right-hand plots show a comparison of ID protein expression levels between samples grouped according to percentile range of ID protein expression. Significant (<0.05) P values, calculated by Student’s t-test, are indicated in bold-face.
Figure 7
Figure 7
Relation between in vitro chlorambucil resistance and ID protein expression levels in 14 CLL samples. Data for relative ID expression levels and IC50 values are given in Figure 5B in the main manuscript. The left-hand plots show linear regression analysis where samples are coded according to ID protein expression range (open triangles: lowest 25th percentile; open squares: highest 75th percentile; solid diamonds: remaining samples). The right-hand plots show a comparison of ID protein expression levels between samples grouped according to percentile range of ID protein expression. Significant (<0.05) P values, calculated by Student’s t-test, are indicated in bold-face.
Figure 8
Figure 8
Relation between resistance to in vitro spontaneous cell death and ID protein expression levels in 14 CLL samples. Relative numbers of viable cells were determined from MTT assay data after 72 hrs culture; data points show the mean ± SEM. Data for relative ID expression levels are given in Figure 5B in the main manuscript. The left-hand plots show linear regression analysis where samples are coded according to ID protein expression range (open triangles: lowest 25th percentile; open squares: highest 75th percentile; solid diamonds: remaining samples). The right-hand plots show a comparison of ID protein expression levels between samples grouped according to percentile range of ID protein expression. Significant (<0.05) P values, calculated by Student’s t-test, are indicated in bold-face.
Figure 9
Figure 9
ID2 and ID3 protein expression patterns in response to in vitro drug treatment. CLL cells from six patients were cultured in the presence of varying concentrations of fludarabine, chlorambucil and ethacrynic acid for 24 hrs. The concentration of drugs were chosen for each CLL, based on IC50 values (see Figure 5B) such that a significant fraction of viable cells remained after the 24 hrs drug treatment period. At the indicated time points, ID2, ID3 and GAPDH (control) levels were analysed by western blotting. The bands were quantified by densitometric scanning and normalized to the intensity of the loading control (GAPDH). The fold-change in expression, relative to the untreated control was determined and, after log2-transformation was displayed as a heat map as shown. For each drug, CLL samples are shown rank-ordered by decreasing IC50 value (decreasing drug resistance).
Figure 10
Figure 10
ID2 and ID3 gene knockdown reduces survival of MEC1 cell line and primary CLL cells. (A) Western analysis of MEC1 cells infected with lentiviruses encoding either a control siRNA sequence or encoding one of four siRNAs targeting different sequences in the ID2/ID3 mRNAs. The original western blot images are shown in Additional file 10: Figure S5. (B) MEC1 cells that were transduced with control siRNA (open bars), ID2R-siRNA (light-shaded bars) or ID3Y-siRNA (dark-shaded bars) were incubated in the absence or presence of increasing concentrations chlorambucil or ethacrynic acid for 48 hrs and cell viability was assessed by MTT assay. The mean ± SEM of three independent samples is shown. (C) CLL cells from four patients were transfected with 60 nM negative control siRNA or with ID2/ID3 siRNA. 72 hrs post-transfection, cells were harvested and analysed by western blotting. The original western blot images are shown in Additional file 10: Figure S5. (D) 1×10⁶ cells from the four CLL patients were transfected with 60 nM negative control siRNA (open bars) or with the same concentration of ID2 siRNA (light-shaded bars) or ID3 siRNA (dark-shaded bars). 48 hrs post-transfection, the cells were incubated in the absence or presence of fludarabine (5 μM) for a further 24 hrs. Cell viability was assessed by MTT assay and values were normalised to the untreated control siRNA sample. Data from the mean ± SEM from three independent samples is shown.
Figure 11
Figure 11
Human umbilical vein endothelial cells (HUVEC) protect CLL cells from spontaneous and drug-induced cell death. (A) CLL cells from two patients were cultured alone or on a monolayer of HUVEC for three or seven days. Cell viability was assessed by MTT assay and values were normalized to the uncultured control. Data are from the mean ± SEM of two CLL samples (CLL11 and CLL12) each analysed in triplicate. (B) CLL cells from three patients (CLL07, top panel, CLL11, middle panel and CLL12, lower panel) were pre-cultured alone (broken line) or on a HUVEC monolayer (solid line) for 24 hrs. The cells were then cultured under the same conditions in the absence or presence of two different concentrations of fludarabine, chlorambucil or ethacrynic acid for a further 48 hrs. Cell viability was assessed by MTT assay and values were normalized to the respective untreated control for each culture condition. Data are from the mean ± SEM of three independent experiments. The statistical significance of differences in cell viability between control CLL and HUVEC-co- culture CLL is indicated by the P values for each drug concentration. (C) Conditioned medium (CM) was harvested from a 48 hrs co-culture of CLL cells with HUVECs. CLL cells were pre-cultured in either normal medium or in the CM medium or else on a monolayer of HUVEC for 18 hrs. The cells were then cultured under the same conditions in the presence or absence of fludarabine (15 μM) for a further 48 hrs. Cell viability was assessed by MTT assay and values were normalized to the untreated control. Data show the mean ± SEM from three independent samples.
Figure 12
Figure 12
The effect of HUVEC co-culture and augmentation of CLL glutathione levels on fludarabine-induced cell death and ID2/ID3 protein expression. CLL12 (A) and CLL18 (B) cells were pre-cultured alone or on a monolayer of HUVEC for 24 hrs. The cells were then cultured under the same conditions for a further 48 hrs in the absence or presence of fludarabine (20 μM). PEITC (5 μM for A, 20 μM for B) was added during the last 5 hrs of culture. Cell viability was assessed by MTT assay and values were normalized to the uncultured control (T0). The data show the mean ± SEM of three independent samples. Protein levels of ID2, ID3 and GAPDH were analyzed by western blotting. The original western blot images are shown in Additional file 11: Figure S6. CLL cells from patient CLL12 (C) and CLL18 (D) were pre-cultured in the absence or presence of GSH (2 mM for C, 4 mM for D) or L-cysteine (50 μM for C, 100 μM for D) for 24 hrs. The cells were then cultured for a further 48 hrs in the absence or presence of fludarabine (20 μM). L-cysteine was added to the culture medium daily. Cell viability was assessed by MTT assay and values were normalized to the uncultured control (T0). The data show the mean ± SEM of three independent samples. Protein levels of ID2, ID3 and GAPDH were analyzed by western blotting. The original western blot images are shown in Additional file 11: Figure S6. Quantification of western data by densitometric scanning is shown in Additional file 12: Figure S7.

References

    1. Norton JD. ID helix-loop-helix proteins in cell growth, differentiation and tumourigenesis. J Cell Sci. 2000;113:3897–3905. - PubMed
    1. Ruzinova MB, Benezra R. Id proteins in development, cell cycle and cancer. Trends Cell Biol. 2003;13:410–418. doi: 10.1016/S0962-8924(03)00147-8. - DOI - PubMed
    1. Perk J, Iavarone A, Benezra B. ID family of helix-loop-helix proteins in cancer. Nat Rev Cancer. 2005;5:603–614. doi: 10.1038/nrc1673. - DOI - PubMed
    1. Kee BL. E and ID proteins branch out. Nat Rev Immunol. 2009;9:175–184. doi: 10.1038/nri2507. - DOI - PubMed
    1. Hong S-H, Lee J-H, Lee JB, Ji J, Bhatia M. ID1 and ID3 represent conserved negative regulators of human embryonic and induced pluripotent stem cell hematopoiesis. J Cell Sci. 2011;124:1445–1452. doi: 10.1242/jcs.077511. - DOI - PubMed

Publication types

MeSH terms

Substances

LinkOut - more resources