

MECP2e1 isoform mutation affects the form and function of neurons derived from Rett syndrome patient iPS cells
- PMID: 25644311
- PMCID: PMC4380613
- DOI: 10.1016/j.nbd.2015.01.001
MECP2e1 isoform mutation affects the form and function of neurons derived from Rett syndrome patient iPS cells
Abstract
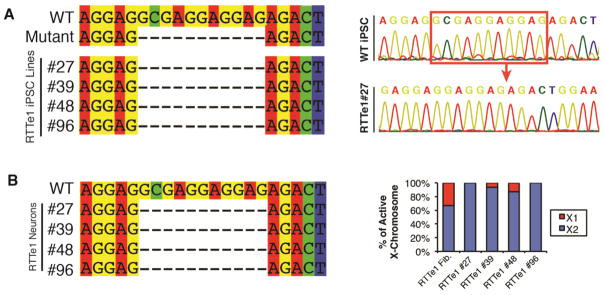
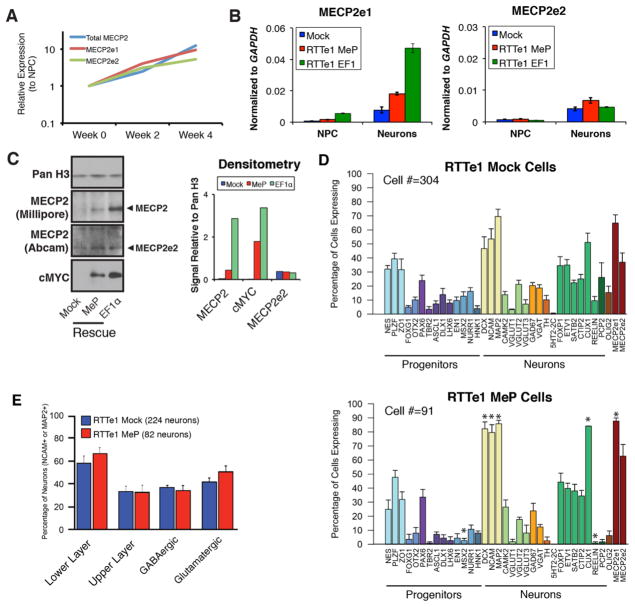
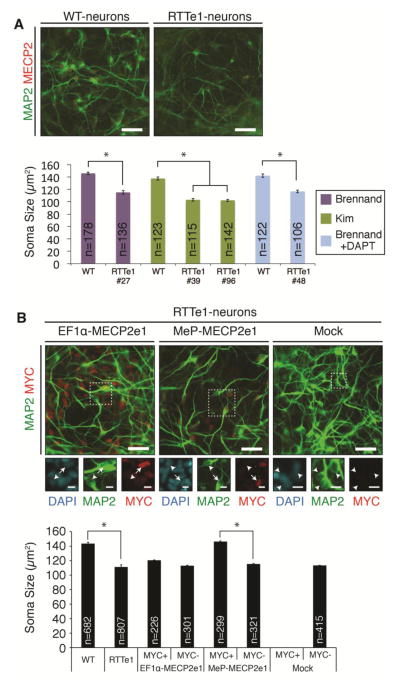
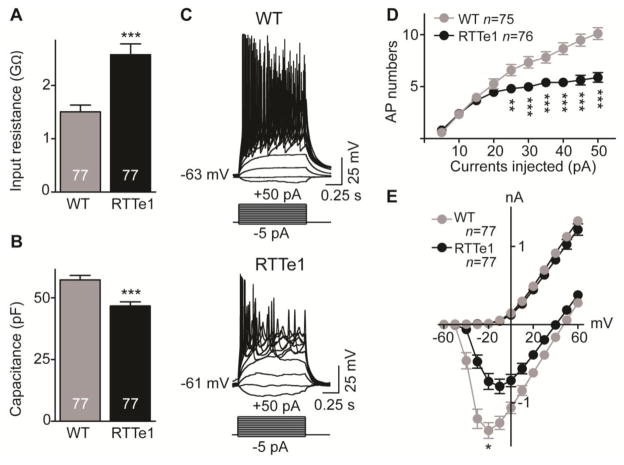
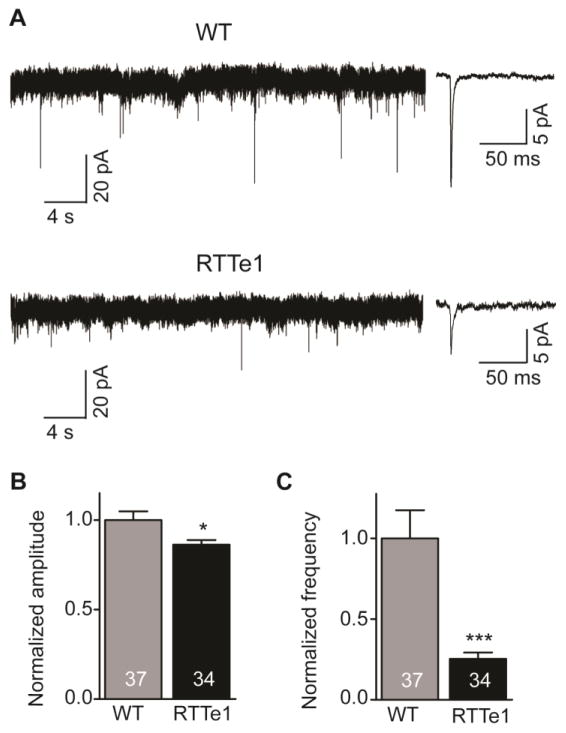
MECP2 mutations cause the X-linked neurodevelopmental disorder Rett Syndrome (RTT) by consistently altering the protein encoded by the MECP2e1 alternative transcript. While mutations that simultaneously affect both MECP2e1 and MECP2e2 isoforms have been widely studied, the consequence of MECP2e1 deficiency on human neurons remains unknown. Here we report the first isoform-specific patient induced pluripotent stem cell (iPSC) model of RTT. RTTe1 patient iPS cell-derived neurons retain an inactive X-chromosome and express only the mutant allele. Single-cell mRNA analysis demonstrated they have a molecular signature of cortical neurons. Mutant neurons exhibited a decrease in soma size, reduced dendritic complexity and decreased cell capacitance, consistent with impaired neuronal maturation. The soma size phenotype was rescued cell-autonomously by MECP2e1 transduction in a level-dependent manner but not by MECP2e2 gene transfer. Importantly, MECP2e1 mutant neurons showed a dysfunction in action potential generation, voltage-gated Na(+) currents, and miniature excitatory synaptic current frequency and amplitude. We conclude that MECP2e1 mutation affects soma size, information encoding properties and synaptic connectivity in human neurons that are defective in RTT.
Keywords: MeCP2; Rett syndrome; iPS cell disease models.
Copyright © 2015. Published by Elsevier Inc.
Conflict of interest statement
The authors declare no conflicts of interest.
Figures


Similar articles
-
Rett syndrome induced pluripotent stem cell-derived neurons reveal novel neurophysiological alterations.Mol Psychiatry. 2012 Dec;17(12):1261-71. doi: 10.1038/mp.2011.180. Epub 2012 Jan 10. Mol Psychiatry. 2012. PMID: 22230884 Free PMC article.
-
Graded and pan-neural disease phenotypes of Rett Syndrome linked with dosage of functional MeCP2.Protein Cell. 2021 Aug;12(8):639-652. doi: 10.1007/s13238-020-00773-z. Epub 2020 Aug 27. Protein Cell. 2021. PMID: 32851591 Free PMC article.
-
Isolation of MECP2-null Rett Syndrome patient hiPS cells and isogenic controls through X-chromosome inactivation.Hum Mol Genet. 2011 Jun 1;20(11):2103-15. doi: 10.1093/hmg/ddr093. Epub 2011 Mar 3. Hum Mol Genet. 2011. PMID: 21372149 Free PMC article.
-
Role of DNA Methyl-CpG-Binding Protein MeCP2 in Rett Syndrome Pathobiology and Mechanism of Disease.Biomolecules. 2021 Jan 8;11(1):75. doi: 10.3390/biom11010075. Biomolecules. 2021. PMID: 33429932 Free PMC article. Review.
-
[Research progress of Rett syndrome causing gene MECP2--the structure, function and modulation of MECP2].Beijing Da Xue Xue Bao Yi Xue Ban. 2009 Dec 18;41(6):712-5. Beijing Da Xue Xue Bao Yi Xue Ban. 2009. PMID: 20019788 Review. Chinese.
Cited by
-
Epigenetic alterations induced by environmental stress associated with metabolic and neurodevelopmental disorders.Environ Epigenet. 2016 Aug 8;2(3):dvw017. doi: 10.1093/eep/dvw017. eCollection 2016 Aug. Environ Epigenet. 2016. PMID: 29492297 Free PMC article. Review.
-
Organs to Cells and Cells to Organoids: The Evolution of in vitro Central Nervous System Modelling.Front Cell Neurosci. 2019 Apr 9;13:129. doi: 10.3389/fncel.2019.00129. eCollection 2019. Front Cell Neurosci. 2019. PMID: 31024259 Free PMC article. Review.
-
Transition from Animal-Based to Human Induced Pluripotent Stem Cells (iPSCs)-Based Models of Neurodevelopmental Disorders: Opportunities and Challenges.Cells. 2023 Feb 7;12(4):538. doi: 10.3390/cells12040538. Cells. 2023. PMID: 36831205 Free PMC article. Review.
-
Concise Review: Progress and Challenges in Using Human Stem Cells for Biological and Therapeutics Discovery: Neuropsychiatric Disorders.Stem Cells. 2016 Mar;34(3):523-36. doi: 10.1002/stem.2295. Epub 2016 Feb 11. Stem Cells. 2016. PMID: 26840228 Free PMC article. Review.
-
Generation of Cholinergic and Dopaminergic Interneurons from Human Pluripotent Stem Cells as a Relevant Tool for In Vitro Modeling of Neurological Disorders Pathology and Therapy.Stem Cells Int. 2016;2016:5838934. doi: 10.1155/2016/5838934. Epub 2016 Dec 25. Stem Cells Int. 2016. PMID: 28105055 Free PMC article. Review.
References
-
- Amir RE, et al. Rett syndrome is caused by mutations in X-linked MECP2, encoding methyl-CpG-binding protein 2. Nature genetics. 1999;23:185–8. - PubMed
Publication types
MeSH terms
Substances
Grants and funding
LinkOut - more resources
Full Text Sources
Other Literature Sources
Medical
Research Materials
