. 2015 Apr;59(4):2153-68.
doi: 10.1128/AAC.03599-14. Epub 2015 Feb 2.

Quercetin sensitizes fluconazole-resistant candida albicans to induce apoptotic cell death by modulating quorum sensing

Affiliations

Quercetin sensitizes fluconazole-resistant candida albicans to induce apoptotic cell death by modulating quorum sensing

B N Singh et al. Antimicrob Agents Chemother. 2015 Apr.

Abstract

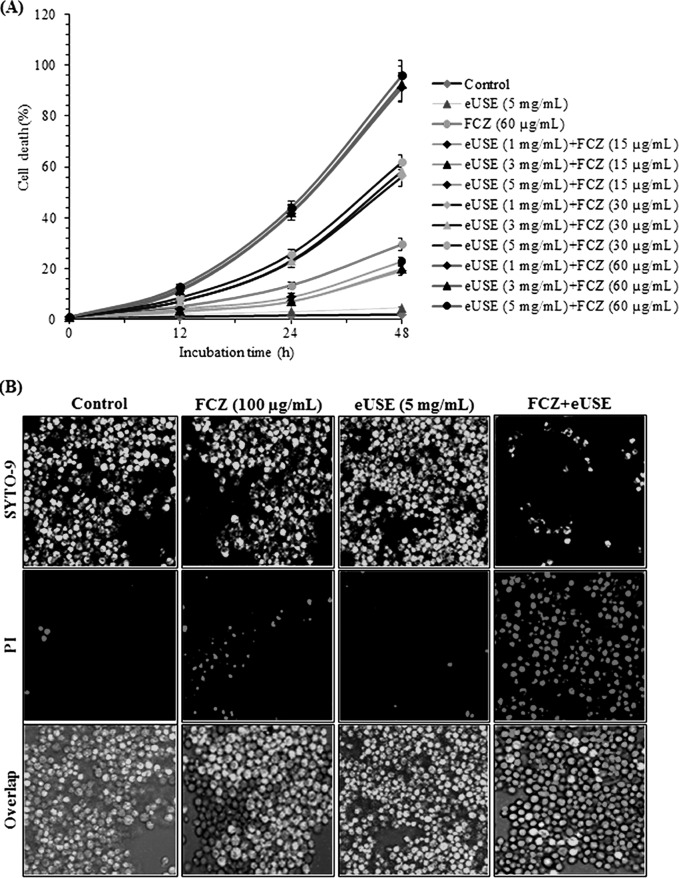
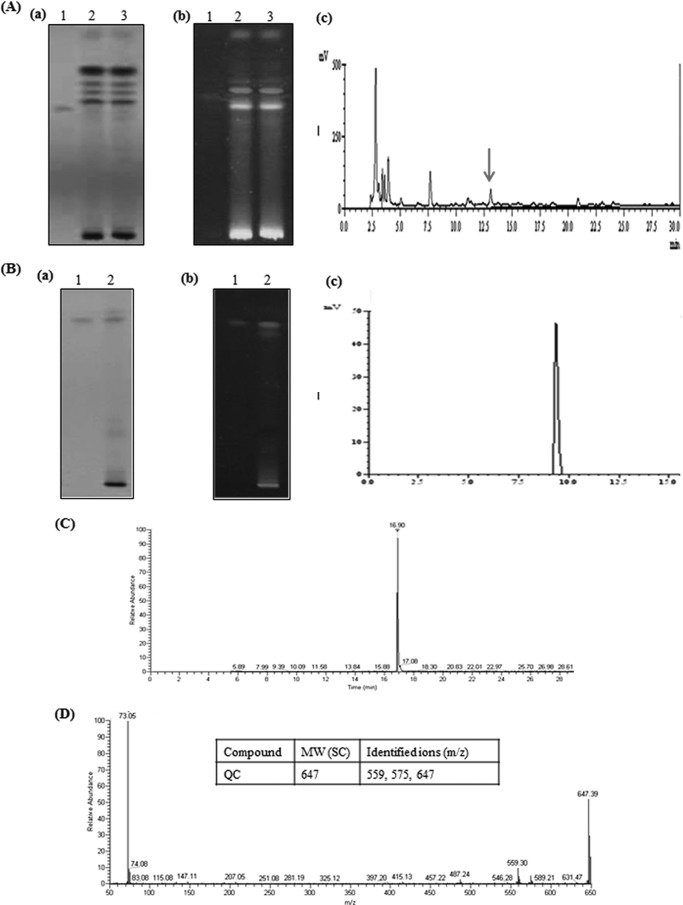
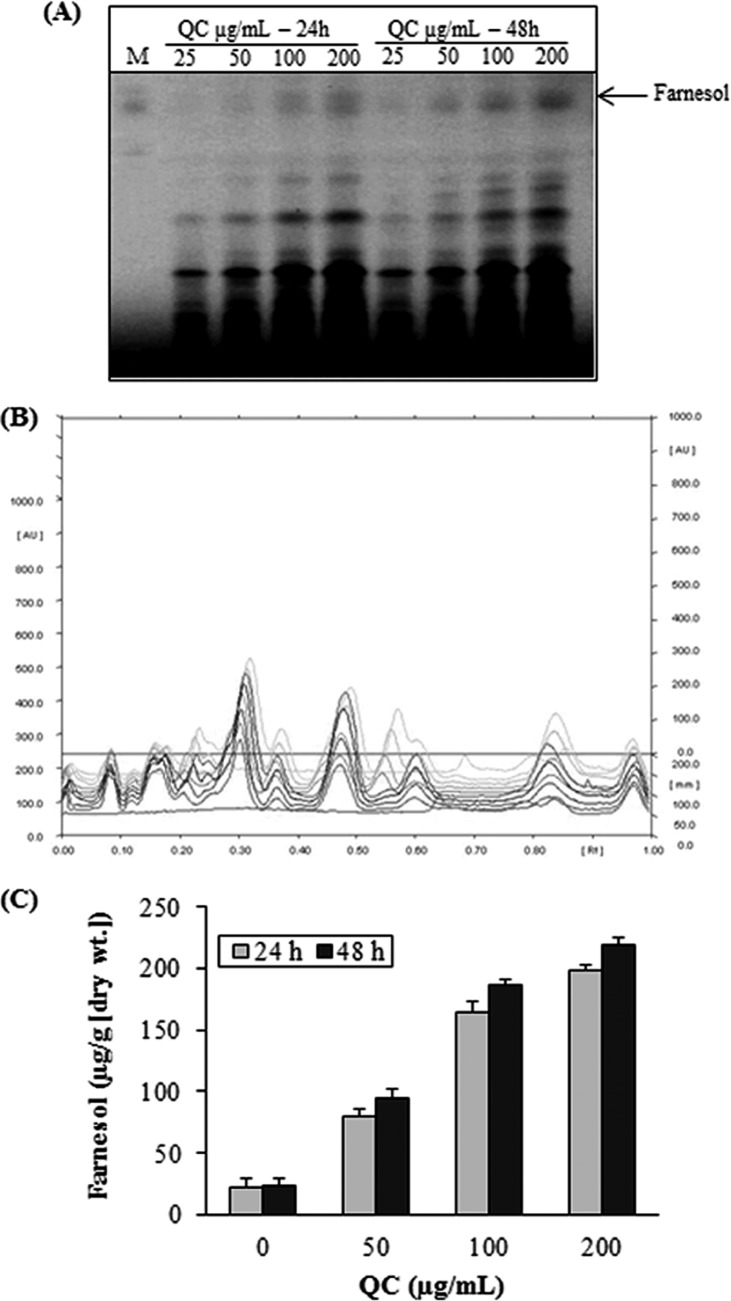
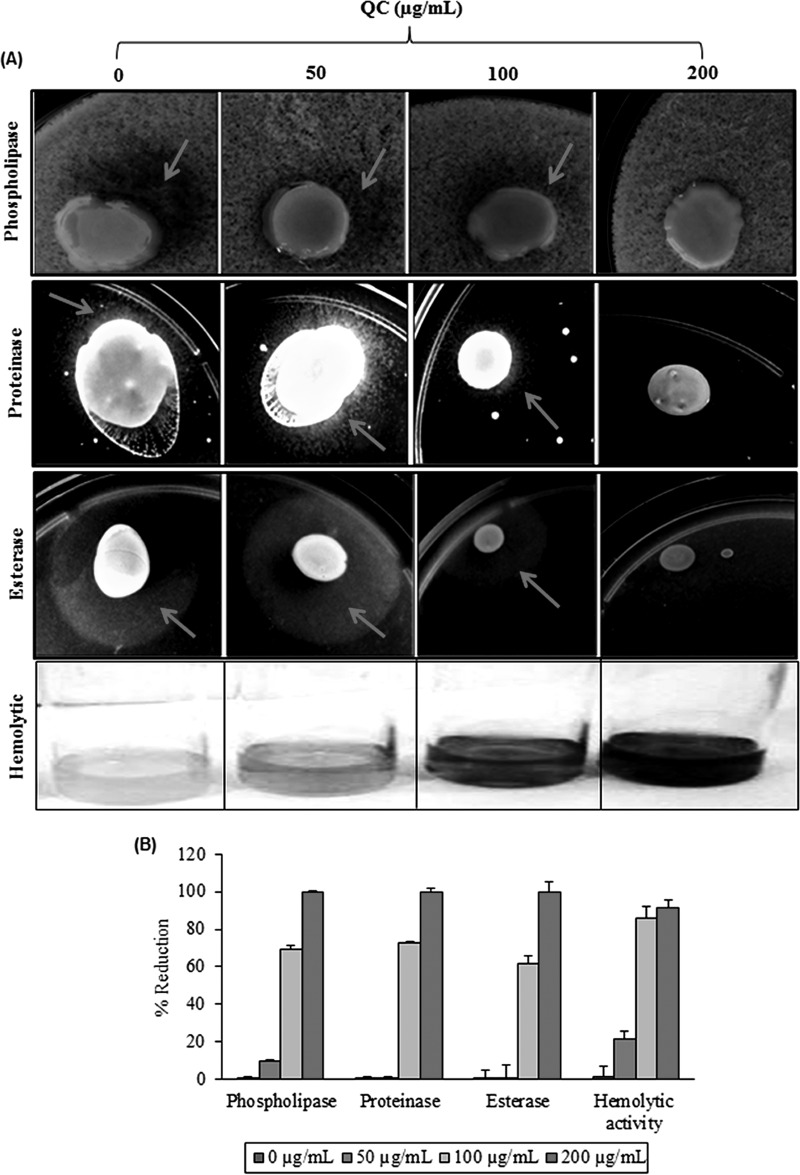
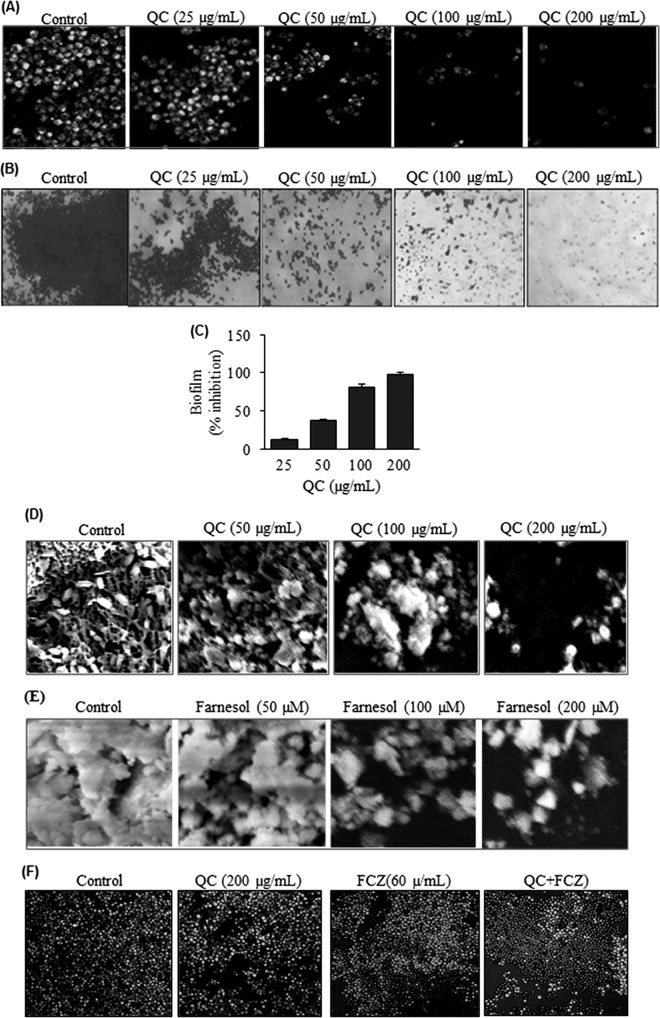
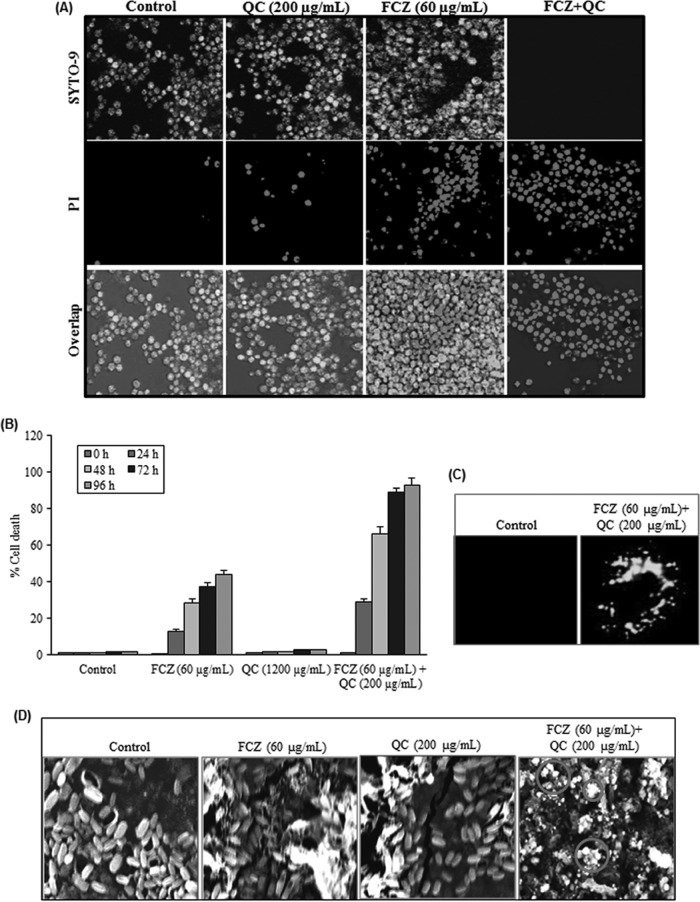
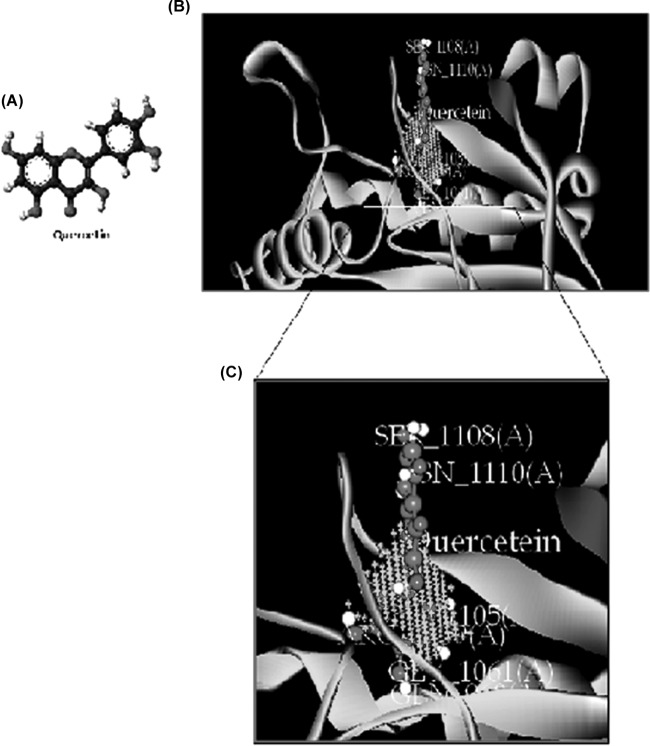
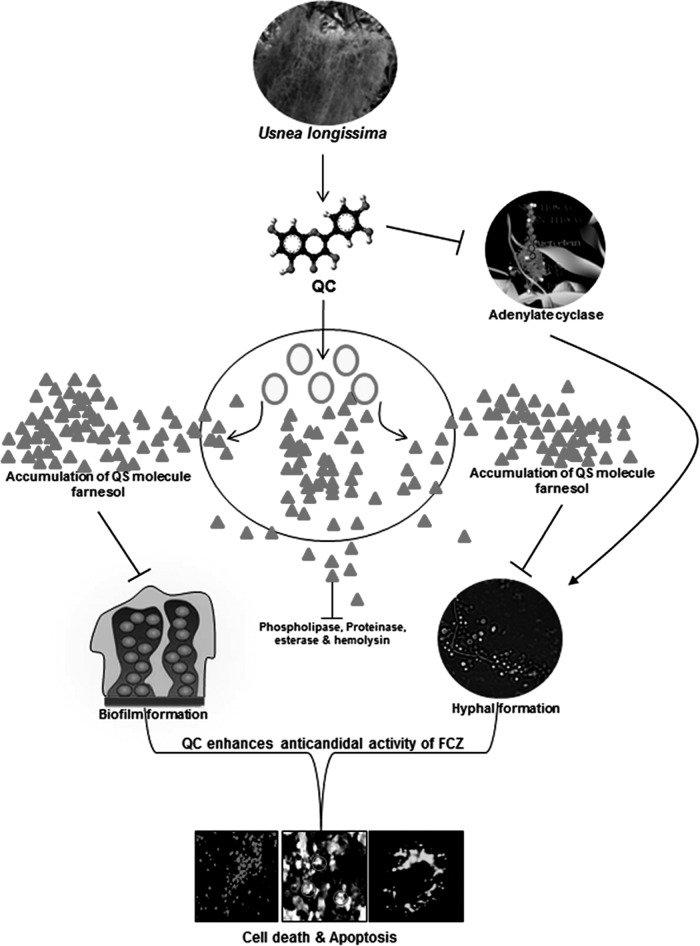
Quorum sensing (QS) regulates group behaviors of Candida albicans such as biofilm, hyphal growth, and virulence factors. The sesquiterpene alcohol farnesol, a QS molecule produced by C. albicans, is known to regulate the expression of virulence weapons of this fungus. Fluconazole (FCZ) is a broad-spectrum antifungal drug that is used for the treatment of C. albicans infections. While FCZ can be cytotoxic at high concentrations, our results show that at much lower concentrations, quercetin (QC), a dietary flavonoid isolated from an edible lichen (Usnea longissima), can be implemented as a sensitizing agent for FCZ-resistant C. albicans NBC099, enhancing the efficacy of FCZ. QC enhanced FCZ-mediated cell killing of NBC099 and also induced cell death. These experiments indicated that the combined application of both drugs was FCZ dose dependent rather than QC dose dependent. In addition, we found that QC strongly suppressed the production of virulence weapons-biofilm formation, hyphal development, phospholipase, proteinase, esterase, and hemolytic activity. Treatment with QC also increased FCZ-mediated cell death in NBC099 biofilms. Interestingly, we also found that QC enhances the anticandidal activity of FCZ by inducing apoptotic cell death. We have also established that this sensitization is reliant on the farnesol response generated by QC. Molecular docking studies also support this conclusion and suggest that QC can form hydrogen bonds with Gln969, Thr1105, Ser1108, Arg1109, Asn1110, and Gly1061 in the ATP binding pocket of adenylate cyclase. Thus, this QS-mediated combined sensitizer (QC)-anticandidal agent (FCZ) strategy may be a novel way to enhance the efficacy of FCZ-based therapy of C. albicans infections.


Figures

FIG 1
FIG 1
Effects of eUSE and FCZ on NBC099 survival. (A) Time-kill curves determined by colony counting. Cells were exposed to various concentrations of eUSE and FCZ. Data at the respective time points are mean cell counts (log10 cells/ml) of the starting inoculum (CFU/ml) ± the standard deviations of three independent experiments. (B) Growth inhibition as examined by the disc diffusion method. Pellets harvested from the mid-log phase were resuspended in NSS. A 100-μl volume of suspended cells was spread uniformly on an SD agar plate, and a presterilized disc (6 mm) was placed on it. Subsequently, QC and FCZ were loaded for 24 h of incubation at 30°C. For each treatment, six experiments were performed.
FIG 2
FIG 2
Impact of eUSE and FCZ on NBC099 cell death. (A) Cells were treated with various amounts of eUSE and FCZ for the times indicated. Cell death was examined by using MTT dye. All data were normalized to the MTT conversion activity of medium-treated control cells. Each value is the mean ± the standard deviation of three independent experiments. (B) Treated cells were harvested and processed with the LIVE/DEAD cell viability kit (Life Technologies) as described in the manufacturer's protocol. Live SYTO 9-stained green cells and dead PI-stained red cells were visualized by LSCM with an LSM-510 META (Zeiss, Munich, Germany) with FITC (excitation and emission wavelengths of 480 and 500 nm) and tetramethyl rhodamine isothiocyanate (excitation and emission wavelengths of 490 and 635 nm) optical filters, respectively.
FIG 3
FIG 3
Identification of QC in eUSE. (A) Methanolic extract of eUSE was dissolved in water and then partitioned successively with chloroform, dichloromethane, ethyl acetate, and butanol. Only EAE was found to be effective against NBC099 when applied with FCZ. Then EAE and the reference compound were subjected to TLC with silica gel 60G F254 plates (20 by 10 cm; 0.25 mm) by elution with toluene-ethyl acetate-formic acid (7.5:2:0.5) and visualized under UV at 254 (a) and 366 (b) nm. Quantification of the compound was done with a model 3 CAMAG TLC scanner with CAMAG winCATS IV software and QC (lanes 1) and EAE (lanes 2 and 3) as reference compounds. (c) RP-HPLC with a C18 column was also used for EAE. Compound separation was achieved with methanol-H2O-acetic acid (60:39:1) as the mobile phase at a flow rate of 1.0 ml/min. The arrow shows the position of QC. (B) Identification of purified fraction by HPTLC under UV light at 254 (a) and 366 (b) nm and RP-HPLC (c). Lanes: 1, reference compound QC; 2, purified fraction. GC-MS analysis. (C) The purified fraction was subjected to silylation, and its molecular weight of 637 was measured at 16.90 min. (D) Production of fragmented ions. The inset shows the molecular weight (MW) of purified compound and its important ions identified during GC-MS analysis.
FIG 4
FIG 4
Effects of QC on farnesol production. Supernatant was collected from QC-treated or untreated broth culture of NBC099 cells and extracted thrice with a one-fifth volume of ethyl acetate. The solvent was removed, and the residue was resuspended in absolute ethanol and applied to silica gel 60G F254 plates. Separation of farnesol was obtained with a solvent system consisting of toluene-ethyl acetate-formic acid (7.5:2:0.5), and the results were quantified by HPTLC with CAMAG winCATS IV software. Panels: A, UV at 254 nm; B, overlapping spectra; C, quantified contents of farnesol versus concentrations of QC (inset, incubation times). Each value is the mean result ± the standard deviation of two independent experiments.
FIG 5
FIG 5
Inhibition of hypha formation by QC. (A) A mid-log-phase culture of NBC099 was diluted to 1 × 10⁶ cells/ml with SD broth medium containing 10% FBS and exposed to various concentrations of QC. Cells were grown at 30°C for 72 h. Aliquots were placed on slides, visualized by differential interference contrast microscopy, and photographed at a magnification of ×40. (B) Aliquots of NBC099 (1 × 10⁶ cells/ml) were placed on glass slides and grown for 72 h at 30°C under aseptic and moist conditions. The cells were washed with PBS and stained with 0.2% CV solution for 5 min at room temperature. The cells then were dried, visualized by differential interference contrast microscopy, and photographed at a magnification of ×20. (C) Graph of percent inhibition of hypha formation versus various concentrations of QC. Each value is the mean result ± the standard deviation of three independent experiments.
FIG 6
FIG 6
Inhibitory effect of QC on the production of virulence factors. (A) To determine phospholipase activity, SD agar medium containing 10% sterile egg yolk was inoculated with 10 μl of a mid-log-phase NBC099 cell culture and incubated for 5 days. The presence of enzyme activity was determined by the formation of a precipitated dark brown zone around the inoculum. Proteinase activity was determined with bovine serum albumin agar. Ten microliters of an active culture of NBC099 was inoculated onto the plates and incubated for 5 days. The presence of proteinase activity was determined by the formation of a transparent halo zone around the inoculum. Tween 80 opacity test agar medium was used to examine esterase activity. NBC099-inoculated medium was incubated for 5 days, and the formation of a halo zone around the inoculation site was considered positive proof of esterase activity. To determine hemolytic activity, SD broth containing 7% sheep blood and 3% glucose was inoculated with 5 ml of active culture of NBC099. After 48 h of incubation, decolorization of the red medium was considered positive proof of hemolytic activity. (B) Percent reduction of virulence factor activity in the absence or presence of QC. Each value is the mean result ± the standard deviation of six independent experiments.
FIG 7
FIG 7
Inhibition of biofilm formation by QC. (A) NBC099 cells were grown on glass coverslips under aseptic and humid conditions in the presence or absence of QC. Degrees of biofilm formation were assessed in terms of cell viability in biofilm cultures with the LIVE/DEAD cell viability kit (Life Technologies). Live SYTO 9-stained cells were visualized by LSCM with an FITC (excitation and emission wavelengths of 480 and 500 nm) filter. (B) Cells grown on glass slides were washed with PBS and stained with 0.2% CV solution for 5 min at room temperature. After the cells were dried, biofilm formation was visualized by differential interference contrast microscopy and photographed. (C) NBC099 cells were grown in a 96-well flat-bottom microplate in the presence or absence of QC for 48 h. The medium was then discarded, and the cells were sterilized by adding 70% ethanol to each well for 1 min and washed twice with distilled water. Cells were stained by adding 0.2% CV solution for 15 min. After the microplate was dried, isopropanol containing 0.04 N HCl and 0.25% sodium dodecyl sulfate was added and the A590 was measured. Results are expressed as percentages of inhibition relative to the control. Each value is the mean result ± the standard deviation of three independent experiments. (D and E) Exponentially growing NBC099 cells that had been exposed to QC (D) and farnesol (E) for 48 h were harvested, washed, fixed in 2.0% glutaraldehyde, and then postfixed in 1% osmium tetroxide buffer. After dehydration in a graded ethanol series, the cells were embedded in spur resin and sections were cut on an Ultramicrotome. The sectioned grids were stained with saturated solutions of uranyl acetate and lead citrate and examined by SEM. (F) Sensitivity of QC-treated NBC099 biofilms to FCZ. NBC099 biofilms were grown in the absence or presence of QC. After 72 h, the biofilms were exposed to FCZ for 36 h. Cell viability was assayed by staining with the LIVE/DEAD Cell Viability kit. PI-stained areas are dead cells, and SYTO 9-stained areas are live cells, as analyzed by LSCM.
FIG 8
FIG 8
Enhancement of FCZ-mediated apoptotic cell death by QC. (A) Exponentially growing NBC099 cells were treated with QC and FCZ, harvested, and processed with the LIVE/DEAD cell viability kit (Life Technologies) as described in the manufacturer's protocol. Live SYTO 9-stained green cells and dead PI-stained red cells were visualized by LSCM with FITC (excitation and emission wavelengths of 480 and 500 nm) and tetramethyl rhodamine isothiocyanate (excitation and emission wavelengths of 490 and 635 nm) optical filters, respectively. (B) Cells were treated with QC and FCZ for 48 h. Cell death was examined with MTT dye. All data were normalized to the MTT conversion activity of medium-treated control cells. Each value is the mean ± the standard deviation of three independent experiments. (C) Exponentially growing NBC099 cells were grown on glass coverslips in the absence or presence of QC plus FCZ for 48 h at 30°C, washed, and then incubated with monoclonal antibody CK18 (1:100) for detection of apoptosis by LSCM. (D) Cells were grown in the presence or absence of QC and FCZ for 48 h and processed for SEM analysis as described in the legend to Fig. 7D. Cell death and apoptosis induced by QC plus FCZ, as indicated by the circles, were examined by SEM.
FIG 9
FIG 9
Molecular docking of the interaction between QC and adenylate cyclase. (A) 3D structure of QC. (B) Binding orientation of QC in adenylate cyclase. The protein is depicted as a ribbon, and secondary structures (i.e., helix, strand, and loop) are shown. (C) Both QC and ligand contact residues are represented in stick form.
FIG 10
FIG 10
Possible mechanism by which QC induces FCZ-mediated apoptotic cell death in FCZ-resistant C. albicans NBC099. To summarize our research, QC inhibited farnesol-mediated hyphal development, biofilm formation, and production of virulence factors in C. albicans NBC099 cells. Moreover, QC was found to inhibit adenylate cyclase activity in NBC099, a key enzyme responsible for suppression of farnesol production. Later, QC increased the sensitization of NBC099 cells to FCZ, thereby inducing cell death and eventually apoptotic cell death.

References

    1. Chander J, Singla N, Sidhu SK, Gombar S. 2013. Epidemiology of Candida blood stream infections: experience of a tertiary care centre in North India. J Infect Dev Ctries 7:670–675. doi:10.3855/jidc.2623. - DOI - PubMed
    1. Pfaller MA, Diekema DJ. 2007. Epidemiology of invasive candidiasis: a persistent public health problem. Clin Microbiol Rev 20:133–163. doi:10.1128/CMR.00029-06. - DOI - PMC - PubMed
    1. Li DD, Xu Y, Zhang DZ, Quan H, Mylonakis E, Hu DD, Li MB, Zhao LX, Zhu LH, Wang Y, Jiang YY. 2013. Fluconazole assists berberine to kill fluconazole-resistant Candida albicans. Antimicrob Agents Chemother 57:6016–6027. doi:10.1128/AAC.00499-13. - DOI - PMC - PubMed
    1. Castelo-Branco DS, Brilhante RS, Paiva MA, Teixeira CE, Caetano EP, Ribeiro JF, Cordeiro RA, Sidrim JJ, Monteiro AJ, Rocha MF. 2013. Azole-resistant Candida albicans from a wild Brazilian porcupine (Coendou prehensilis): a sign of an environmental imbalance? Med Mycol 51:555–560. doi:10.3109/13693786.2012.752878. - DOI - PubMed
    1. Youngsaye W, Hartland CL, Morgan BJ, Ting A, Nag PP, Vincent B, Mosher CA, Bittker JA, Dandapani S, Palmer M, Whitesell L, Lindquist S, Schreiber SL, Munoz B. 2013. ML212: A small-molecule probe for investigating fluconazole resistance mechanisms in Candida albicans. Beilstein J Org Chem 9:1501–1507. doi:10.3762/bjoc.9.171. - DOI - PMC - PubMed

Publication types

MeSH terms

Associated data