. 2015 Mar 27;290(13):8067-80.
doi: 10.1074/jbc.M114.633081. Epub 2015 Feb 2.

Anti-tumoral effects of miR-3189-3p in glioblastoma

Affiliations

Anti-tumoral effects of miR-3189-3p in glioblastoma

Duane Jeansonne et al. J Biol Chem. .

Abstract

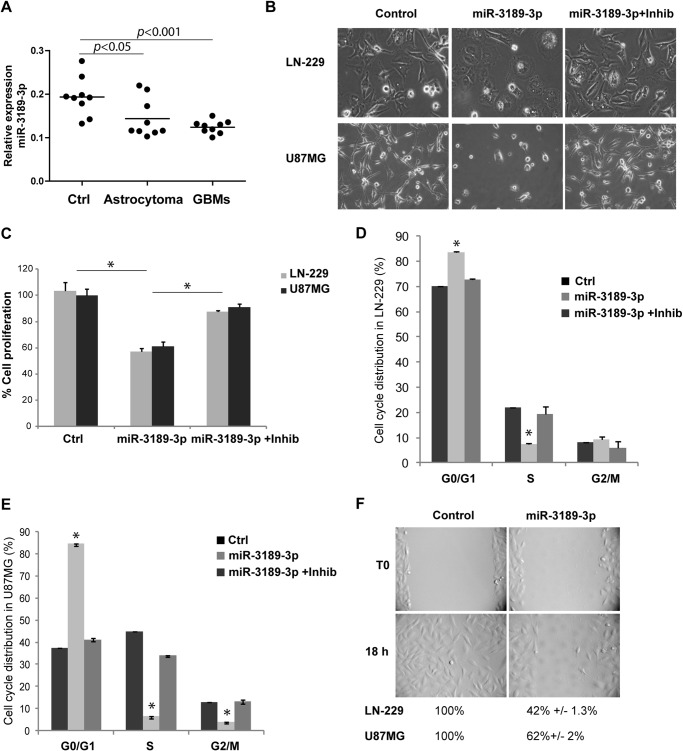
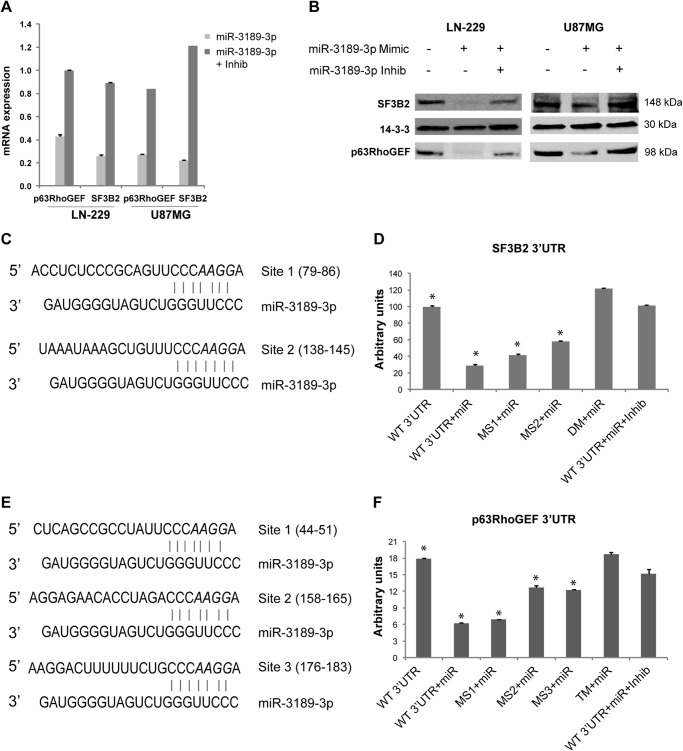
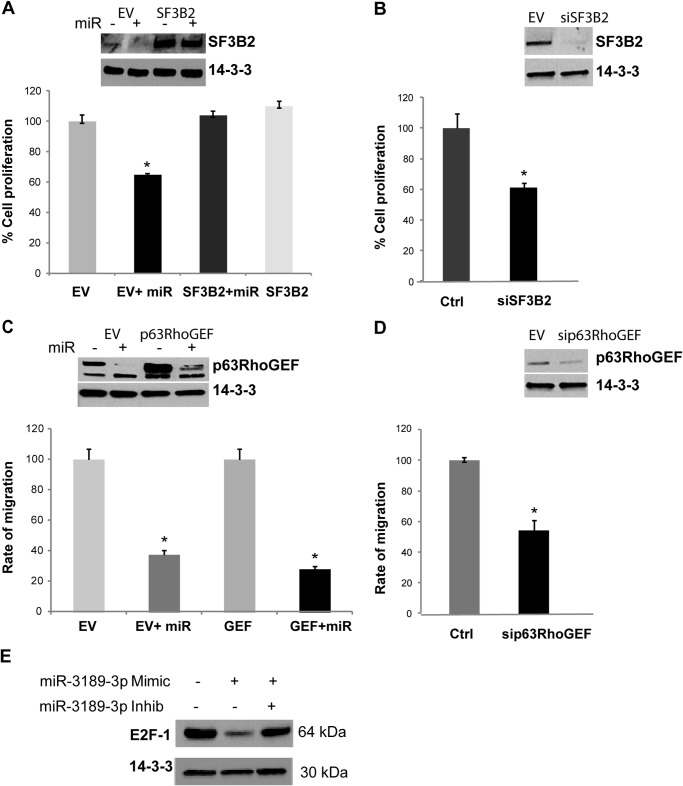
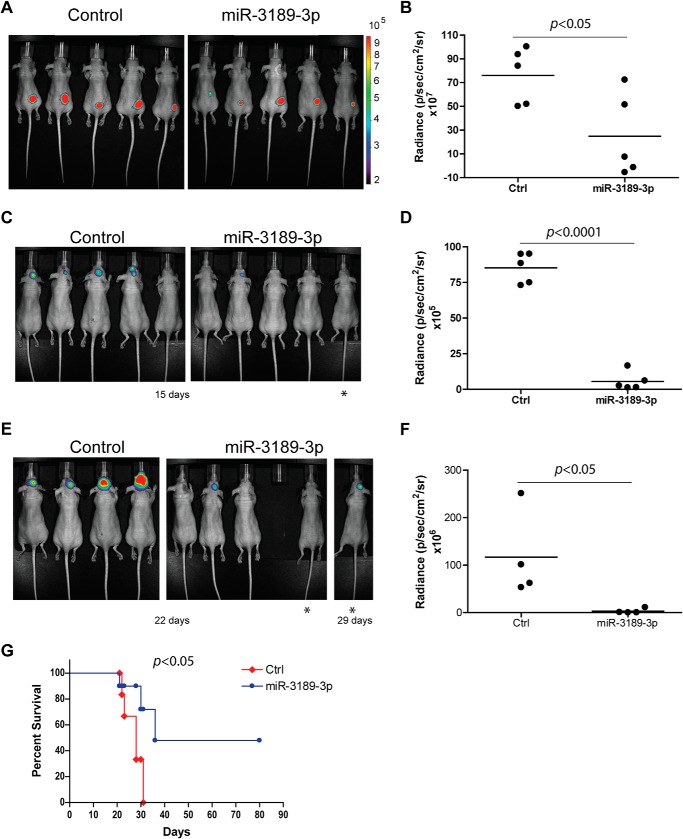
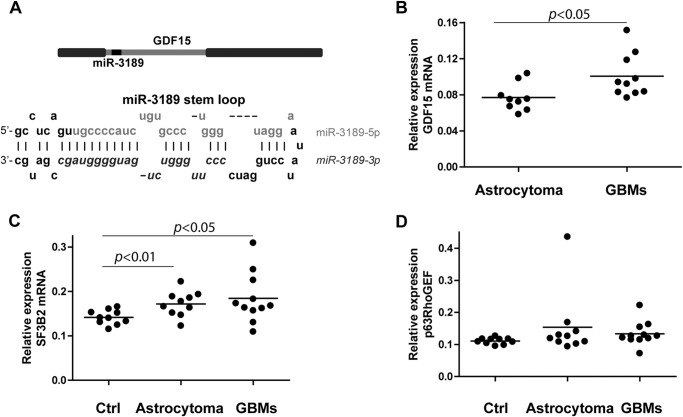
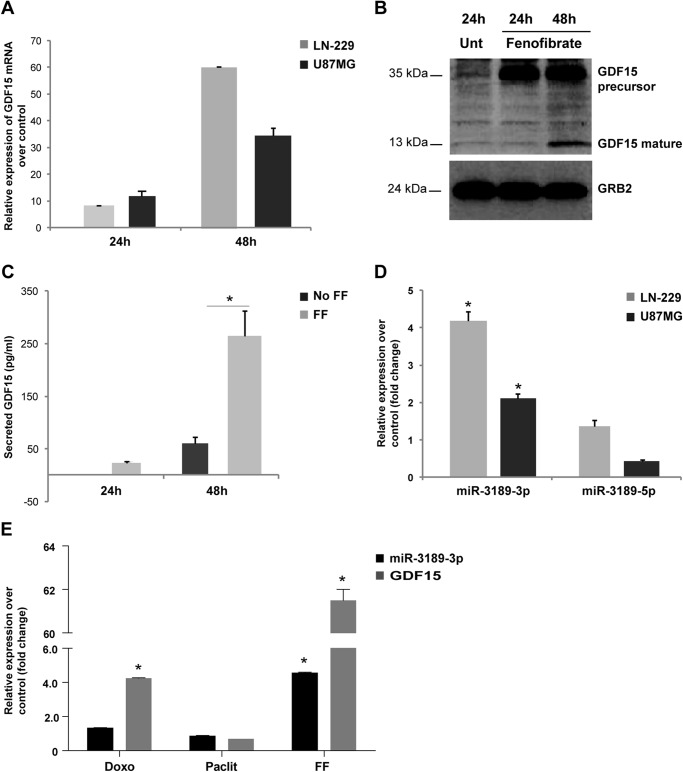
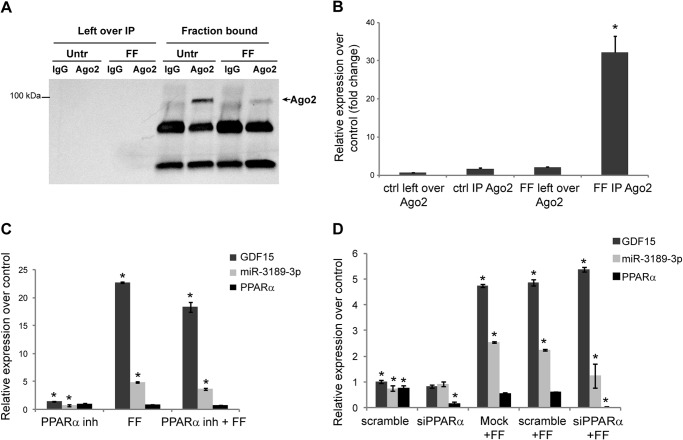
Glioblastoma is one of the most aggressive brain tumors. We have previously found up-regulation of growth differentiation factor 15 (GDF15) in glioblastoma cells treated with the anticancer agent fenofibrate. Sequence analysis of GDF15 revealed the presence of a microRNA, miR-3189, in the single intron. We then asked whether miR-3189 was expressed in clinical samples and whether it was functional in glioblastoma cells. We found that expression of miR-3189-3p was down-regulated in astrocytoma and glioblastoma clinical samples compared with control brain tissue. In vitro, the functionality of miR-3189-3p was tested by RNA-binding protein immunoprecipitation, and miR-3189-3p coimmunoprecipitated with Argonaute 2 together with two of its major predicted gene targets, the SF3B2 splicing factor and the guanine nucleotide exchange factor p63RhoGEF. Overexpression of miR-3189-3p resulted in a significant inhibition of cell proliferation and migration through direct targeting of SF3B2 and p63RhoGEF, respectively. Interestingly, miR-3189-3p levels were increased by treatment of glioblastoma cells with fenofibrate, a lipid-lowering drug with multiple anticancer activities. The attenuated expression of miR-3189-3p in clinical samples paralleled the elevated expression of SF3B2, which could contribute to the activation of SF3B2 growth-promoting pathways in these tumors. Finally, miR-3189-3p-mediated inhibition of tumor growth in vivo further supported the function of this microRNA as a tumor suppressor.

Keywords: Cell Migration; Cell Proliferation; Glioblastoma; MicroRNA (miRNA); Tumor Suppressor Gene.


Figures

FIGURE 1.
FIGURE 1.
MiR-3189-3p is down-regulated in glial tumors and affects growth and migration of glioblastoma cells in culture. A, relative expression of miR-3189-3p in controls (Ctrl), astrocytomas, and glioblastomas (GBM) (n = 9/group). B, phase-contrast images showing the morphology of LN-229 and U87MG cells following transfection with miR-3189-3p or miR-3189-3p + anti-miR-3189-3p (original magnification, ×10). Images were acquired 48 h post-transfection. Inhib, inhibitor. C, cell proliferation assay performed 72 h post-transfection of the indicated cell lines with mock, miR-3189-3p, or miR-3189-3p + inhibitor and quantified using 3-(4,5-dimethylthiazol-2-yl)-5-(3-carboxymethoxyphenyl)-2-(4-sulfophenyl)-2H-tetrazolium reagent. Results are expressed as percent of growth/mock-treated control. D and E, cell cycle analysis of LN-229 (D) and U87MG (E) cells transfected with mock (ctrl), miR-3189-3p, and anti-miR-3189-3p (Inhib). Cells were stained with Guava cell cycle reagent and cell cycle distribution (%) was quantified by flow cytometry using a FACSAria. F, representative images of a scratch assay to monitor migration of controls (mock-transfected) and miR-3189-3p-transfected LN-229 cells (original magnification, ×10). Migration into the cell-free area was monitored by time-lapse imaging in a VivaView fluorescent microscope. The same experiment was performed in U87MG cells, and data are shown below the images in F. *, p < 0.05.
FIGURE 2.
FIGURE 2.
MiR-3189-3p directly targets the 3UTR sequences of SF3B2 and p63RhoGEF. A, quantitative real-time PCR showing expression of p63RhoGEF and SF3B2 mRNAs in mock-transfected cells transfected with miR-3189-3p and cells transfected with miR-3189-3p + anti-miR-3189-3p. Results are expressed as -fold change compared with mock-treated cells. Inhib, inhibitor. B, Western blots for SF3B2 and p63RhoGEF proteins performed on lysates from LN-229 and U87MG cells mock-transfected or transfected with miR-3189-3p or miR-3189-3p + anti-miR-3189-3p (Inhib) for 48 h. C–E, predicted binding sites for miR-3189-3p in the SF3B2 (C) and p63RhoGEF (E) 3′UTR sequences. The bases mutated in the microRNA binding site are shown in italics. D, luciferase assays of LN-229 cells cotransfected with psiCHECK2/SF3B2 3′UTR and the mutants in the miR-3189-3p putative binding sites (MS1 and MS2) and miR-3189-3p ± anti-miR-3189-3p (Inhib). F, luciferase assays of LN-229 cells cotransfected with psiCHECK2/p63RhoGEF 3′UTR and mutants (MS1, MS2, and MS3) and miR-3189-3p with or without anti-miR-3189-3p (Inhib). MS1–3, specific microRNA binding site mutants; DM, double-binding site mutants; TM, triple-binding site mutants. *, p < 0.05.
FIGURE 3.
FIGURE 3.
MiR-3189-3p regulates LN-229 cell growth and migration through the down-regulation of SF3B2 and p63RhoGEF. A, cell growth assay performed 72 h after transient transfection of LN-229/pcDNA3.1 (EV) or LN-229/SF3B2 with miR-3189-3p. The inset shows levels of expression of SF3B2 under the indicated experimental conditions. Results are expressed as percent growth/mock-treated control. B, cell growth assay performed with mock-treated control (Ctrl) or siSF3B2-treated LN-229 cells 72 h post-transfection. Results are expressed as percent growth/mock-treated control. C, results of scratch assays to monitor the migration of cells expressing the p63RhoGEF gene (GEF). The inset shows the levels of expression of p63RhoGEF protein under the indicated conditions. D, plot of a scratch assay to monitor the migration of mock-treated control or sip63RhoGEF-treated LN-229 cells. The inset shows levels of expression of p63RhoGEF protein under the indicated conditions. E, Western blots for E2F-1 protein expression performed on lysates from mock-transfected cells or cells transfected with miR-3189-3p or miR-3189-3p + anti-miR-3189-3p (Inhib). 14-3-3ζ antibody was used to show equal loading of cellular lysates. *, p < 0.05.
FIGURE 4.
FIGURE 4.
Biophotonic measurements of orthotopic glioblastoma xenografts in vivo show significant tumor suppressor activity of miR-3189-3p. A, fluorescent images of LN-229/mCherry cells mock-transfected (Control) or transfected with miR-3189-3p implanted subcutaneously into nude mice (n = 5/group, p < 0.05). B, plot of tumor burden 3 weeks post-injection with control (Ctrl) or miR-3189-3p-transfected LN-229/mCherry cells. Relative fluorescence values are represented as photon flux per second per square centimeter and steradian. C–F, U87MG/luciferase cells mock-transfected (control) or transfected with miR-3189-3p were injected intracranially into nude mice (n = 5/group). Images were taken after 15 (C) and 22 days (E). The asterisks in E indicate the same mouse at day 29. The mouse missing in the miR-3189-3p group at day 21 died of tumor-unrelated reasons (see details under “Results”). Relative plots of radiance are shown in D and F. G, Kaplan-Meier curves comparing mice bearing mock-transfected (ctrl) or miR-3189-3p-transfected U87MG/luciferase cells. Statistical analysis revealed a significantly longer survival (p < 0.05) of mice injected with miR-3189-3p-transfected cells.
FIGURE 5.
FIGURE 5.
Evaluation of GDF15, SF3B2, and p63RhoGEF mRNA in clinical samples. A, schematic of the GDF15 gene encoding miR-3189 within the exon and of the stem loop of miR-3189 containing -3p and -5p mature microRNAs. Note that this location arrangement is typical of mirtrons. B–D, relative expression of GDF15, SF3B2, and p63RhoGEF mRNAs in human astrocytoma and glioblastoma (GBM) clinical samples, calculated as 1/ΔCt. Note that GDF15 mRNA was undetectable in control brain samples. Student's t test results (p values) are shown in the graphs.
FIGURE 6.
FIGURE 6.
Fenofibrate treatment up-regulates GDF15 and miR-3189-3p expression in LN-229 and U87MG cells. A, real-time PCR to detect GDF15 mRNA expression at the indicated time points after fenofibrate treatment. Results are expressed as -fold change (2−ΔΔCt method) of the mRNA in fenofibrate-treated LN-229 cells compared with untreated (Unt) cells (p < 0.05). B, under the same experimental conditions, mature and precursor GDF15 proteins were detected by Western blots. GRB2 antibody was used to show equal loading of cellular lysates. C, ELISA to detect secreted mature (active) GDF15 protein in the culture medium obtained from LN-229 cells treated with FF and control (no FF). The data represent the change in GDF15 levels in medium from fenofibrate-treated cells compared with untreated cells. D, relative expression of miR-3189-3p and miR-3189–5p in LN-229 and U87MG cells treated for 48 h with fenofibrate. E, bar graph representing the relative expression of GDF15 and miR-3189-3p in LN-229 cells treated with doxorubicin (Doxo), paclitaxel (Paclit), and FF for 48 h. Note that, in D and E, a -fold change of <2 means unchanged levels compared with controls. The differences in expression levels depicted in A and C were statistically significant (p < 0.05), whereas, in D and E, only those with the asterisk (*) had a p < 0.05 compared with controls.
FIGURE 7.
FIGURE 7.
MiR-3189-3p is up-regulated and incorporated into the RNA-induced silencing complex in cells treated with fenofibrate. A, Western blot to detect Ago2 after immunoprecipitation of lysates obtained from untreated (Untr) and fenofibrate-treated cells. Left over IP represents the fraction of lysates obtained after overnight incubation with Ago2 antibody or the control isotype IgG and is used as a negative control. B, real-time PCR to detect miR-3189-3p. Results are expressed as -fold change of the microRNAs in fenofibrate-treated cells compared with untreated cells. The enrichment of microRNAs or mRNAs in the RNA-induced silencing complex was calculated according to the formula 2−(CtAgo2 − CtIgG) and normalized over RNU6B. ctrl, control. C and D, relative expression of GDF15 and miR-3189-3p under the indicated conditions (treatments and transfections) compared with controls. *, p < 0.05 compared with the respective controls.

References

    1. Nakada M., Nakada S., Demuth T., Tran N. L., Hoelzinger D. B., Berens M. E. (2007) Molecular targets of glioma invasion. Cell. Mol. Life Sci. 64, 458–478 - PMC - PubMed
    1. Nagasawa D. T., Chow F., Yew A., Kim W., Cremer N., Yang I. (2012) Temozolomide and other potential agents for the treatment of glioblastoma multiforme. Neurosurg. Clin. N. Am. 23, 307–322, ix - PubMed
    1. Hegi M. E., Diserens A. C., Gorlia T., Hamou M. F., de Tribolet N., Weller M., Kros J. M., Hainfellner J. A., Mason W., Mariani L., Bromberg J. E., Hau P., Mirimanoff R. O., Cairncross J. G., Janzer R. C., Stupp R. (2005) MGMT gene silencing and benefit from temozolomide in glioblastoma. N. Engl. J. Med. 352, 997–1003 - PubMed
    1. Jeansonne D., Pacifici M., Lassak A., Reiss K., Russo G., Zabaleta J., Peruzzi F. (2013) Differential effects of MicroRNAs on glioblastoma growth and migration. Genes 4, 46–64 - PMC - PubMed
    1. Drukala J., Urbanska K., Wilk A., Grabacka M., Wybieralska E., Del Valle L., Madeja Z., Reiss K. (2010) ROS accumulation and IGF-IR inhibition contribute to fenofibrate/PPARα-mediated inhibition of glioma cell motility in vitro. Mol. Cancer 9, 159. - PMC - PubMed

Publication types

MeSH terms