. 2015 Feb 2;208(3):331-50.
doi: 10.1083/jcb.201405099.

Dense fibrillar collagen is a potent inducer of invadopodia via a specific signaling network

Affiliations

Dense fibrillar collagen is a potent inducer of invadopodia via a specific signaling network

Vira V Artym et al. J Cell Biol. .

Abstract

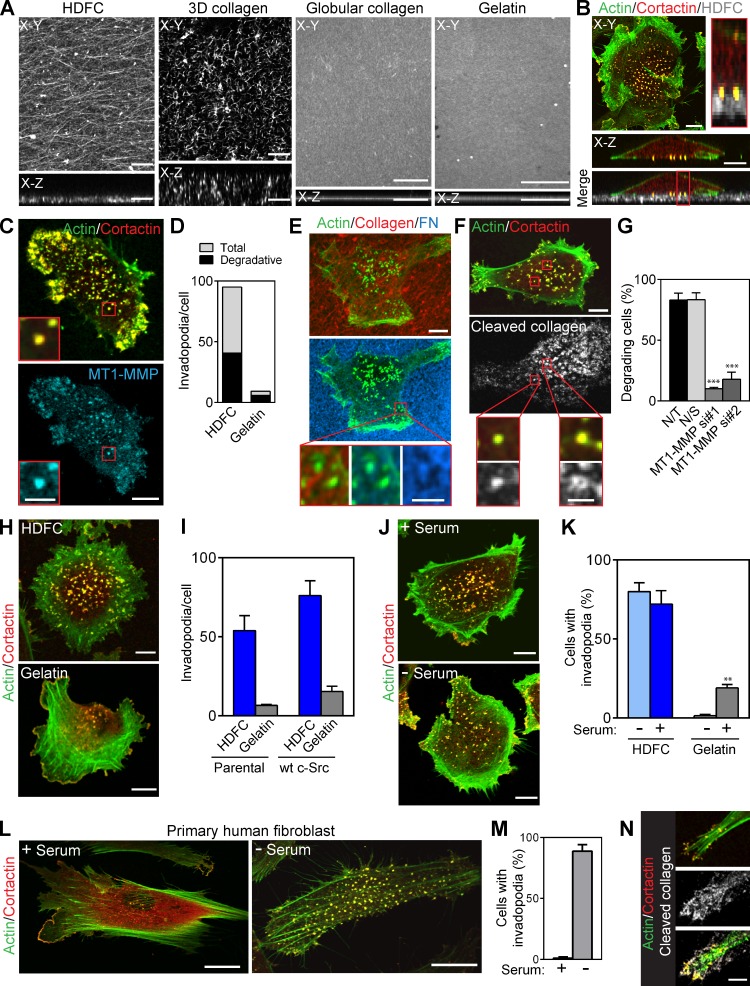
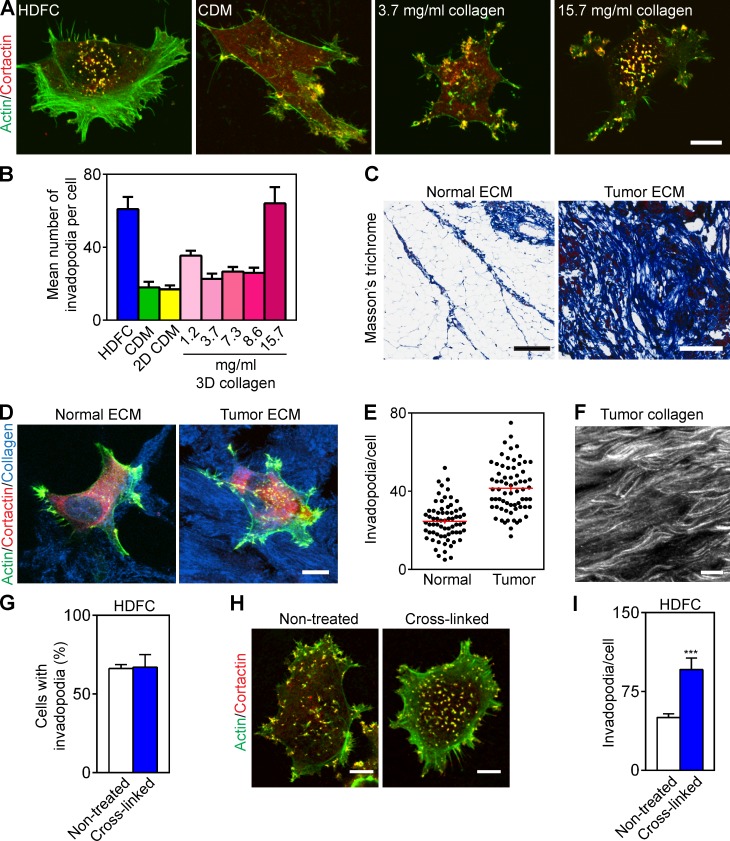
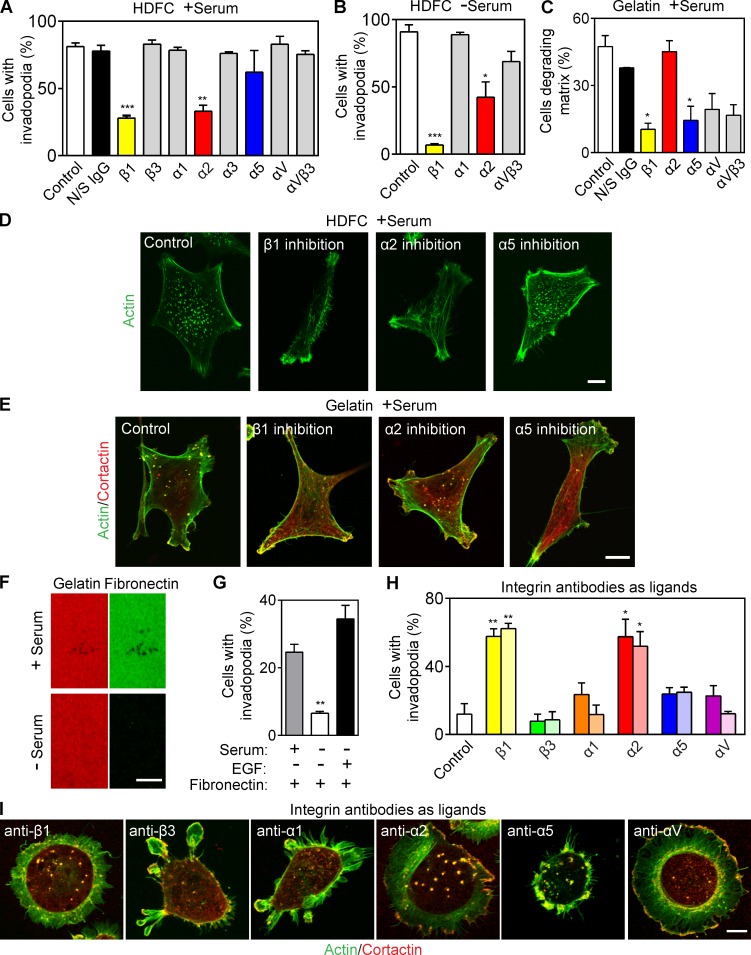
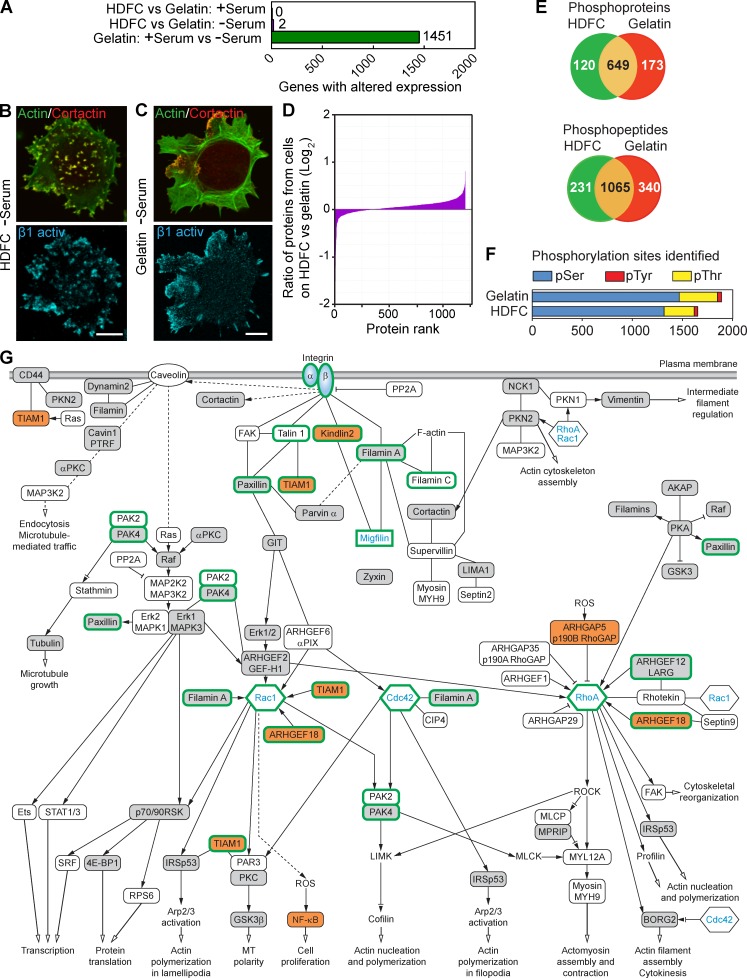
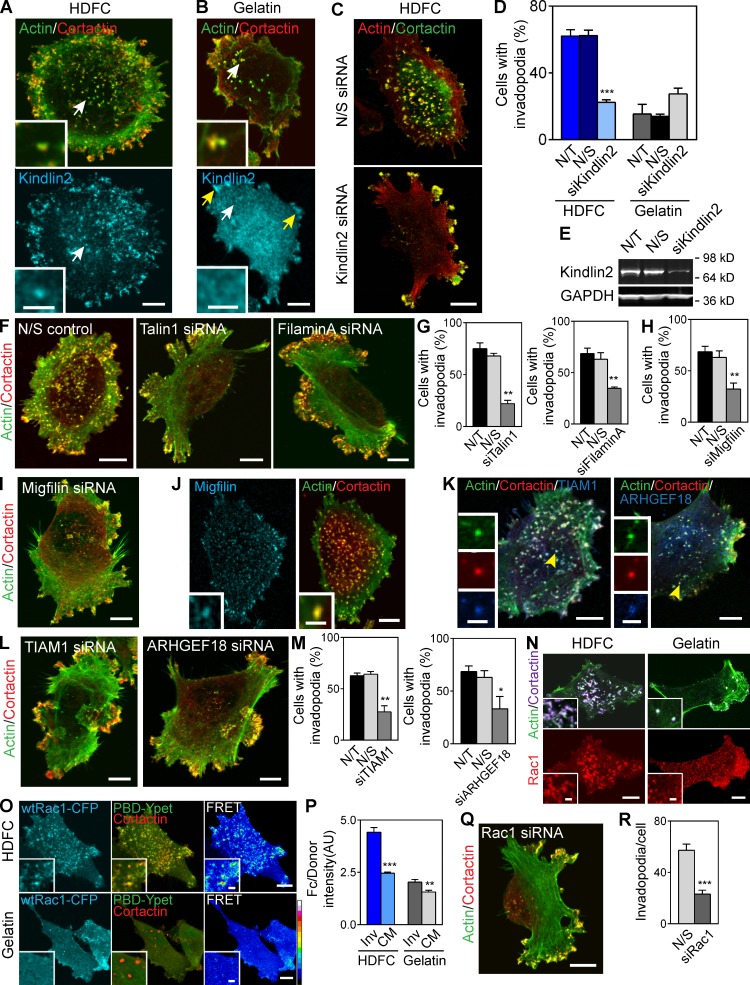
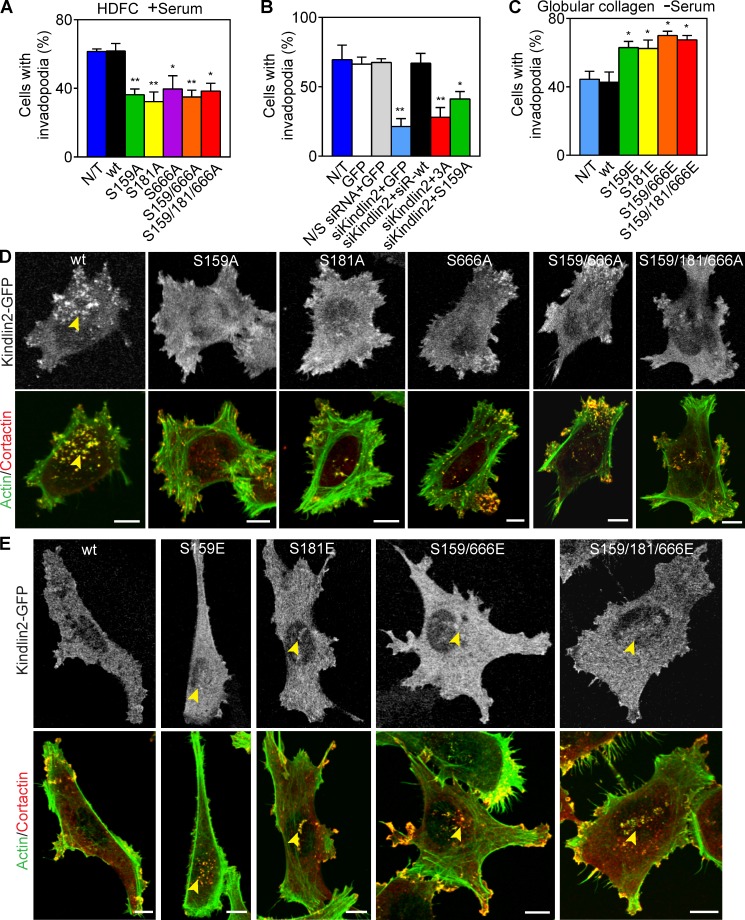
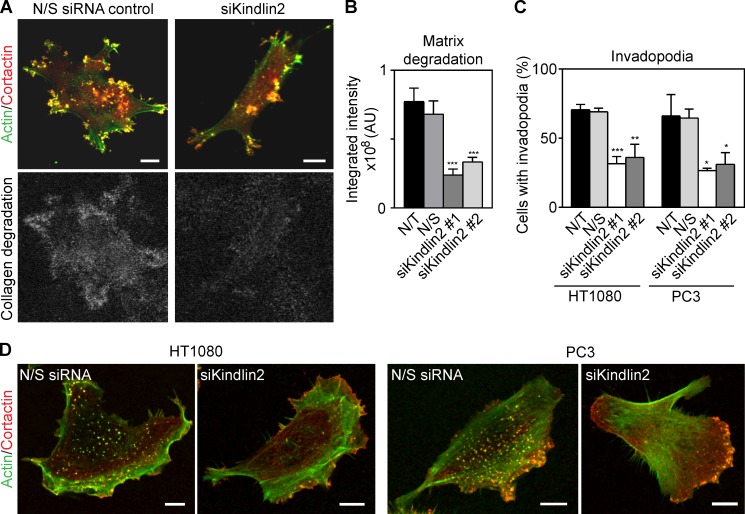
Cell interactions with the extracellular matrix (ECM) can regulate multiple cellular activities and the matrix itself in dynamic, bidirectional processes. One such process is local proteolytic modification of the ECM. Invadopodia of tumor cells are actin-rich proteolytic protrusions that locally degrade matrix molecules and mediate invasion. We report that a novel high-density fibrillar collagen (HDFC) matrix is a potent inducer of invadopodia, both in carcinoma cell lines and in primary human fibroblasts. In carcinoma cells, HDFC matrix induced formation of invadopodia via a specific integrin signaling pathway that did not require growth factors or even altered gene and protein expression. In contrast, phosphoproteomics identified major changes in a complex phosphosignaling network with kindlin2 serine phosphorylation as a key regulatory element. This kindlin2-dependent signal transduction network was required for efficient induction of invadopodia on dense fibrillar collagen and for local degradation of collagen. This novel phosphosignaling mechanism regulates cell surface invadopodia via kindlin2 for local proteolytic remodeling of the ECM.


Figures

Figure 1.
Figure 1.
Potent induction of invadopodia by HDFC. (A) Topography and orthogonal confocal views of HDFC, thin 3D collagen, globular collagen, and gelatin matrices labeled with Alexa Fluor 568F. Confocal z stacks of the matrices were deconvolved using blind deconvolution algorithm set to 10 iterations (AutoDeblur software; Media Cybernetics). (B) Confocal and orthogonal views of MDA-MB-231 carcinoma cell invading HDFC matrix. Invadopodia appear as yellow dots with colocalized actin and cortactin that penetrate into fluorescently labeled HDFC matrix. Inset (red rectangle) shows a magnified orthogonal view of the invadopodia. (C) Endogenous MT1-MMP accumulation at invadopodia of MDA-MB-231 cells on HDFC. Insets (red outlines) show magnified views of the invadopodia. (D) Quantification of total and degradative invadopodia in MDA-MB-231 cells invading HDFC and gelatin matrices. Total invadopodia were identified as aggregates of colocalized actin and cortactin at the cell membrane adherent to the matrix, and degradative invadopodia were actin/cortactin aggregates with colocalized MT1-MMP. Mean number of invadopodia per cell with 19–20 cells analyzed per condition. (E) Proteolytic degradation as indicated by black holes in a layer of fibronectin (FN) bound from serum to HDFC by MDA-MB-231 cells invading the matrix. Degradation is present at invadopodia (actin aggregate). Magnified views of the invadopodia and corresponding area of matrix degradation are shown in the red-framed insets. (F) Immunofluorescence labeling of 1/4 collagen type I fragment. Proteolytic cleavage of fibrillar collagen by MDA-MB-231 cells invading HDFC was readily detected in serum-free medium (gray–white localization). Insets (red boxes) show enlarged views of the invadopodia and localized collagen degradation. (G) Effect of MT1-MMP silencing in MDA-MB-231 cells on HDFC degradation identified by immunofluorescence labeling of cleaved 1/4 collagen type I fragment under cells. Cells were transfected with two different single duplex siRNAs specific to MT1-MMP (MT1-MMP si#1 and si#2). Controls were mock-transfected (not transfected [N/T]) or transfected with nonspecific control siRNA (N/S). Mean ± SEM from each of 100–106 cells from each of three independent experiments. ***, P < 0.0001. (H) Confocal images of MDA-MB-231 cells invading HDFC and 2D gelatin matrices. (I) Quantification of invadopodia in parental and c-Src–expressing MDA-MB-231 cells invading HDFC or gelatin matrices. Means ± SEM from each of 12–15 cells. wt, wild type. (J) Immunostaining of MDA-MB-231 carcinoma cells invading HDFC matrix in medium with or without serum. (K) Quantification of invadopodia formation in MDA-MB-231 cells invading HDFC or gelatin in media with or without serum. Means ± SEM of 80–130 cells from each of three independent experiments. **, P < 0.001. (L) Confocal images of primary HFFs invading HDFC matrix in the presence or absence of serum. (M) Quantification of results from L showing the number of invadopodia-forming HFFs plated on HDFC matrix in the presence or absence of serum in culture medium. Means ± SEM from each of 90–100 cells from each of three independent experiments. (N) Confocal images of the HFF invadopodia and associated HDFC degradation as detected by immunofluorescence of 1/4 collagen type I fragments. Bars: (A–C [main images], E and F [main images], H, I, and N) 10 µm; (C and F, insets) 3 µm; (E, insets) 2 µm; (L) 20 µm.
Figure 2.
Figure 2.
HDFC mimics tumor desmoplastic collagen. (A) Maximum-intensity projections of immunofluorescence confocal images of MDA-MB-231 cells invading HDFC, cell-derived fibrillar fibronectin matrix (CDM), or thin 3D layers of fibrillar collagen type I polymerized at low versus high concentrations. Invadopodia are yellow dots of overlaid cortactin and actin staining. (B) Quantification of results from A showing invadopodia per MDA-MB-231 cell invading HDFC, CDM, flattened 2D CDM, or thin 3D fibrillar collagen matrices at the specified concentrations. Means ± SEM of each of 10–30 cells/condition from three independent experiments. (C) Masson’s trichrome staining of acellular ECM from normal and tumor breast sections visualizing collagen in blue. (D) Immunostaining of MDA-MB-231 cells invading acellular normal and tumor breast ECM immunolabeled for collagen type I. Invadopodia are yellow dots with colocalized actin and cortactin. (E) Invadopodial response of MDA-MB-231 cells plated on acellular normal or malignant breast ECM. The values (red bars) are mean ± SEM of total invadopodia in each of 68 cells from three independent repeat experiments for each condition. (F) Topography of desmoplastic collagen immunostained for collagen type I. (G) Quantification of invadopodia in cells invading nontreated or chemically cross-linked (4% paraformaldehyde) HDFC matrix. Mean ± SEM of each of 100–111 cells/condition from three independent experiments. (H) Immunostaining of invadopodia in MDA-MB-231 cells invading nontreated or cross-linked HDFC. Invadopodia are yellow dots of colocalized invadopodial markers, actin, and cortactin. (I) Quantification of invadopodia in MDA-MB-231 cells invading nontreated and cross-linked HDFC as in H. Means ± SEM of 19–20 cells/condition. ***, P < 0.0001. Bars: (A, D, F, and H) 10 µm; (C) 300 µm.
Figure 3.
Figure 3.
α2β1 integrin is the receptor for HDFC and is a potent inducer of invadopodia. (A) Effect of specific integrin inhibition on invadopodia formation in MDA-MB-231 cells invading HDFC in serum-containing medium. Means ± SEM from 100–150 cells for each condition with three independent repeats. N/S, nonspecific. (B) Effect of integrin inhibition by mAbs on invadopodia formation in MDA-MB-231 cells invading HDFC in serum-free medium. Means ± SEM of 100 cells/condition with three repeats. (C) Effect of specific integrin inhibition on invadopodia formation in MDA-MB-231 cells invading 2D gelatin in the presence of serum. The values are mean number of cells with ECM-degrading invadopodia ± SEM of 100–150 cells/condition, with three independent repeats. (D) Representative images for integrin inhibitory experiments of MDA-MB-231 cells invading HDFC in the presence of serum in A. (E) Representative images for integrin inhibitory studies in C. (F) Immunostaining of fibronectin (green) bound to the gelatin matrix with or without serum in the medium. (G) Effect of fibronectin-coated gelatin matrix on invadopodia induction in c-Src–expressing MDA-MB-231 cells. Serum-starved cells were plated on the fibronectin-coated gelatin in the presence or absence of serum or with 5 nM EGF. Means ± SEM of 90–100 cells per condition with three independent experiments. (H) Percentage of MDA-MB-231 cells with invadopodia after adhesion to antibody-coated substrates targeting individual integrin subunits. Means ± SEM of ∼100 cells per condition with three experiments each, comparing antibodies at 10 µg (dark bar) or 200 µg (light bar) per 14-mm-diameter coverslip. (I) Representative micrographs of invadopodia formation by MDA-MB-231 carcinoma cells induced by adhesion to antibody-coated substrates targeting individual integrin subunits as in H. Invadopodia are yellow dots of colocalized actin and cortactin immunostaining. *, P < 0.05; **, P < 0.001; ***, P < 0.0001. Bars, 10 µm.
Figure 4.
Figure 4.
Phosphoproteomics analysis of cells invading HDFC matrix reveals complex downstream signaling. (A) Comparison of whole-genome microarray expression profiles for MDA-MB-231 cells with or without serum, or invading gelatin versus HDFC matrices, based on data pooled from five independent experiments for each condition. (B) Localization of activated β1 integrin to invadopodia of the MDA-MB-231 adherent to HDFC at the absence of serum. Invadopodia are yellow dots with colocalized actin and cortactin. (C) Localization of activated β1 integrin to FAs of MDA-MB-231 cells adherent to gelatin matrix in the absence of serum, showing poor invadopodia formation. (D) Comparative analysis of protein expression levels in MDA-MB-231 cells on HDFC versus cells on gelatin at the absence of serum. Cell lysates from each sample were labeled with specific iTRAQ labels to compare amounts of each protein (protein rank) identified by MS between HDFC and gelatin samples. (E) Numbers of unique and shared phosphoproteins and phosphopeptides in MDA-MB-231 carcinoma cells invading HDFC (green) compared with 2D gelatin (red) matrices in serum-free medium as identified by phosphoproteomics. (F) Quantification of types of phosphorylation sites identified by phosphoproteomics analysis. (G) Proposed signaling network associated with integrin-dependent induction of abundant invadopodia in carcinoma cells invading HDFC matrix. All identified phosphoproteins and their phosphosites are listed in Table S1. Open boxes indicate phosphoproteins identified in both HDFC and gelatin samples with the same phosphorylation sites by comparison of phosphopeptides. Gray boxes denote phosphoproteins identified in HDFC versus gelatin samples with different phosphorylation sites. Orange boxes indicate phosphoproteins unique to the HDFC matrix. Proteins without phosphorylation changes, such as Rac1, Cdc42, RhoA, and αβ integrin, are added to clarify the signaling context of proteins identified by phosphoproteomics. Although not regulated by phosphorylation, migfilin is depicted in the network because it is known to bind directly to both kindlin2 and filamin A. Migfilin and the other proteins highlighted by thick green outlines were verified experimentally in this study to play a role in invadopodia regulation by siRNA knockdown. Solid lines indicate known direct physical binding between proteins. Dashed lines indicate indirect interactions involving intermediate partners. Black arrows at the ends of lines indicate proteins known to stimulate the downstream signaling partner, lines with inhibition symbol indicate down-regulation of activity of the downstream signaling partner, lines with an inhibition symbol plus a black arrow indicate both potential activation and inhibition, and open arrows denote stimulation of the cellular process. Abbreviations used in this figure: ROCK, Rho-associated protein kinase; MLCP, myosin light-chain phosphatase; MLCK, myosin light-chain kinase; MPRIP, myosin phosphatase Rho-interacting protein; ROS, reactive oxygen species; SRF, serum response factor; AKAP, A kinase anchor protein. Bars, 10 µm.
Figure 5.
Figure 5.
Complex signaling network of multiple proteins regulating invadopodia formation on HDFC. (A) Immunostaining of endogenous kindlin2 in MDA-MB-231 cells invading HDFC reveals kindlin2 localization to invadopodia (white arrow and inset). (B) Immunostaining of endogenous kindlin2 in carcinoma cells adherent to gelatin demonstrates kindlin2 accumulation in FAs (yellow arrows) but not in invadopodia (white arrow and insert). (C) Representative images of carcinoma cells invading HDFC after transfection with nonspecific control (N/S) or kindlin2-specific siRNA pools. (D) Effect of knockdown with kindlin2-specific siRNA pool (siKindlin2) on invadopodia formation in MDA-MB-231 cells invading HDFC or gelatin matrices. Control conditions are mock transfection (not transfected [N/T]) or transfection with nonspecific siRNA control pool (N/S). Mean ± SEM of 100 cells/condition with three independent experiments. (E) Representative Western blot of kindlin2 knockdown in MDA-MB-231 cells in D. (F) Representative images of MDA-MB-231 cells transfected with nonspecific control or talin1-, filamin A–specific siRNA pools invading HDFC. (G) Effect of siRNA depletion of talin 1 or filamin A on invadopodia formation in carcinoma cells invading HDFC. Means ± SEM of 100 cells/condition with three independent experiments. (H) Effect of siRNA depletion of migfilin on invadopodia formation in carcinoma cells invading HDFC. Means ± SEM of 100 cells/condition with three independent experiments. (I) Representative images of HDFC-invading MDA-MB-231 cells transfected with migfilin-specific siRNA. (J) Immunostaining of endogenous migfilin in MDA-MB-231 cells localizes migfilin to actin/cortactin-rich invadopodia in cells invading HDFC. Insets show magnified views of invadopodia. (K) Immunofluorescence of endogenous TIAM1 and ARHGEF18 demonstrates localization of both GEFs to invadopodia of carcinoma cells induced by HDFC. Insets show enlarged views of invadopodia. (L) Representative images of TIAM1 and ARHGEF18 knockdown in MDA-MB-231 cells incubated on HDFC matrix. (M) Quantitation of effects of TIAM1 and ARHGEF18 depletion on invadopodia formation in carcinoma cells on HDFC. Means ± SEM of 100 cells/condition with three independent experiments. (N) Immunofluorescence of endogenous Rac1 in MDA-MB-231 carcinoma cells invading HDFC or gelatin. Insets zoom in on individual invadopodia. (O) Rac1 activation status at invadopodia induced by HDFC or gelatin visualized with Rac1 biosensor. Color palette depicts FRET efficiency from low (black) to high (white). Insets show high FRET signal on individual invadopodia induced by HDFC. wt, wild type. (P) Efficiencies of Rac1-CFP/PBD-YPet FRET at invadopodia (Inv) and adjacent cell membrane (CM) in carcinoma cells on HDFC or gelatin. Means ± SEM of 30–36 cells analyzed per condition. AU, arbitrary unit. (Q) Representative micrograph of Rac1-depleted MDA-MB-231 cells on HDFC. (R) Quantitation of Rac1 knockdown on invadopodia formation from Q. The values indicate the mean number of invadopodia per cell ± SEM based on 10 cells/condition. *, P < 0.05; **, P < 0.001; ***, P < 0.0001. Bars: (A and B [main images], C, F, and J and K [main images], L, N and O [main images], and Q) 10 µm; (A and B, insets) 3 µm; (J, K, N, and O, insets) 2 µm.
Figure 6.
Figure 6.
Kindlin2 function in invadopodia formation is regulated by phosphorylation. (A) Effect of expressing dominant-negative phosphomutants of kindlin2 on invadopodia formation in MDA-MB-231 cells invading HDFC in the presence of serum. Means ± SEM of 100 cells/condition with 3–4 independent repeats. (B) Quantification of the effects of kindlin2 knockdown with single duplex siRNA and rescue with siRNA-resistant wild-type kindlin2 (siR-wt) or its mutants S159/181/666A (3A) and S159A on invadopodia formation in MDA-MB-231 cells invading HDFC. Values are means ± SEM of ∼100 cells/condition with three repeats. (C) Effect of expression of kindlin2 phosphomimetic mutants on invadopodia formation in carcinoma cells on globular collagen with no serum. Means ± SEM of 100 cells/condition with 3–4 repeats. (D) Effect of kindlin2-GFP dominant-negative mutants on invadopodia formation in MDA-MB-231 cells invading the HDFC matrix. Cells were cultured on HDFC for 3 h, fixed, and immunolabeled for actin and cortactin to identify invadopodia as actin–cortactin rich aggregates. The yellow arrowhead points to high numbers of invadopodia associated with the cell body. (E) Effect of kindlin2-GFP phosphomimetic mutants on invadopodia formation in MDA-MB-231 cells invading globular collagen matrix at the absence of serum. Cells were cultured on collagen for 3 h, fixed, and immunolabeled for actin and cortactin to identify invadopodia as actin–cortactin-rich aggregates. Yellow arrowheads indicate invadopodia on the cell body. N/T, not transfected; N/S, nonspecific; wt, wild type. *, P < 0.05; **, P < 0.001. Bars, 10 µm.
Figure 7.
Figure 7.
Kindlin2 is required for invadopodia-mediated degradation of dense collagen. (A) Depletion of kindlin2 using kindlin2-specific single duplex siRNA inhibits degradation of HDFC collagen visualized by immunofluorescence of 1/4 collagen type I fragments. (B) Quantification of effect of kindlin2 depletion by single duplex siRNA on matrix degradation in A. Values are means ± SEM of ∼20 cells. AU, arbitrary unit. (C) Effect of kindlin2 knockdown on invadopodia formation in HT-1080 breast adenocarcinoma and PC3 prostate carcinoma cells. Values are means ± SEM of ∼100 cells/condition with three repeats. (D) Representative images after kindlin2 depletion in HT-1080 and PC3 cells. N/S, nonspecific; N/T, not transfected. *, P < 0.05; **, P < 0.001; ***, P < 0.0001. Bars, 10 µm.

Similar articles

Cited by

References

    1. Alexander N.R., Branch K.M., Parekh A., Clark E.S., Iwueke I.C., Guelcher S.A., and Weaver A.M.. 2008. Extracellular matrix rigidity promotes invadopodia activity. Curr. Biol. 18:1295–1299 10.1016/j.cub.2008.07.090 - DOI - PMC - PubMed
    1. Artym V.V., and Matsumoto K.. 2010. Imaging cells in three-dimensional collagen matrix. Curr. Protoc. Cell Biol. Chapter 10:Unit 1–20. - PMC - PubMed
    1. Artym V.V., Zhang Y., Seillier-Moiseiwitsch F., Yamada K.M., and Mueller S.C.. 2006. Dynamic interactions of cortactin and membrane type 1 matrix metalloproteinase at invadopodia: defining the stages of invadopodia formation and function. Cancer Res. 66:3034–3043 10.1158/0008-5472.CAN-05-2177 - DOI - PubMed
    1. Artym V.V., Yamada K.M., and Mueller S.C.. 2009. ECM degradation assays for analyzing local cell invasion. Methods Mol. Biol. 522:211–219 10.1007/978-1-59745-413-1_15 - DOI - PubMed
    1. Beaty B.T., Sharma V.P., Bravo-Cordero J.J., Simpson M.A., Eddy R.J., Koleske A.J., and Condeelis J.. 2013. β1 integrin regulates Arg to promote invadopodial maturation and matrix degradation. Mol. Biol. Cell. 24:1661–1675: S1–S11 10.1091/mbc.E12-12-0908 - DOI - PMC - PubMed

Publication types

Associated data