. 2015 Feb 9;212(2):217-33.
doi: 10.1084/jem.20141432. Epub 2015 Feb 2.

ICOS maintains the T follicular helper cell phenotype by down-regulating Krüppel-like factor 2

Affiliations

ICOS maintains the T follicular helper cell phenotype by down-regulating Krüppel-like factor 2

Jan P Weber et al. J Exp Med. .

Abstract

The co-stimulators ICOS (inducible T cell co-stimulator) and CD28 are both important for T follicular helper (TFH) cells, yet their individual contributions are unclear. Here, we show that each molecule plays an exclusive role at different stages of TFH cell development. While CD28 regulated early expression of the master transcription factor Bcl-6, ICOS co-stimulation was essential to maintain the phenotype by regulating the novel TFH transcription factor Klf2 via Foxo1. Klf2 directly binds to Cxcr5, Ccr7, Psgl-1, and S1pr1, and low levels of Klf2 were essential to maintain this typical TFH homing receptor pattern. Blocking ICOS resulted in relocation of fully developed TFH cells back to the T cell zone and reversion of their phenotype to non-TFH effector cells, which ultimately resulted in breakdown of the germinal center response. Our study describes for the first time the exclusive role of ICOS and its downstream signaling in the maintenance of TFH cells by controlling their anatomical localization in the B cell follicle.


Figures

Figure 1.
Figure 1.
CD28 and ICOS are both important for the generation of a TFH cell population on day 8. WT (Thy-1.1+ 1.2+, black) and CD28 KO (Thy-1.1+, blue) or WT and ICOS KO (Thy-1.1+, red) OT-II T cells were co-transferred together with B1-8i B cells into C57BL/6 recipients (Thy-1.2+). Recipients were subcutaneously immunized with NP-OVA on the following day and draining lymph nodes were analyzed on day 8 after immunization by flow cytometry. (A) Representative contour plots (gated on CD4+ T cells) showing the expansion of WT and KO T cells (indicated as percentage ± SD of all CD4+ T cells). (B) Gated OT-II T cells were analyzed for a TFH phenotype defined by expression of CXCR5 and PD-1. Representative contour plots and graphs showing frequency and absolute numbers of TFH cells with dots representing individual mice and bars indicating the mean. Data are representative of four independent experiments with six animals per group. ***, P < 0.001.
Figure 2.
Figure 2.
CD28 but not ICOS regulates early key events of TFH cell differentiation. WT (black) and CD28 KO (blue) or ICOS KO (red) OT-II cells were either co-transferred (A and B) or transferred separately (C and D) into C57BL/6 recipients subcutaneously immunized with NP-OVA. Draining lymph nodes were analyzed on day 3 after immunization. (A) Expression of Bcl-6, CXCR5, and CCR7 analyzed by flow cytometry and displayed as representative histograms and as bar graph with the geometric mean fluorescence intensity (geoMFI). Endogenous CD4+ T cells are shown in gray. Dots represent individual mice and bars indicate the mean. (B) Expression of CD40L was evaluated ex vivo by intracellular staining without restimulation and IL-21 and IL-4 were assessed after short-term restimulation with OVA peptide. Representative flow cytometry data and geoMFI or percentage of positive cells are shown. (C) WT or KO OT-II T cells were sorted from draining lymph nodes (pool from 20 animals) by magnetic and flow sorting for Thy-1.1+ cells for the preparation of RNA. Expression of Ascl2, c-Maf, Prdm1, Tbx21, and Gata3 mRNA was measured by quantitative RT-PCR (expression relative to Hprt; mean ± SEM from triplicates and two independent experiments). (D) Representative histological pictures of draining lymph nodes showing the T cell zone (CD4+, green), B cell follicle (B220+, magenta), and antigen-specific T cells (Thy-1.1+, white). The yellow dashed line demarcates the border between the T cell zone and the B cell follicle. Bars, 100 µm. Representative data from two (mRNA, cytokines, and histology) or four (all other) experiments. **, P < 0.01; ***, P < 0.001.
Figure 3.
Figure 3.
ICOS but not CD28 is important for maintenance of TFH cells. (A and B) Thy-1.1+ OT-II T cells were transferred into C57BL/6 recipients that were immunized subcutaneously with NP-OVA on the following day. Starting from day 6 (A) or day 7 (B) after immunization, CD28 or ICOS signaling was blocked using CTLA-4–Ig or anti–ICOS-L antibody, respectively. OT-II T cells from draining lymph nodes were analyzed by flow cytometry on day 8 after immunization. (A) Expression of CXCR5/PD-1 or Bcl-6/PD-1 on OT-II T cells is shown as representative contour plots and bar graphs indicating the percentage of cells with a TFH phenotype. (B) Apoptosis of OT-II TFH (CXCR5+ PD-1+) or non-TFH (CXCR5 PD-1) CD4+ T cells was analyzed by staining for active caspase-3. Results are shown as representative dot plots and bar graphs. (C) Antigen-specific TFH cells were sorted on day 7 according to CXCR5 and PD-1 expression and transferred into secondary hosts which had been immunized 7 d before. ICOS-L was blocked for 48 h before analysis of draining lymph nodes by flow cytometry. Frequency of TFH cells and total OT-II T cells was assessed. Results are representative for eight (ICOS-L blockade), three (B7 blockade), or two (apoptosis, TFH retransfer) independent experiments with six to eight animals per group. Dots represent individual mice and bars indicate the mean. ***, P < 0.001.
Figure 4.
Figure 4.
Late ICOS-L blockade results in collapse of an established GC response. OT-II T cells and B1-8i B cells were co-transferred into C57BL/6 recipients immunized subcutaneously with NP-OVA. ICOS-L or B7 blockade was started on day 6 after immunization. (A) Draining lymph nodes were analyzed by flow cytometry on day 10 for antigen-specific GC B cells (CD45.1+ PNA+ GL7+). Representative flow cytometry plots and bar graphs indicating the frequency of GC B cells are shown. (B) Serum levels of NP-specific IgG1 and IgG2a were analyzed on day 13 by ELISA. (C) Histological analysis of draining lymph nodes on day 10. The T cell zone (CD4+) is shown in green, B cell zone (B220+) in magenta, and OT-II T cells (Thy-1.1+) in white. The yellow dashed lines demarcate the border between the T cell zone and the B cell follicle. Bars, 200 µm. Bar graphs show the frequency of transgenic T cells in the B cell area by analyzing whole lymph node sections from 6 different depths of the lymph node. Representative result from three (A) or two (B) independent experiments with five to six animals per group and (C) pooled data from two independent experiments with four animals per group. Dots represent individual mice, bars indicate the mean and error bars the SEM. ***, P < 0.001.
Figure 5.
Figure 5.
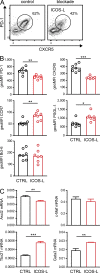
Interruption of ICOS signaling results in rapid reversion of the TFH phenotype. OT-II T cells were transferred into C57BL/6 recipients, which were immunized subcutaneously with NP-OVA on the following day. On day 7 after immunization, recipients were treated with anti–ICOS-L or control antibody (CTRL). (A) Antigen-specific Thy-1.1+ CXCR5+ PD-1+ cells were analyzed by flow cytometry after 20 h of blockade. (B) Expression of CCR7, PSGL-1, and Bcl-6 on gated TFH cells is shown as geoMFI; each dot represents an individual animal and bars indicate the mean. Representative experiment out of three, with seven animals per group. (C) Antigen-specific TFH cells (Thy-1.1+ CXCR5+ PD-1+; draining lymph nodes pooled from 20 animals) were sorted 6 h after blockade for preparation of RNA. Expression of c-Maf, Ascl2, Gata3, and Tbx21 was measured by quantitative RT-PCR. Shown is the mean (± SEM) expression relative to β2-microglobulin from two independent experiments with three technical replicates each. *, P < 0.05; **, P < 0.01; ***, P < 0.001.
Figure 6.
Figure 6.
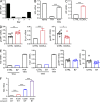
ICOS down-regulates Klf2 to maintain TFH cell homing markers. (A) OT-II splenocytes were stimulated in vitro with OVA323-339 peptide. T cells were sorted from cultures at the indicated times and Klf2 mRNA was quantified by RT-PCR. (B) Recipients of Thy-1.1+ OT-II T cells were immunized with cognate antigen and antigen-specific Thy-1.1+ CXCR5/PD-1 double-positive (TFH) or double-negative cells (non-TFH) were sorted from draining lymph nodes on day 8. Klf2 expression was analyzed by quantitative RT-PCR. For comparison, Klf2 expression in naive OT-II T cells is shown. (C–E) Thy-1.1+ OT-II T cells were transferred into C57BL/6 recipients immunized subcutaneously with NP-OVA. On day 7 after immunization, recipients were treated with anti–ICOS-L, CTLA-4–Ig, or control reagents (CTRL). Antigen-specific TFH cells (Thy-1.1+ CXCR5+ PD-1+) from draining lymph nodes were sorted for preparation of RNA 6 h after blockade and analyzed by flow cytometry 20 h after blockade, respectively. (C) Klf2 expression analyzed by quantitative RT-PCR after ICOS-L blockade. (D) CD62L and CD69 expression analyzed by flow cytometry (MFI) and S1pr1 expression analyzed by quantitative RT-PCR after ICOS-L blockade. (E) Expression of Klf2 and S1pr1 by RT-PCR and CD62L and CD69 by flow cytometry after CTLA-4–Ig blockade. All quantitative RT-PCR data are mean values (± SEM) from three experiments with three technical replicates each and β2-microglobulin as housekeeping gene. Flow cytometry data are a representative result from three (ICOS-L blockade) or two (B7 blockade) independent experiments with seven animals per group. (F) WT, ICOS KO, or CD28 KO OT-II T cells were transferred into C57BL/6 recipients or ICOS KO OT-II T cells were transferred into CD80/86 (B7) KO recipients. Transgenic T cells were sorted from pools of draining lymph nodes 3 d after immunization with NP-OVA. Klf2 mRNA was quantified by RT-PCR (expression relative to Hprt; mean ± SEM from triplicates and two independent experiments). Dots represent individual mice, bars indicate the mean, and error bars represent the SEM. *, P < 0.05; **, P < 0.01; ***, P < 0.001.
Figure 7.
Figure 7.
Analysis of human tonsillar TFH cells for ICOS-regulated genes. (A) CD3+ CD4+ T cell populations from human tonsils were defined based on differential expression of CXCR5 and ICOS (negative, low, and high). Expression of PD-1, CCR7, PSGL-1, CD62L, and CD69 on these different populations was analyzed by flow cytometry. Expression of Klf2 and S1pr1 was assessed in sorted populations by quantitative RT-PCR (bar graphs showing expression relative to Hprt; mean ± SEM from triplicates). (B) Tonsillar mononuclear cells were cultured in the presence of staphylococcal enterotoxin B (SEB) and blocking antibody against ICOS-L or isotype control. After 6 h, CXCR5+ ICOS+ CD4+ T cells were sorted and expression of Klf2, S1pr1, Cxcr5, Sell (endcoding CD62L), Bcl-6, and Ascl2 mRNA was analyzed by quantitative RT-PCR (expression relative to Hprt; mean ± SEM from triplicates). One representative experiment out of two is shown. *, P < 0.05, **, P < 0.01; ***, P < 0.001.
Figure 8.
Figure 8.
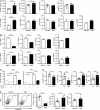
Overexpression identifies Klf2 as a novel repressor of TFH cell differentiation. (A) OT-II T cells were retrovirally transduced with Klf2 cDNA or an empty control vector encoding GFP only. 24 h after infection, the expression of CD62L, CD44, OX-40, and 4-1BB on Thy-1.1+ GFP+ cells was analyzed by flow cytometry in vitro (representative results from two independent experiments with quadruplicate wells). In addition, GFP+ cells were sorted and expression of S1pr1, Bcl-6, c-Maf, Prdm1, and Ascl2 was measured by quantitative RT-PCR (relative to β2-microglobulin; mean ± SEM of two independent experiments with three technical replicates each). (B) OT-II x CreERT2 x Klf2wt/wt or Klf2fl/fl splenocytes were stimulated with OVA peptide in the presence of tamoxifen (TMX). T cells were sorted after 24 h and analyzed by quantitative RT-PCR (relative to Hprt; mean ± SEM of two independent experiments with three technical replicates each) for expression of Klf2, S1pr1, Bcl-6, Prdm1, Tbx21, Gata3, c-Maf, and Ascl2. (C) OT-II T cells were retrovirally transfected with plasmids encoding Ascl2 (hu CD4 as reporter) and Klf2 (GFP reporter) or empty vector controls. After 20 and 44 h, expression of CXCR5 was analyzed by flow cytometry. Representative experiment out of two with quadruplicates. (D and E) OT-II T cells were retrovirally transduced with Klf2 cDNA or control vector and transferred into C57BL/6 recipient mice immunized on the same day with NP-OVA. After 42 h (D) or 6 d (E), antigen-specific GFP+ CD4+ T cells were analyzed for the TFH phenotype by flow cytometry. Representative contour plots for CXCR5/PD-1 expression on day 6 and bar graphs with expression of PD-1, CXCR5, PSGL-1, and CD62L are shown. Representative experiment out of three with six to seven animals per group. *, P < 0.05; **, P < 0.01; ***, P < 0.001.
Figure 9.
Figure 9.
Induced overexpression of Klf2 results in loss of TFH cells and termination of the GC response. (A and B) Thy-1.1+ OT-II x CreERT2 T cells were transduced with either an empty (control) retroviral vector or a vector containing a loxP-flanked dsRed stop cassette in front of the Klf2 coding region, preventing expression until the cassette is removed by (tamoxifen-induced) Cre-mediated excision. After a 20-h in vitro culture, dsRed-expressing cells were sorted and transferred together with NP-specific CD45.1+ B1-8i B cells into B6 WT (A) or B6 CD28 KO (B) recipients (to exclude effects from endogenous TFH cells). Recipients were immunized with NP-OVA on the same day. Four days later, Klf2 overexpression was induced by tamoxifen (TMX)-mediated excision of the dsRed cassette. (A) Flow cytometric analysis of OT-II T cells (Thy-1.1+) for expression of CXCR5, PD-1, PSGL-1, and CD62L on day 6. Shown are representative plots for PD-1/CXCR5 expression and bar graphs indicating percentage of PD-1+ CXCR5+ OT-II cells and geoMFI expression of PSGL-1 and CD62L. (B) Analysis of antigen-specific (CD45.1+) B cells on day 8. Representative plots for transgenic (CD45.1+) B cells with a GC phenotype (PNA+ GL7+) and bar graphs indicating the absolute number of GC B cells are shown. (C) OT-II x CreERT2 x Klf2fl/fl T cells were transferred into B6 mice subsequently immunized with NP-OVA. On day 4 after immunization, Klf2 knockdown was induced by tamoxifen. On day 6 and 7, ICOS-L was blocked using a monoclonal antibody. OT-II T cells from draining lymph nodes were analyzed on day 8 for expression of PD-1/CXCR5, CD62L, CCR7, and PSGL-1. Dots represent individual mice and bars indicate the mean. Representative experiments out of two, with five to seven animals per group. *, P < 0.05; **, P < 0.01; ***, P < 0.001.
Figure 10.
Figure 10.
Klf2 is regulated via Foxo1 and directly binds to Cxcr5, Selplg, and Ccr7. (A– C) Naive CD4+ T cells were stimulated in vitro for 24 h with plate-bound antibodies against CD3 in combination with anti-CD28, anti-ICOS, or an isotype control. (A) Klf2 mRNA was quantified by RT-PCR (expression relative to Hprt; mean ± SEM from triplicates and 4 independent experiments). (B) Foxo1 phosphorylation was analyzed by intracellular staining with antibodies against total Foxo1 and phosphorylated (Ser 265) Foxo1. As controls, cells were stimulated for 2 h with PMA and ionomycin or left unstimulated. (C) Nuclear/cytoplasmic translocation of Foxo1 was directly assessed by ImageStream flow cytometry. (D) Schematic representations of putative Klf2 binding sites (arrow heads) in the genes for Ccr7, S1pr1, Selplg (encoding PSGL-1), and Cxcr5 (last two diagrams). Coding regions are in blue, PCR products are indicated by red lines. Genomic regions highly conserved between human and mouse (gray histograms showing the degree of conservation) were analyzed by rVista. (E) OT-II T cells were retrovirally transfected with Klf2 containing or not containing a FLAG-tag. For both constructs, ChIP was performed with an anti-FLAG or an isotype control antibody. Putative Klf2-binding sites in the S1pr1, Cxcr5, Selplg (encoding PSGL-1), and Ccr7 genes were analyzed by quantitative RT-PCR. Necdin, which has been shown to contain no Klf2-binding sites, served as a negative control. The enrichment of Klf2-binding sites was normalized against the isotype control and is shown in comparison to the non-FLAG construct. Pooled data from 4 independent experiments, mean enrichment ± SEM. (F) HEK cells were transfected with a luciferase expression plasmid containing the Klf2-binding site from the Cxcr5 promotor in front of a SV40 minimal promotor together with a Klf2 expression plasmid or empty control plasmid. After 24 h, firefly luciferase activity (relative to renilla luciferase) was determined. Pooled data from two independent experiments, with quadruplicates. *, P < 0.05; **, P < 0.01; ***, P < 0.001.

References

    1. Akiba H., Takeda K., Kojima Y., Usui Y., Harada N., Yamazaki T., Ma J., Tezuka K., Yagita H., and Okumura K.. 2005. The role of ICOS in the CXCR5+ follicular B helper T cell maintenance in vivo. J. Immunol. 175:2340–2348 10.4049/jimmunol.175.4.2340 - DOI - PubMed
    1. Alhashem Y.N., Vinjamur D.S., Basu M., Klingmüller U., Gaensler K.M., and Lloyd J.A.. 2011. Transcription factors KLF1 and KLF2 positively regulate embryonic and fetal beta-globin genes through direct promoter binding. J. Biol. Chem. 286:24819–24827 10.1074/jbc.M111.247536 - DOI - PMC - PubMed
    1. Bai A., Hu H., Yeung M., and Chen J.. 2007. Kruppel-like factor 2 controls T cell trafficking by activating L-selectin (CD62L) and sphingosine-1-phosphate receptor 1 transcription. J. Immunol. 178:7632–7639 10.4049/jimmunol.178.12.7632 - DOI - PubMed
    1. Baumjohann D., Preite S., Reboldi A., Ronchi F., Ansel K.M., Lanzavecchia A., and Sallusto F.. 2013. Persistent antigen and germinal center B cells sustain T follicular helper cell responses and phenotype. Immunity. 38:596–605 10.1016/j.immuni.2012.11.020 - DOI - PubMed
    1. Bauquet A.T., Jin H., Paterson A.M., Mitsdoerffer M., Ho I.C., Sharpe A.H., and Kuchroo V.K.. 2009. The costimulatory molecule ICOS regulates the expression of c-Maf and IL-21 in the development of follicular T helper cells and TH-17 cells. Nat. Immunol. 10:167–175 10.1038/ni.1690 - DOI - PMC - PubMed

Publication types

MeSH terms