. 2015 Jul;98(1):5-14.
doi: 10.1189/jlb.4HI0714-338RR. Epub 2015 Feb 2.

SAMHD1's protein expression profile in humans

Affiliations

SAMHD1's protein expression profile in humans

Sarah Schmidt et al. J Leukoc Biol. 2015 Jul.

Abstract

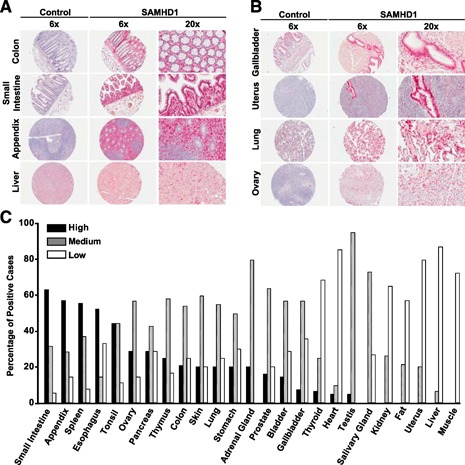
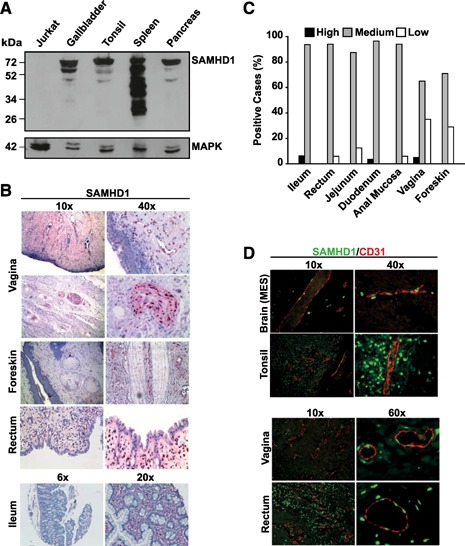
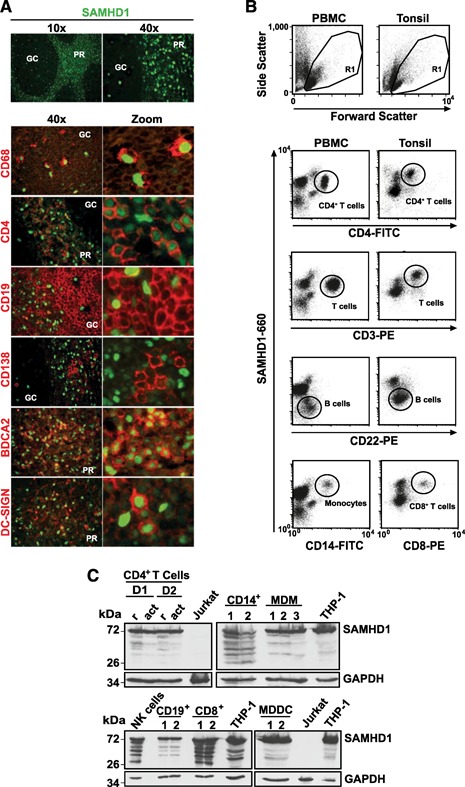
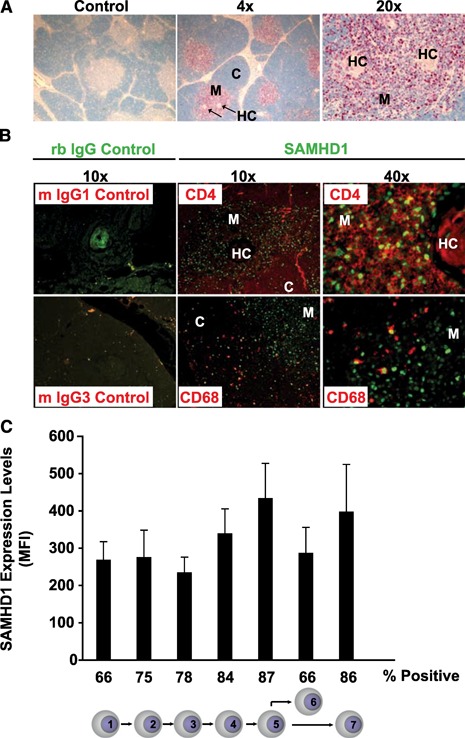
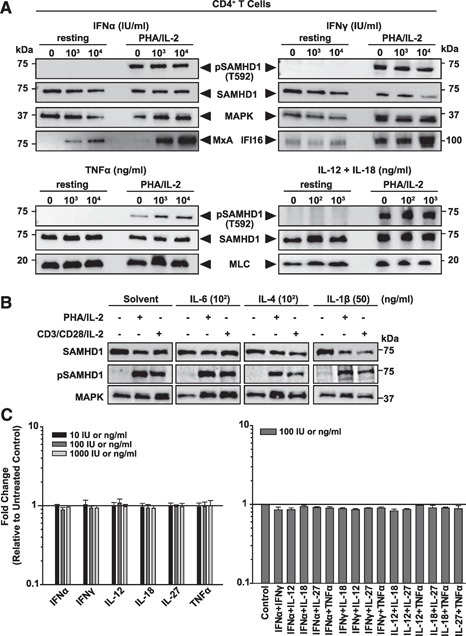
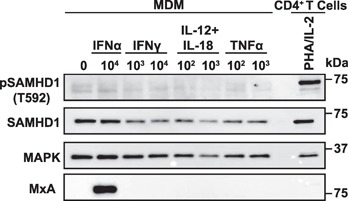
The deoxynucleoside triphosphate triphosphohydrolase and 3' → 5' exonuclease SAMHD1 restricts HIV-1 infection in noncycling hematopoietic cells in vitro, and SAMHD1 mutations are associated with AGS. Little is known about the in vivo expression and functional regulation of this cellular factor. Here, we first assessed the SAMHD1 protein expression profile on a microarray of 25 human tissues from >210 donors and in purified primary cell populations. In vivo, SAMHD1 was expressed in the majority of nucleated cells of hematopoietic origin, including tissue-resident macrophages, DCs, pDCs, all developmental stages of thymic T cells, monocytes, NK cells, as well as at lower levels in B cells. Of note, SAMHD1 was abundantly expressed in HIV target cells residing in the anogenital mucosa, providing a basis for its evaluation as a cellular factor that may impact the efficiency of HIV transmission. Next, we examined the effect of the activation status and proinflammatory cytokine treatment of cells on expression and phosphorylation of SAMHD1. Activated, HIV-susceptible CD4(+) T cells carried pSAMHD1(T592), whereas resting CD4(+) T cells and macrophages expressed the unphosphorylated protein with HIV-restrictive activity. Surprisingly, stimulation of these primary cells with IFN-α, IFN-γ, IL-4, IL-6, IL-12, IL-18, IL-27, or TNF-α affected neither SAMHD1 expression levels nor threonine 592 phosphorylation. Only IL-1β moderately down-regulated SAMHD1 in activated CD4(+) T cells. Taken together, this study establishes the first cross-sectional protein expression profile of SAMHD1 in human tissues and provides insight into its cell cycle-dependent phosphorylation and unresponsiveness to multiple proinflammatory cytokines.

Keywords: HIV; HSV; innate immunity; restriction factor.


Figures

Figure 1
Figure 1
SAMHD1 is expressed in the majority of human tissues. (A and B) Images of immunohistochemical stainings of TMA slides. Stainings were performed with a specific polyclonal anti‐pan‐SAMHD1 antibody [21] (right) or a rabbit control serum (left), followed by biotinylated donkey anti‐rabbit secondary antibodies. Subsequently, sections were exposed to the avidin‐containing ABC‐AP kit, followed by substrate development with New Fuchsin. Nuclei were counterstained with hematoxylin. (A) Selected tissues, staining positive, mainly for resident or infiltrating mononuclear hematopoietic cells. (B) Selected tissues, displaying organ‐specific or specialized SAMHD1‐positive cells. (C) Rating of SAMHD1 expression in human tissues. The expression of SAMHD1 was quantified with a proportion and intensity scoring system [25, 26]. Histogram bars depict the percentage of cases with high (black), medium (gray), or low (open) expression ratings. The percentage of samples with negative ratings is not shown.
Figure 2
Figure 2
SAMHD1 is abundantly expressed in solid organs, gut‐associated lymphoid tissue, at mucosal sites of anogenital HIV transmission, and in CD31+ vascular endothelial cells in vivo. (A) Western blot analysis of SAMHD1 in homogenates from selected human tissues (gallbladder, tonsil, spleen, and pancreas) and SAMHD1‐negative Jurkat‐TAg cells. Cell lysates were separated by SDS‐PAGE, and nitrocellulose membranes were probed with a polyclonal rabbit anti‐SAMHD1 antiserum. MAPK: loading control. (B) Stainings of ileum, rectal, foreskin, and vaginal tissues were performed with a polyclonal anti‐SAMHD1 antibody, followed by incubation with secondary antibody solutions and substrate development with Permanent Red. Nuclei were counterstained with hematoxylin. (C) Rating of SAMHD1 expression in GALT and HIV transmission‐site tissues, according to the scoring system used in Fig. 1C. Histogram bars depict the percentage of cases with high (black), medium (gray), or low (open) expression ratings. The percentage of samples with negative ratings is not shown. (D) Immunofluorescence coexpression analysis of SAMHD1 (green nuclear staining) and vessel endothelium (CD31+, red membranous, and cytoplasmic staining) in selected human tissues. Shown are 2‐channel merged images. MES, Mesencephalon.
Figure 3
Figure 3
SAMHD1 is expressed in all cells of the hematopoietic compartment in vivo. (A) Expression analysis of SAMHD1 (green nuclear staining) alone (A, upper) and coexpression analysis in macrophages (red cytoplasmic CD68+ staining), CD4+ T cells (red membrane staining), B cells (surface CD19+ staining), plasma cells (CD138+), pDC (red surface BDCA2+ staining), or DC (red surface DC‐SIGN+ staining) in human tonsil tissue sections. Shown are 2‐channel merged images. GC, Germinal center; PR, perifollicular region. Expression analyses of SAMHD1 by (B) flow cytometry and (C) immunoblotting in different cell lineages circulating in peripheral blood (B, left, and C) or residing in tonsil (B, right). (B) Freshly isolated PBMCs or tonsil cells were fixed, permeabilized, and stained for SAMHD1, together with the respective lineage markers, and analyzed by flow cytometry. Shown are the forward‐/side‐scatter plots, with the R1 live gate indicated, and dot plots showing SAMHD1/lineage marker costainings. Subpopulations are circled. The data are representative of 3 (PBMC) and 2 (tonsil) donors analyzed. (C) Lysates of purified T cells, CD4+ (r, resting; act, activated) and CD8+, monocytes (CD14+), MDM, NK cells (CD56+), B cells (CD19+, CD22+), MDDC, and reference cell lines that express no (Jurkat‐TAg) or high (THP‐1) endogenous SAMHD1 levels were separated by SDS‐PAGE. D1, D2 indicate different donors; numbers on the left indicate the apparent molecular weight in kDa. Nitrocellulose membranes were probed with a polyclonal rabbit anti‐pan‐SAMHD1 antibody. GAPDH, Loading control.
Figure 4
Figure 4
SAMHD1 expression in the human thymus. (A) Immunohistochemical analysis of pan‐SAMHD1 expression in thymic tissue sections. Control, Sections stained with preimmune rabbit serum (low power field); HC, Hassallˈs corpuscle; M, medulla; C, cortex. (B) Coexpression analysis of SAMHD1 (green nuclear staining) in CD4+ T cells (top, red CD4+ staining) and macrophages (lower, red CD68+ staining) by immunofluorescence microscopy. Control (left panel), Preimmune rabbit (rb) serum‐stained sections at low power field combined with murine (m) isotype controls IgG1 or IgG3, respectively. Two‐channel merged pictures are shown. (C) SAMHD1 expression analysis in developing human thymocytes ex vivo. The intracellular SAMHD1 expression levels in developing thymocyte populations were determined by flow cytometry (see Supplemental Fig. 5 for details). Histogram bars represent the arithmetic mean + sd of the mean fluorescence intensity (MFI) of SAMHD1 expression in the respective thymocyte subsets of 4 donors. Thymocyte differentiation was categorized into the 7 stages indicated: 1) CD34+CD1, recent thymic immigrants; 2) CD3+CD4+CD8, immature, single‐positive cells; 3) CD3CD4+CD8+, double‐positive thymocytes undergoing β‐selection; 4) CD3+CD4+CD8+, double‐positive thymocytes that have undergone β‐selection; 5) CD3+CD27+CD69+, positively selected thymocytes; 6) CD3+CD4CD8+, mature CD8+ thymic T cells; and 7) CD3+CD4+CD8, mature CD4+ thymic T cells. The numbers indicated below the histogram represent the percentage of SAMHD1+ cells within the respective subset.
Figure 5
Figure 5
Impact of T cell activation and cytokine stimulation on SAMHD1 expression and phosphorylation. (A and B) Immunoblot analyses of CD4+ T cells after 24 h or 48 h of cytokine treatment, respectively. Cells were incubated with indicated concentrations of IFN‐α, IFN‐γ, TNF‐α, or IL‐12/IL‐18 (A), IL‐6, IL‐4, and IL‐1β (B), lysed and analyzed with anti‐pSAMHD1(T592) and anti‐pan‐SAMHD1 antibodies. MxA and IFI16 served as positive controls for IFN‐induced gene expression. MAPK and MLC: loading controls. Shown is 1 representative donor out of 3 donors (A) or 2 donors (B) for CD4+ T cells. (C) PBMC‐derived CD4+ T cells (left panel) and tonsil‐derived lymphoid aggregate cultures (right panel) were cultivated in the presence of the indicated cytokines or cytokine combinations for 24 h and subsequently analyzed for SAMHD1 expression by flow cytometry. Shown are arithmetic means + sem of the factor of change of the mean fluorescence intensity of cytokine‐treated cells relative to untreated control cells of a total of 3 donors (CD4+ T cells) and 2 donors (tonsil derived cells).
Figure 6
Figure 6
Impact of cytokine stimulation on SAMHD1 expression and phosphorylation in MDMs. Immunoblot analysis of MDM after 24 h of treatment with indicated concentrations of different cytokines (ng/ml for IL‐12/IL‐18/TNF‐α and IU/ml for IFN‐α/IFN‐γ). Cells were lysed and analyzed with anti‐pSAMHD1(T592)) and anti‐pan‐SAMHD1 antibodies. Activated CD4+ T cells served as positive control for pSAMHD1(T592) detection. MxA served as a positive control for IFN‐induced gene expression and MAPK as a loading control. Shown is 1 representative donor out of 7.

Comment in

References

    1. Crow, Y.J. , Rehwinkel, J. (2009) Aicardi‐Goutieres syndrome and related phenotypes: linking nucleic acid metabolism with autoimmunity. Hum. Mol. Genet. 18, R130–R136. - PMC - PubMed
    1. Goutieres, F. (2005) Aicardi‐Goutieres syndrome. Brain Dev. 27, 201–206. - PubMed
    1. Li, N. , Zhang, W. , Cao, X. (2000) Identification of human homologue of mouse IFN‐gamma induced protein from human dendritic cells. Immunol. Lett. 74, 221–224. - PubMed
    1. Rice, G.I. , Bond, J. , Asipu, A. , Brunette, R.L. , Manfield, I.W. , Carr, I.M. , Fuller, J.C. , Jackson, R.M. , Lamb, T. , Briggs, T.A. , Ali, M. , Gornall, H. , Couthard, L.R. , Aeby, A. , Attard‐Montalto, S.P. , Bertini, E. , Bodemer, C. , Brockmann, K. , Brueton, L.A. , Corry, P.C. , Desguerre, I. , Fazzi, E. , Cazorla, A.G. , Gener, B. , Hamel, B.C. , Heiberg, A. , Hunter, M. , van der Knaap, M.S. , Kumar, R. , Lagae, L. , Landrieu, P.G. , Lourenco, C.M. , Marom, D. , McDermott, M.F. , van der Merwe, W. , Orcesi, S. , Prendiville, J.S. , Rasmussen, M. , Shalev, S.A. , Soler, D.M. , Shinawi, M. , Spiegel, R. , Tan, T.Y. , Vanderver, A. , Wakeling, E.L. , Wassmer, E. , Whittaker, E. , Lebon, P. , Stetson, D.B. , Bonthron, D.T. , Crow, Y.J. (2009) Mutations involved in Aicardi‐Goutièeres syndrome implicate SAMHD1 as regulator of the innate immune response. Nat. Genet. 41, 829–832. - PMC - PubMed
    1. Liao, W. , Bao, Z. , Cheng, C. , Mok, Y.K. , Wong, W.S. (2008) Dendritic cell‐derived interferon‐gamma‐induced protein mediates tumor necrosis factor‐alpha stimulation of human lung fibroblasts. Proteomics 8, 2640–2650. - PubMed

Publication types

Substances