. 2015 Feb 17;112(7):E728-37.
doi: 10.1073/pnas.1500788112. Epub 2015 Feb 2.

Overlapping hotspots in CDRs are critical sites for V region diversification

Affiliations

Overlapping hotspots in CDRs are critical sites for V region diversification

Lirong Wei et al. Proc Natl Acad Sci U S A. .

Abstract

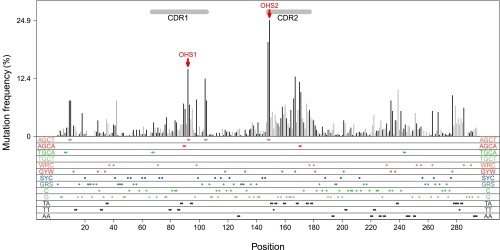
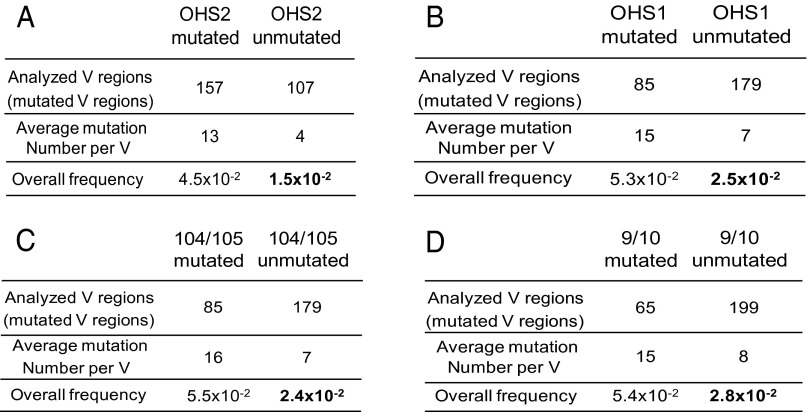
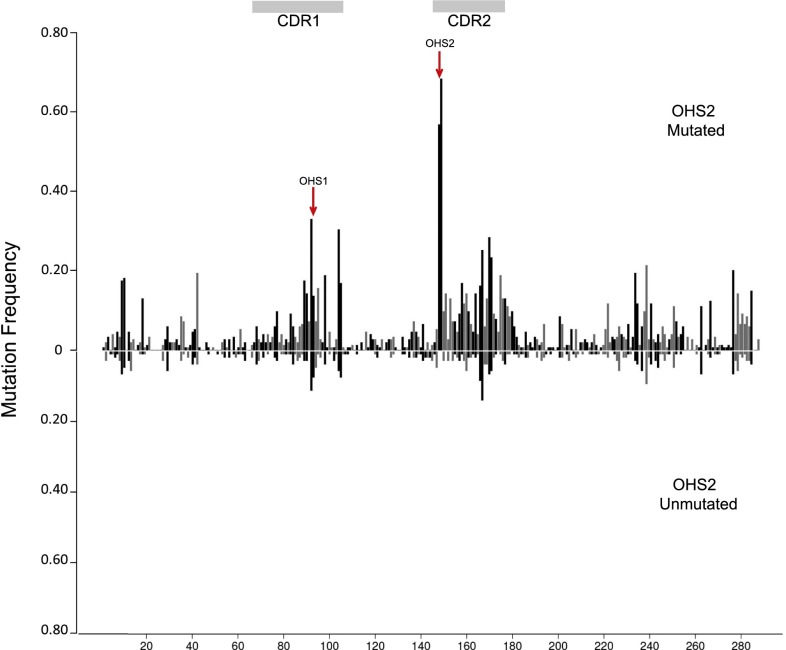
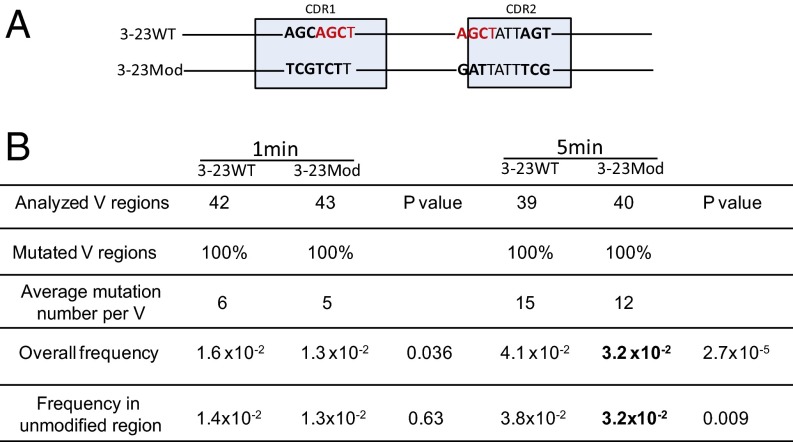
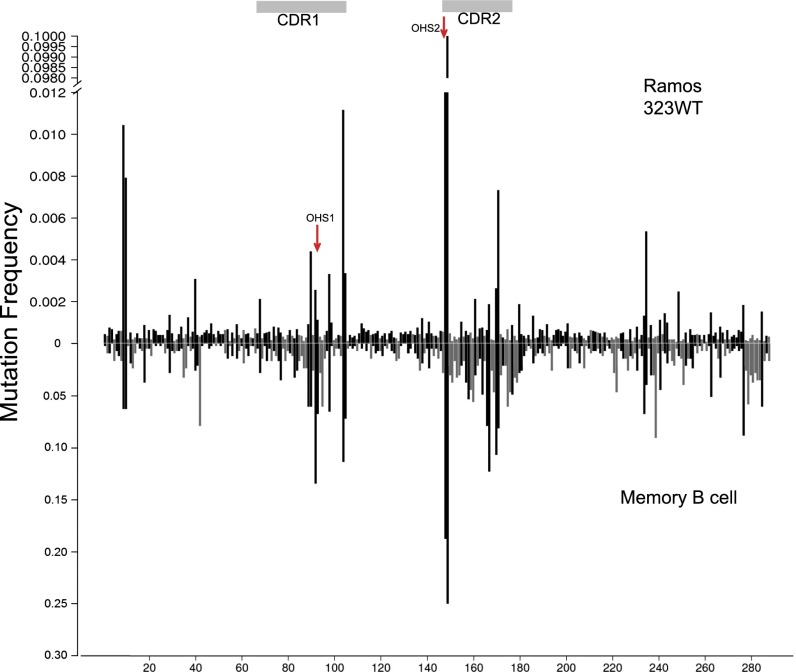
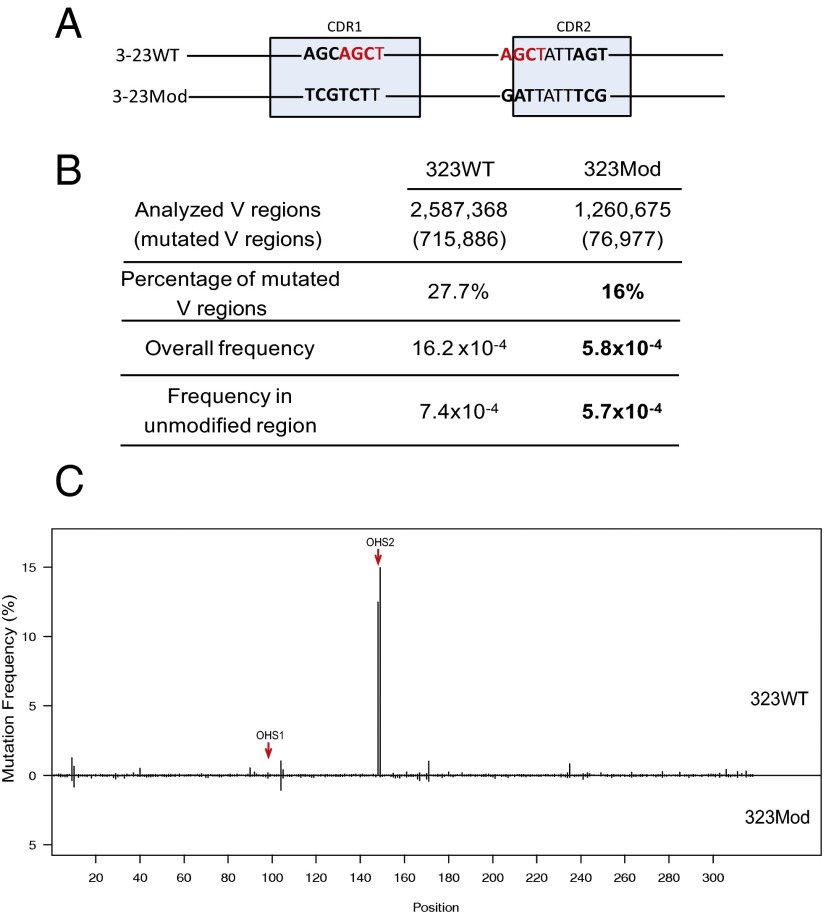
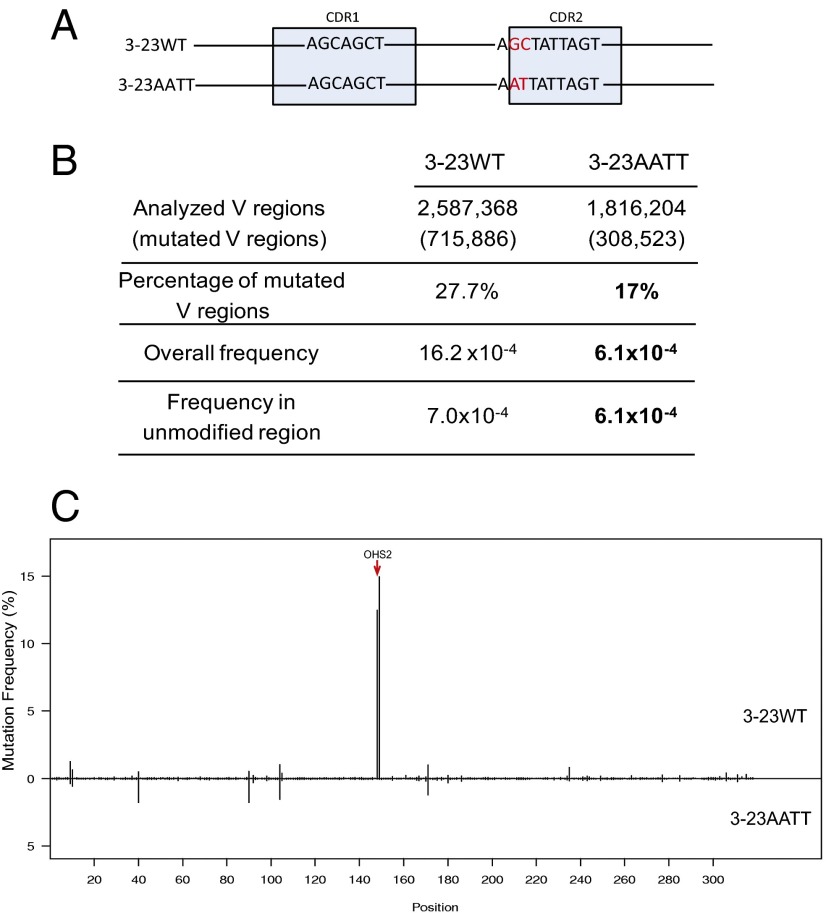
Activation-induced deaminase (AID) mediates the somatic hypermutation (SHM) of Ig variable (V) regions that is required for the affinity maturation of the antibody response. An intensive analysis of a published database of somatic hypermutations that arose in the IGHV3-23*01 human V region expressed in vivo by human memory B cells revealed that the focus of mutations in complementary determining region (CDR)1 and CDR2 coincided with a combination of overlapping AGCT hotspots, the absence of AID cold spots, and an abundance of polymerase eta hotspots. If the overlapping hotspots in the CDR1 or CDR2 did not undergo mutation, the frequency of mutations throughout the V region was reduced. To model this result, we examined the mutation of the human IGHV3-23*01 biochemically and in the endogenous heavy chain locus of Ramos B cells. Deep sequencing revealed that IGHV3-23*01 in Ramos cells accumulates AID-induced mutations primarily in the AGCT in CDR2, which was also the most frequent site of mutation in vivo. Replacing the overlapping hotspots in CDR1 and CDR2 with neutral or cold motifs resulted in a reduction in mutations within the modified motifs and, to some degree, throughout the V region. In addition, some of the overlapping hotspots in the CDRs were at sites in which replacement mutations could change the structure of the CDR loops. Our analysis suggests that the local sequence environment of the V region, and especially of the CDR1 and CDR2, is highly evolved to recruit mutations to key residues in the CDRs of the IgV region.

Keywords: AID; IGHV3-23; complementarity-determining regions; cytosine deamination; somatic hypermutation.


Conflict of interest statement

The authors declare no conflict of interest.

Figures

Fig. 1.
Fig. 1.
Demonstration of the mutation distribution of IGHV3-23*01 in vivo. The database includes V regions that are mutated (264) and not mutated (174). Each CDR3 was unique; they are not shown here. The x axis shows the mutation sites within the V region. The y axis is the mutation frequency for each site. Black lines show the mutation frequencies that occurred at G:C sites. Gray lines demonstrate the mutation frequencies at A:T sites. Each colored dot in the bottom panels represents an AID hot/cold/neutral spot or Polη hotspot, as labeled at both edges. Double dots are AID overlapping hotspots (WGCW) or two adjacent Polη hotspots. The red arrows point to the OHS1 and OHS2 overlapping hotspots, as labeled. Horizontal gray bars on top are CDRs as labeled.
Fig. 2.
Fig. 2.
Analysis of the mutations in subsets of the memory B-cell database. (A) Analysis of OHS2 mutated and unmutated V regions. The first subset in the first column is the V regions that have both GC in OHS2 mutated or either G or C mutated (shown in the arrow in Fig.1). The second column is the V regions that have no mutations at either G or C in OHS2 and one or more additional mutations. The mutation frequencies do not include the mutations that occurred at the GC sites in OHS2, so that only the mutations outside of those GC sites are compared. The bolded number represents the frequency of mutation in V regions in which neither G nor C of OHS2 was mutated and represents a significantly decreased frequency of mutation compared with those V regions in which G or C of OHS2 or both GC were mutated [P < 10−6, calculated in SHMTool program in which the χ2 test is implemented (76)]. (B) Analysis of OHS1 mutated and unmutated V regions. (C) Analysis of 104/105 GC in CDR1 mutated and unmutated V regions. (D) Analysis of 9/10 GC sites in FW1 mutated and unmutated V regions. In B, C, and D, the same analysis was performed as in A, and the bolded values are significantly decreased (P < 10−6).
Fig. 3.
Fig. 3.
Comparison of the two subsets of the memory B-cell database. (Top) V regions that have mutations in both or neither CDR2 overlapping hotspots mutated (OHS2 mutated). (Bottom) V regions in which neither strand of OHS2 is mutated (OHS2 unmutated) and the V regions have mutations at other sites. The red arrows point to OHS1 and OHS2. The gray bars on top are the CDRs as labeled. The vertical black lines show the frequency of mutations at G:C sites, and the vertical gray lines show the frequency of mutations at A:T sites. The x axis shows the position of each of the mutations. The y axis shows the mutation frequency.
Fig. 4.
Fig. 4.
In vitro analysis. (A) DNA modification schematic in which 3-23WT is the IGHV3-23*01 WT germ line DNA sequence and 3-23Mod shows the modified IGHV3-23*01 DNA sequence. The highlighted nucleotides in red are the AGCT sites in CDR1 and CDR2. The bold nucleotides are the differences between 3-23WT and 3-23Mod DNAs. The 6-bp AGCAGC in CDR1 of 3-23WT are changed to TCGTCT in 3-23Mod, and another 6-bp AGC...AGC in CDR2 of 3-23WT are changed to GAT...TCG in 3-23Mod. The light blue boxes mark the CDRs as labeled but are not drawn to scale. (B) Mutation frequency generated by the in vitro assay. This table shows the untranscribed (Top) strand DNA mutation frequencies after 1- and 5-min incubations with AID, as labeled on the top of the table. The first row shows the number of V regions sequenced, and the second row tells the percentage of the mutated V regions in the number of the first row. “Average mutation number per V” shows the total mutations divided by number of mutated V regions. “Overall frequency” shows the total mutation frequencies in all of the V regions shown in the first row (mutations/bp). “Frequency in unmodified region” refers to the mutation frequency in the V region excluding the modified area. P values are shown after each comparison between 3-23WT and 3-23Mod and calculated in SHMTool, as described in ref. . The bold numbers show the significantly decreased values in 3-23Mod compared with 3-23WT.
Fig. 5.
Fig. 5.
Comparison of the mutation pattern of IGHV3-23*01 in Ramos cell lines (Ramos 3-23WT) with that from memory B-cell database (memory B-cell). The y axis shows the mutation frequency. (Upper) Y axis is gapped from 0.012 to 0.098 and is a different scale than in the lower panel because of the lower overall frequency of mutations and the relatively higher frequencies in OHS2 in Ramos. CDRs are showed in the gray horizontal boxes. Black lines and gray vertical bars represent G:C and A:T mutations frequencies, respectively. Red arrows point to OHS1 and OHS2.
Fig. 6.
Fig. 6.
DNA modification in both CDR1 and CDR2 changed the mutation frequency of V region in Ramos. (A) DNA modification schematic is the same as shown in Fig. 4A. (B) Mutation analysis in 3-23WT Ramos subclones and DNA-modified Ramos subclones (3-23Mod). The first column has the values from a pool of all of the V regions of five 3-23WT subclones, and the second column contains the values from a pool of five 3-23Mod subclones. The first row shows the numbers of the total V regions obtained from the deep sequencing for 3-23WT and 3-23Mod. In the parenthesis are the numbers of mutated V regions. The second row has the percentages of mutated V regions in total V regions shown in the first row. “Overall frequency” represents the mutations in all of the V regions (shown in the first row) that occurred throughout the whole V region, including the mutations that occurred in the modified regions, calculated in SHMTool (76). “Frequency in unmodified region” shows the mutation rates after the mutations in the modified area (12-bp differences totally in CDR1 and CDR2 between 3-23WT and 3-23Mod) are excluded from 3-23WT and 3-23Mod V regions, and they are also calculated in SHMTool. Bold values in 3-23Mod for mutation frequencies are significantly decreased values compared with 3-23WT (P < 10−6, calculated by SHMtool). The bold numbers are percentage of mutated V regions, the P value is <0.001 (χ2 test). (C) Mutation distribution comparison between 3-23WT and 3-23Mod. Upper part is 3-23WT, lower part is 3-23Mod, as labeled. The x axis gives the site for each mutation of V region. The y axis shows the mutation frequency for each site. Each vertical line represents the mutation frequency at the corresponding site, as labeled in x axis. Red arrows point to OHS1 and OHS2.
Fig. 7.
Fig. 7.
DNA modification in OHS2 changed the mutation frequency in Ramos. (A) DNA modification schematic: 3-23WT represents IGHV3-23*01 WT germ line DNA sequence, and 3-23AATT shows the GC sites of OHS2-modified IGHV3-23*01 DNA sequence. The highlighted nucleotides are the differences between 3-23WT and 3-23Mod. The light blue boxes mark the CDRs as labeled. (B) Mutation analysis in V regions of 3-23WT and DNA modified 3-23AATT subclones. The first column has the values obtained from the same V regions as in Fig. 6B because the experiments in Figs. 6 and 7 were done in parallel. The second column contains the values from the combination of the V regions from four 3-23AATT subclones. The rows showed the numbers obtained by the same analysis as in Fig. 6B for 3-23AATT. Bold values in 3-23AATT for mutation frequencies are significantly decreased values compared with 3-23WT (P < 10−6, calculated by SHMtool). In the bold values for percentage of mutated V regions, the P value is <0.001 (χ2 test). Here the modified area only includes GC sites in OHS2. (C) Mutation distribution comparison between 3-23WT and 3-23AATT. The upper part is 3–23WT, and the lower part is 3–23AATT. The rest is the same as described in Fig. 6C. Red arrow points to OHS2.

References

    1. West AP, Jr, et al. Structural insights on the role of antibodies in HIV-1 vaccine and therapy. Cell. 2014;156(4):633–648. - PMC - PubMed
    1. Keim C, Kazadi D, Rothschild G, Basu U. Regulation of AID, the B-cell genome mutator. Genes Dev. 2013;27(1):1–17. - PMC - PubMed
    1. Rogozin IB, Diaz M. Cutting edge: DGYW/WRCH is a better predictor of mutability at G:C bases in Ig hypermutation than the widely accepted RGYW/WRCY motif and probably reflects a two-step activation-induced cytidine deaminase-triggered process. J Immunol. 2004;172(6):3382–3384. - PubMed
    1. Zhang W, et al. Clonal instability of V region hypermutation in the Ramos Burkitt’s lymphoma cell line. Int Immunol. 2001;13(9):1175–1184. - PubMed
    1. Golding GB, Gearhart PJ, Glickman BW. Patterns of somatic mutations in immunoglobulin variable genes. Genetics. 1987;115(1):169–176. - PMC - PubMed

Publication types