

Livers with constitutive mTORC1 activity resist steatosis independent of feedback suppression of Akt
- PMID: 25646773
- PMCID: PMC4315590
- DOI: 10.1371/journal.pone.0117000
Livers with constitutive mTORC1 activity resist steatosis independent of feedback suppression of Akt
Abstract
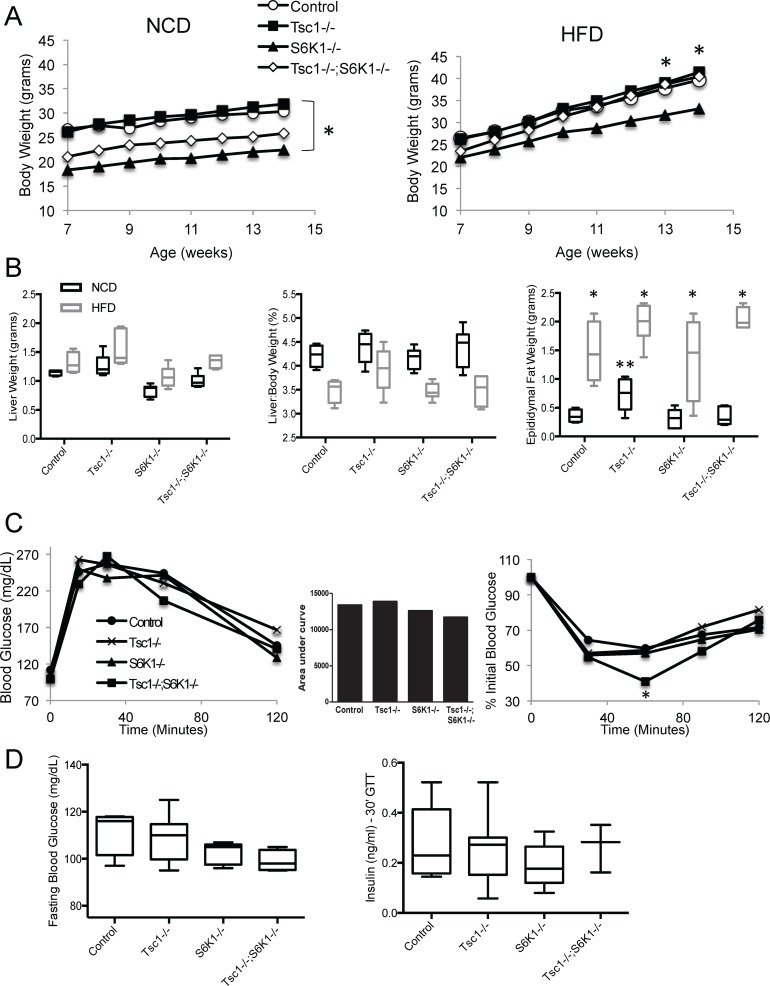
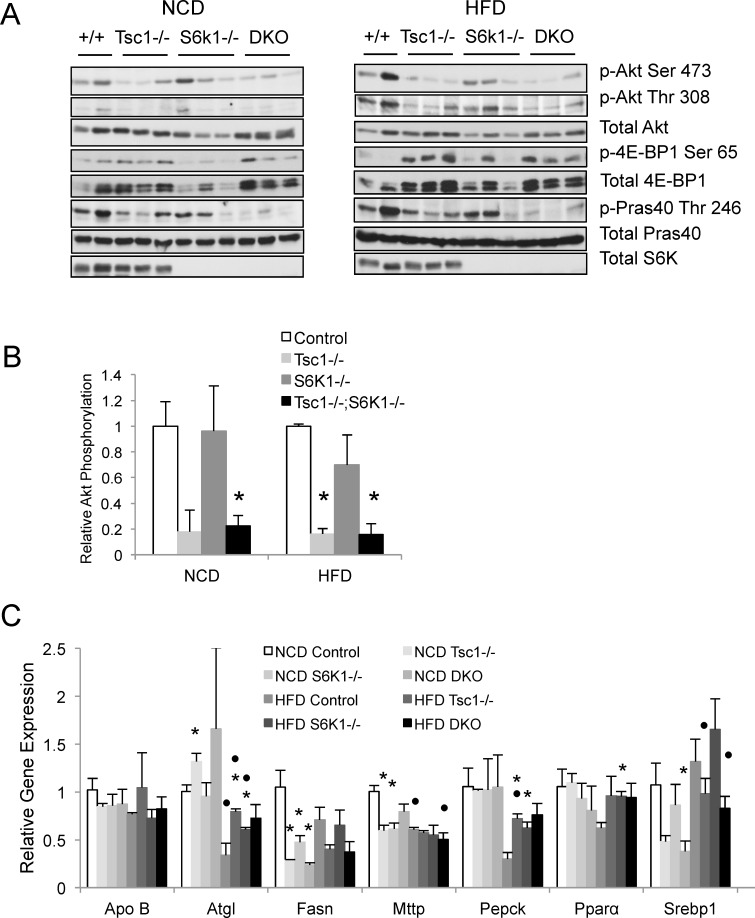
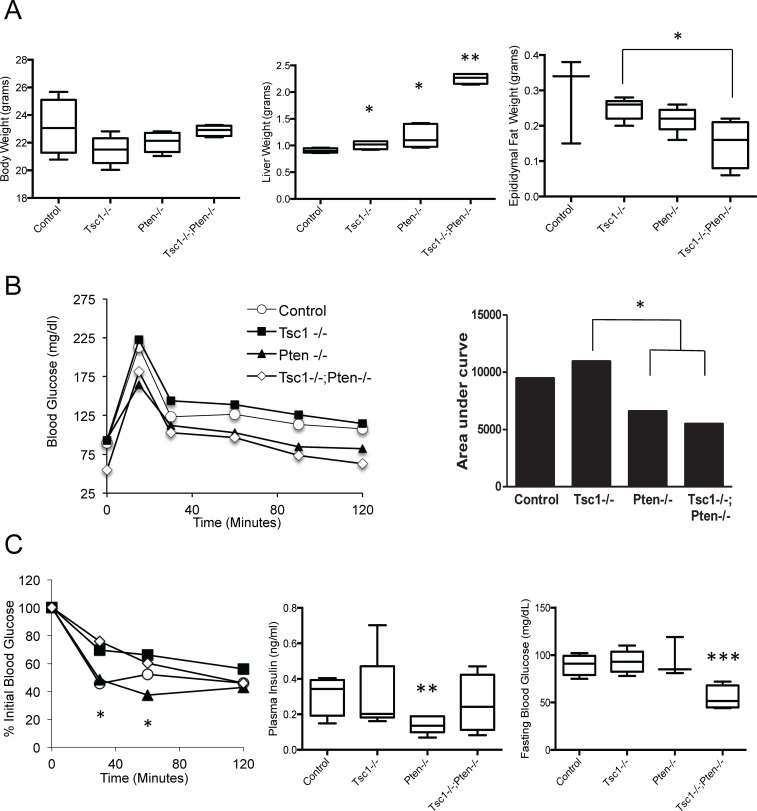
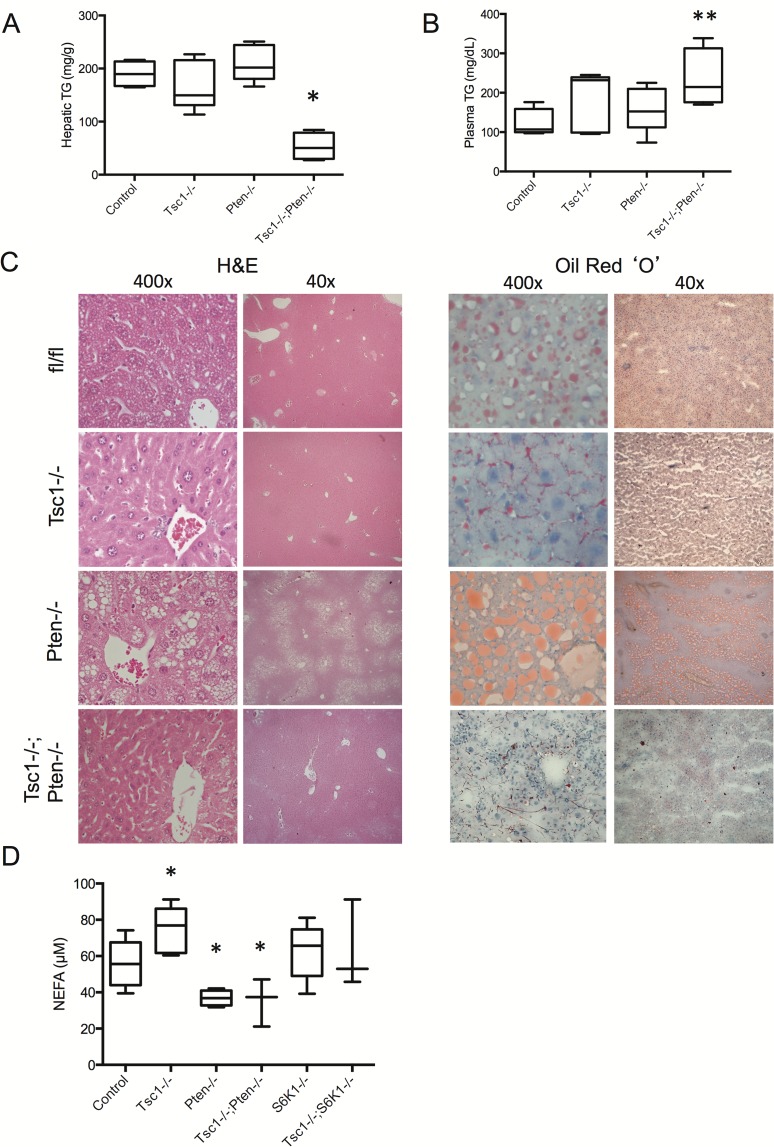
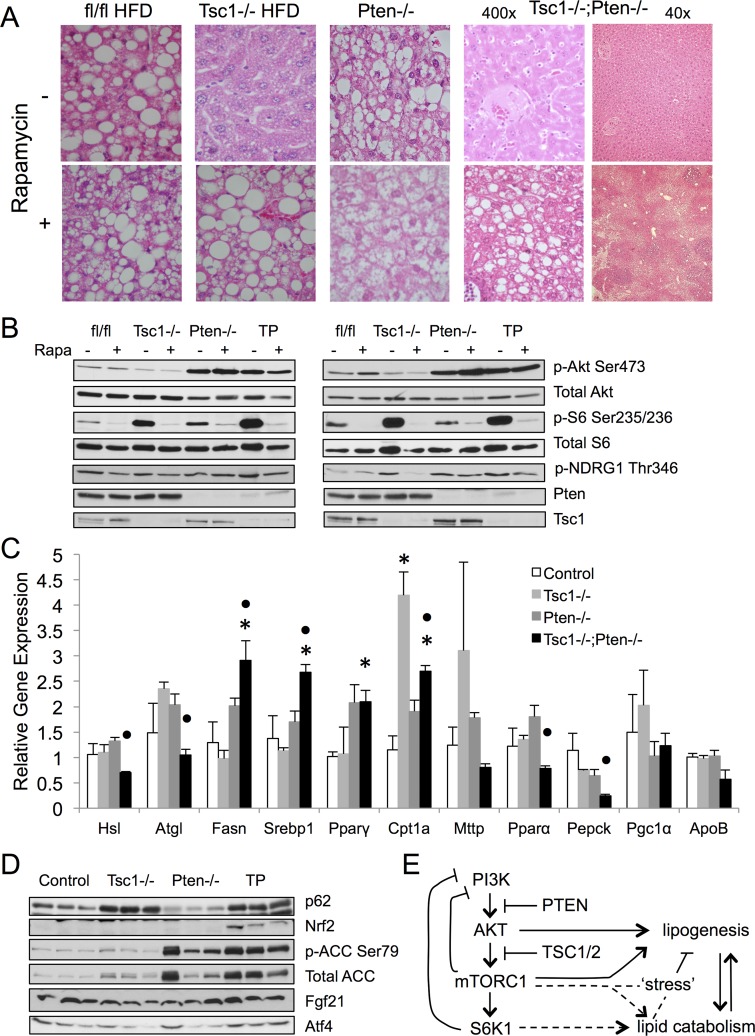
Insulin resistance is an important contributing factor in non-alcoholic fatty liver disease. AKT and mTORC1 are key components of the insulin pathway, and play a role in promoting de novo lipogenesis. However, mTORC1 hyperactivity per se does not induce steatosis in mouse livers, but instead, protects against high-fat diet induced steatosis. Here, we investigate the in vivo mechanism of steatosis-resistance secondary to mTORC1 activation, with emphasis on the role of S6K1-mediated feedback inhibition of AKT. Mice with single or double deletion of Tsc1 and/or S6k1 in a liver-specific or whole-body manner were generated to study glucose and hepatic lipid metabolism between the ages of 6-14 weeks. Following 8 weeks of high-fat diet, the Tsc1-/-;S6k1-/- mice had lower body weights but higher liver TG levels compared to that of the Tsc1-/- mice. However, the loss of S6k1 did not relieve feedback inhibition of Akt activity in the Tsc1-/- livers. To overcome Akt suppression, Pten was deleted in Tsc1-/- livers, and the resultant mice showed improved glucose tolerance compared with the Tsc1-/- mice. However, liver TG levels were significantly reduced in the Tsc1-/-;Pten-/- mice compared to the Pten-/- mice, which was restored with rapamycin. We found no correlation between liver TG and serum NEFA levels. Expression of lipogenic genes (Srebp1c, Fasn) were elevated in the Tsc1-/-;Pten-/- livers, but this was counter-balanced by an up-regulation of Cpt1a involved in fatty acid oxidation and the anti-oxidant protein, Nrf2. In summary, our in vivo models showed that mTORC1-induced resistance to steatosis was dependent on S6K1 activity, but not secondary to AKT suppression. These findings confirm that AKT and mTORC1 have opposing effects on hepatic lipid metabolism in vivo.
Conflict of interest statement
Figures

Similar articles
-
Tuberous sclerosis complex-1 deficiency attenuates diet-induced hepatic lipid accumulation.PLoS One. 2011 Mar 29;6(3):e18075. doi: 10.1371/journal.pone.0018075. PLoS One. 2011. PMID: 21479224 Free PMC article.
-
Serine 302 Phosphorylation of Mouse Insulin Receptor Substrate 1 (IRS1) Is Dispensable for Normal Insulin Signaling and Feedback Regulation by Hepatic S6 Kinase.J Biol Chem. 2016 Apr 15;291(16):8602-17. doi: 10.1074/jbc.M116.714915. Epub 2016 Feb 4. J Biol Chem. 2016. PMID: 26846849 Free PMC article.
-
Akt stimulates hepatic SREBP1c and lipogenesis through parallel mTORC1-dependent and independent pathways.Cell Metab. 2011 Jul 6;14(1):21-32. doi: 10.1016/j.cmet.2011.06.002. Cell Metab. 2011. PMID: 21723501 Free PMC article.
-
mTORC1 signaling and regulation of pancreatic β-cell mass.Cell Cycle. 2012 May 15;11(10):1892-902. doi: 10.4161/cc.20036. Epub 2012 May 15. Cell Cycle. 2012. PMID: 22544327 Free PMC article. Review.
-
Mosaic Disorders of the PI3K/PTEN/AKT/TSC/mTORC1 Signaling Pathway.Dermatol Clin. 2017 Jan;35(1):51-60. doi: 10.1016/j.det.2016.07.001. Dermatol Clin. 2017. PMID: 27890237 Free PMC article. Review.
Cited by
-
Activation of Liver mTORC1 Protects Against NASH via Dual Regulation of VLDL-TAG Secretion and De Novo Lipogenesis.Cell Mol Gastroenterol Hepatol. 2022;13(6):1625-1647. doi: 10.1016/j.jcmgh.2022.02.015. Epub 2022 Feb 28. Cell Mol Gastroenterol Hepatol. 2022. PMID: 35240344 Free PMC article.
-
Mechanistic role of long non-coding RNAs in the pathogenesis of metabolic dysfunction-associated steatotic liver disease and fibrosis.eGastroenterology. 2024 Nov;2(4):e100115. doi: 10.1136/egastro-2024-100115. Epub 2024 Nov 18. eGastroenterology. 2024. PMID: 39872125 Free PMC article.
-
Hepatic mTORC1 Opposes Impaired Insulin Action to Control Mitochondrial Metabolism in Obesity.Cell Rep. 2016 Jul 12;16(2):508-519. doi: 10.1016/j.celrep.2016.06.006. Epub 2016 Jun 23. Cell Rep. 2016. PMID: 27346353 Free PMC article.
-
Crosstalk between beta-adrenergic and insulin signaling mediates mechanistic target of rapamycin hyperactivation in liver of high-fat diet-fed male mice.Physiol Rep. 2021 Jul;9(13):e14958. doi: 10.14814/phy2.14958. Physiol Rep. 2021. PMID: 34231324 Free PMC article.
-
Mammalian target of rapamycin complex 1 and FoxO1 in the transcriptional control of lipolysis and de novo lipogenesis.Curr Opin Endocrinol Diabetes Obes. 2017 Oct;24(5):326-331. doi: 10.1097/MED.0000000000000352. Curr Opin Endocrinol Diabetes Obes. 2017. PMID: 28841634 Free PMC article.
References
Publication types
MeSH terms
Substances
Grants and funding
LinkOut - more resources
Full Text Sources
Other Literature Sources
Medical
Molecular Biology Databases
Research Materials
Miscellaneous
