

Trends in the lifetime risk of developing cancer in Great Britain: comparison of risk for those born from 1930 to 1960
- PMID: 25647015
- PMCID: PMC4453943
- DOI: 10.1038/bjc.2014.606
Trends in the lifetime risk of developing cancer in Great Britain: comparison of risk for those born from 1930 to 1960
Abstract
Background: Typically, lifetime risk is calculated by the period method using current risks at different ages. Here, we estimate the probability of being diagnosed with cancer for individuals born in a given year, by estimating future risks as the cohort ages.
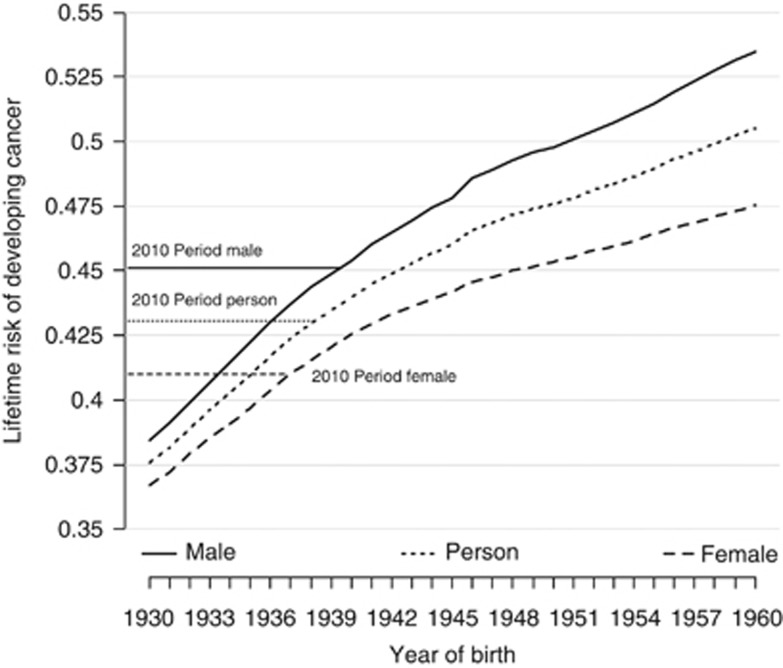
Methods: We estimated the lifetime risk of cancer in Britain separately for men and women born in each year from 1930 to 1960. We projected rates of all cancers (excluding non-melanoma skin cancer) and of all cancer deaths forwards using a flexible age-period-cohort model and backwards using age-specific extrapolation. The sensitivity of the estimated lifetime risk to the method of projection was explored.
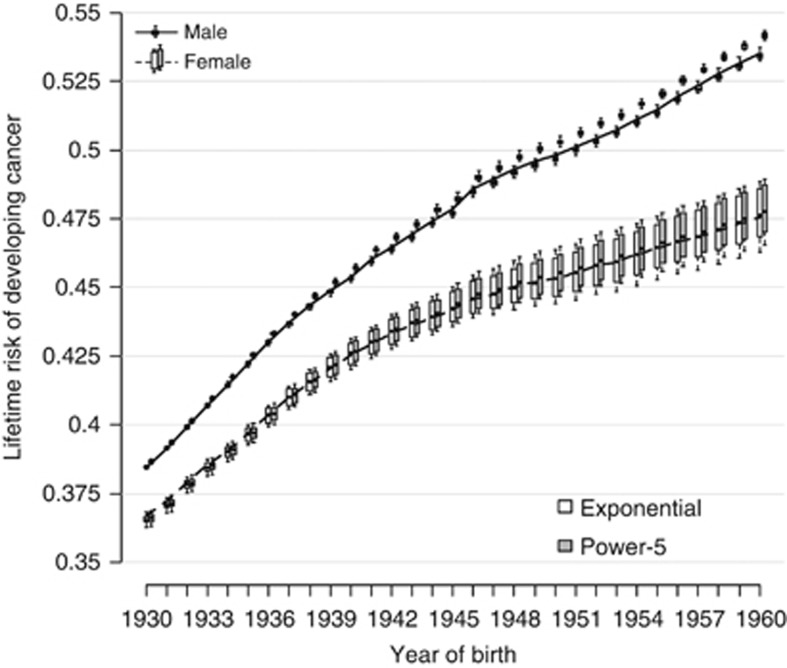
Results: The lifetime risk of cancer increased from 38.5% for men born in 1930 to 53.5% for men born in 1960. For women it increased from 36.7 to 47.5%. Results are robust to different models for projections of cancer rates.
Conclusions: The lifetime risk of cancer for people born since 1960 is >50%. Over half of people who are currently adults under the age of 65 years will be diagnosed with cancer at some point in their lifetime.
Figures
Comment in
-
Comment on: 'Trends in the lifetime risk of developing cancer in Great Britain: comparison of risk for those born from 1930 to 1960'--cancer predictions need more context.Br J Cancer. 2015 Dec 1;113(11):1632. doi: 10.1038/bjc.2015.219. Epub 2015 Jun 23. Br J Cancer. 2015. PMID: 26103571 Free PMC article. No abstract available.
References
-
- American Cancer Society 2013. Lifetime probability of developing or dying from cancer. Available from: : http://www.cancer.org/cancer/cancerbasics/lifetime-probability-of-develo... (accessed 30 July 2014).
-
- Bray F, Lortet-Tieulent J, Ferlay J, Forman D, Auvinen A. Prostate cancer incidence and mortality trends in 37 European countries: an overview. Eur J Cancer. 2010;46 (17:3040–3052. - PubMed
-
- Campbell MK, Feuer EJ, Wun LM. Cohort-specific risks of developing breast cancer to age 85 in Connecticut. Epidemiology. 1994;5 (3:290–296. - PubMed
-
- Cancer Research UK 2012. Statistics on the risk of developing cancer. Available from: : http://www.cancerresearchuk.org/cancer-info/cancerstats/incidence/risk/s... (accessed 30 July 2014).
-
- Center MM, Jemal A, Ward E. International trends in colorectal cancer incidence rates. Cancer Epidemiol Biomarkers Prev. 2009;18 (6:1688–1694. - PubMed
Publication types
MeSH terms
Grants and funding
LinkOut - more resources
Full Text Sources
Other Literature Sources
