. 2015 Feb 3;11(2):e1004901.
doi: 10.1371/journal.pgen.1004901. eCollection 2015 Feb.

Inflammation-induced cell proliferation potentiates DNA damage-induced mutations in vivo

Affiliations

Inflammation-induced cell proliferation potentiates DNA damage-induced mutations in vivo

Orsolya Kiraly et al. PLoS Genet. .

Abstract

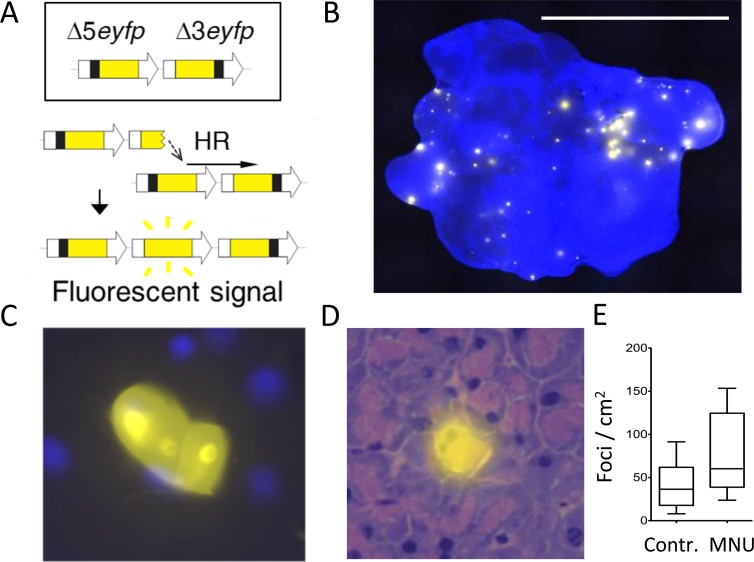
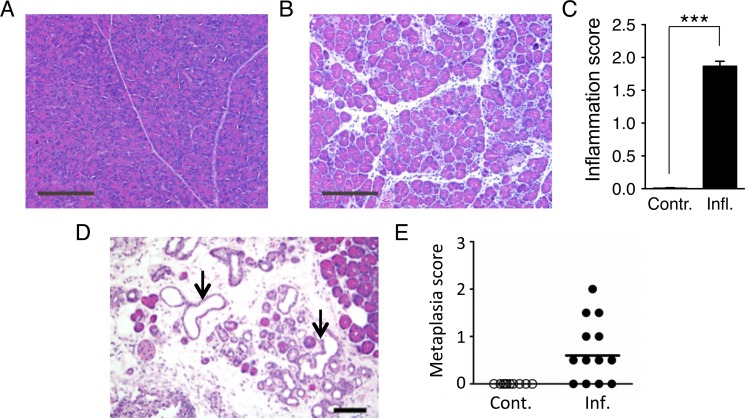
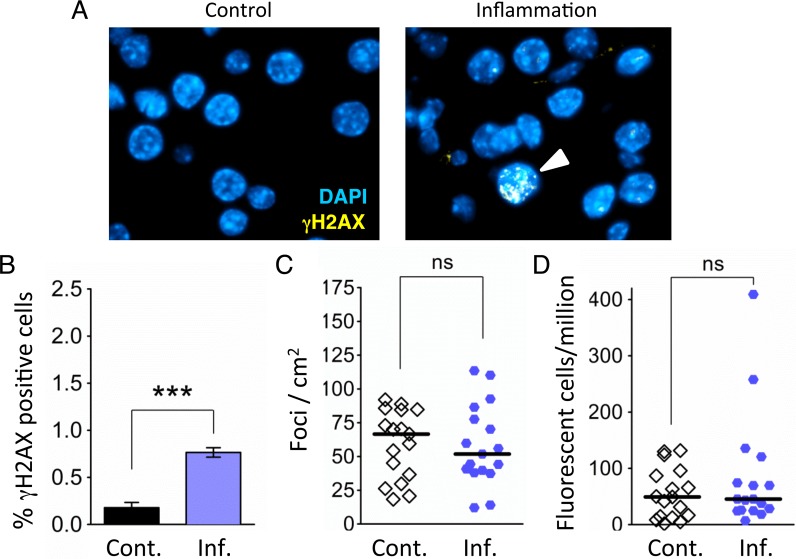
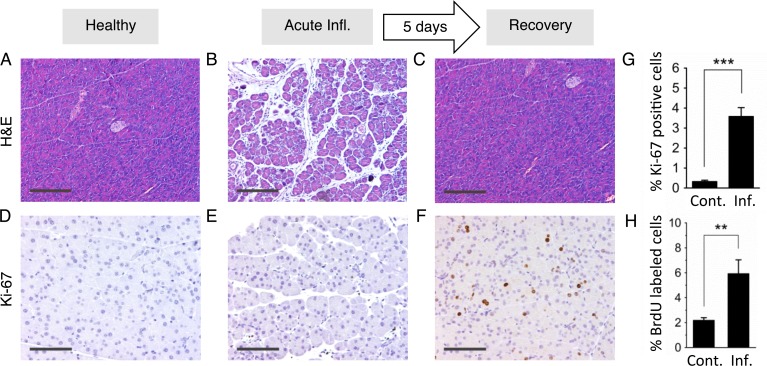
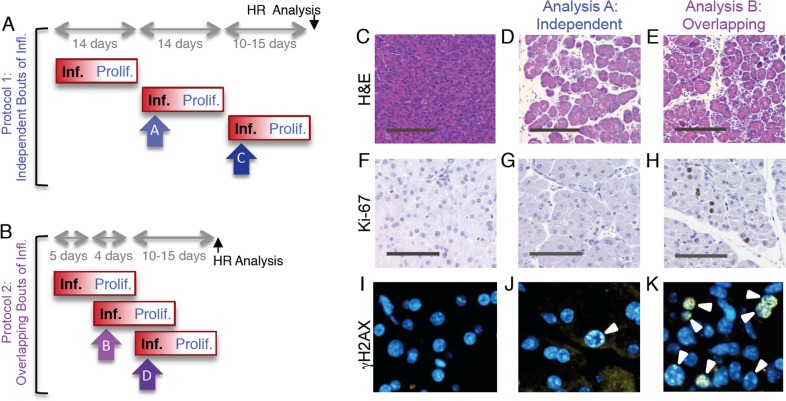
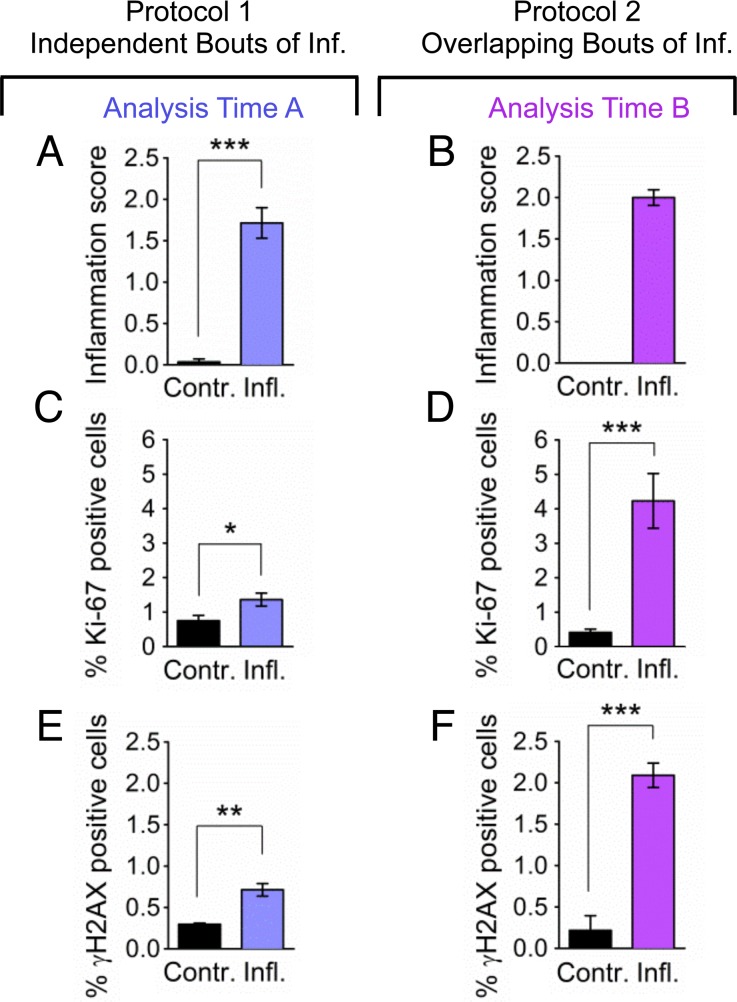
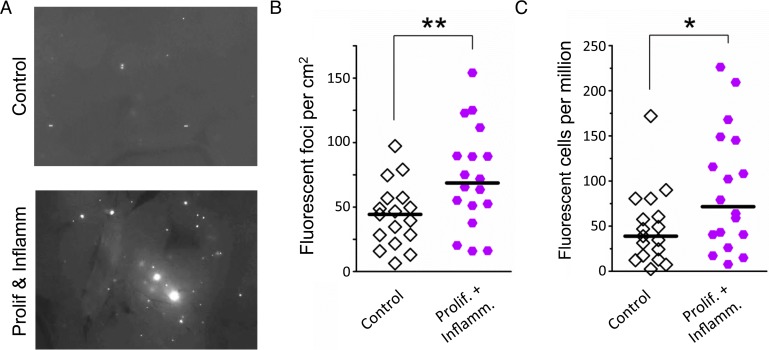
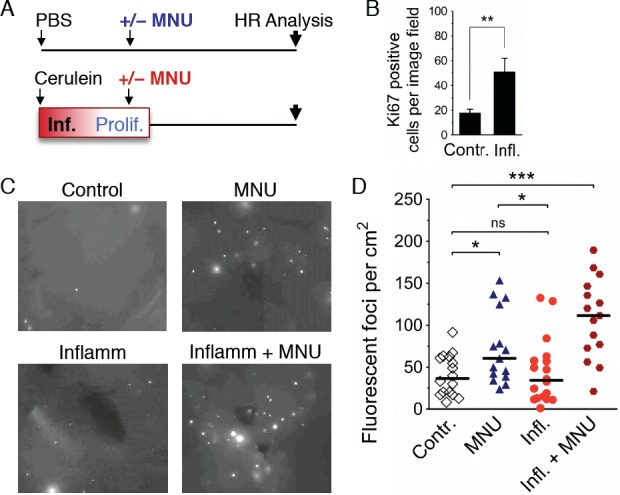
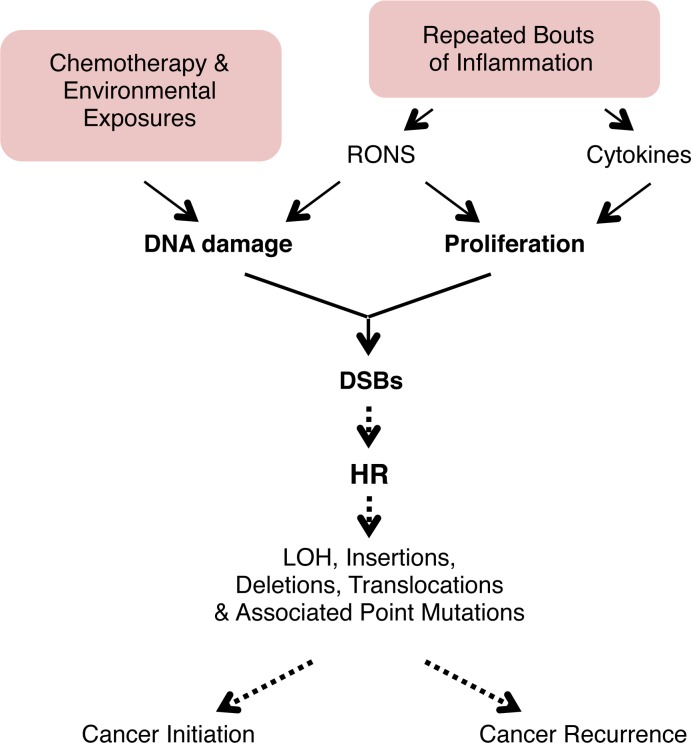
Mutations are a critical driver of cancer initiation. While extensive studies have focused on exposure-induced mutations, few studies have explored the importance of tissue physiology as a modulator of mutation susceptibility in vivo. Of particular interest is inflammation, a known cancer risk factor relevant to chronic inflammatory diseases and pathogen-induced inflammation. Here, we used the fluorescent yellow direct repeat (FYDR) mice that harbor a reporter to detect misalignments during homologous recombination (HR), an important class of mutations. FYDR mice were exposed to cerulein, a potent inducer of pancreatic inflammation. We show that inflammation induces DSBs (γH2AX foci) and that several days later there is an increase in cell proliferation. While isolated bouts of inflammation did not induce HR, overlap between inflammation-induced DNA damage and inflammation-induced cell proliferation induced HR significantly. To study exogenously-induced DNA damage, animals were exposed to methylnitrosourea, a model alkylating agent that creates DNA lesions relevant to both environmental exposures and cancer chemotherapy. We found that exposure to alkylation damage induces HR, and importantly, that inflammation-induced cell proliferation and alkylation induce HR in a synergistic fashion. Taken together, these results show that, during an acute bout of inflammation, there is a kinetic barrier separating DNA damage from cell proliferation that protects against mutations, and that inflammation-induced cell proliferation greatly potentiates exposure-induced mutations. These studies demonstrate a fundamental mechanism by which inflammation can act synergistically with DNA damage to induce mutations that drive cancer and cancer recurrence.


Conflict of interest statement

The authors have declared that no competing interests exist.

Figures

Figure 1
Figure 1. The FYDR mouse detects HR-derived sequence rearrangements in situ in intact tissue.
(A) Schematic of the reconstitution of full-length EYFP coding sequence from two truncated copies through replication fork restart by HR. Note that the appearance of fluorescent signal indicates the gain of one repeat unit (a duplication). Arrows represent expression constructs. EYFP coding sequences are in yellow, promoter and polyadenylation signal sequences are in white, and deleted sequences are in black. Drawing is not to scale. (B) Representative image of a FYDR pancreas showing fluorescent foci detectable in situ in intact tissue. Freshly harvested, unfixed whole pancreas was counterstained with Hoechst, compressed to 0.5 mm and imaged under an epifluorescent microscope. Fluorescence is pseudocolored. Original magnification, ×1. Scale bar = 1 cm. (C) Cluster of recombinant cells at ×60 original magnification. Fluorescence is pseudocolored. (D) A recombinant pancreatic acinar cell identified by the overlay of EYFP fluorescence and H&E staining. Fluorescence is pseudocolored. Original magnification, ×40. (E) The model alkylating agent MNU induces HR in the pancreas. Mice received 25 mg/kg MNU i.p., and HR was evaluated 3 to 5 weeks after treatment. Frequencies of recombinant foci per cm2 tissue area are significantly greater in MNU-treated mice (n = 15) than in control mice (n = 16). Boxes show 25th and 75th percentiles, medians are indicated by horizontal lines. * P < 0.05 (Mann–Whitney U-test).
Figure 2
Figure 2. Cerulein treatment induces inflammation in the pancreas, and chronic cerulein pancreatitis induces metaplastic changes.
(A) Tissue sections from pancreata of control mice show normal pancreas architecture. (B) Acute cerulein treatment induces pancreatic inflammation evidenced by edema and an inflammatory infiltrate. (C) Severity of cerulein-induced inflammation as determined by a trained pathologist. Inflammation scores are significantly higher in cerulein-treated mice (n = 30) than in control mice (n = 30). Data are mean ± SEM. *** P < 0.001 (Student’s t-test). (D) Pancreas section from a mouse treated with cerulein for 6 months shows chronic pancreatic inflammation, edema, significant acinar loss, and acinar to ductal metaplasia (arrows). (E) Quantification of metaplastic changes determined by a trained pathologist shows absence of metaplasia in control mice. However, 9 out of 13 mice treated with cerulein for 6 months show metaplastic changes. See Methods for detailed pathological scoring criteria. Statistical testing could not be performed in groups containing only zero values. Panels A,B: Original magnification, ×10. Scale bar = 200 μm. Panel D: Original magnification, ×200. Scale bar = 80 μm.
Figure 3
Figure 3. Independent bouts of inflammation induce DSB formation but not HR.
(A) Immunohistochemical staining for the DSB marker γH2AX (yellow) in pancreas sections. Nuclei were counterstained with DAPI (blue). In control mice, nuclei with γH2AX foci are very rare (Left). However, nuclei with γH2AX foci (arrowhead) appear after independent bouts of inflammation (Right). (B) Quantification of nuclei containing more than five γH2AX foci shows significantly more γH2AX positive nuclei after inflammation (n = 6) than in control animals (n = 6). Data are mean ± SEM. *** P < 0.001 (Student’s t-test). (C) Numbers of fluorescent foci in the pancreas are not different between control mice (n = 17) and mice that underwent repeated acute inflammation (n = 17). Symbols represent data from individual mice, horizontal bars show medians. ns, not statistically significant (Mann–Whitney U-test). (D) No statistically significant difference in the frequencies of fluorescent cells in the pancreas between control mice (n = 17) and mice that underwent repeated acute inflammation (n = 17). Pancreata were disaggregated into single-cell suspensions and the frequencies of fluorescent cells were determined by flow cytometry. Symbols represent data from individual mice, horizontal bars show median values. ns, not statistically significant (Mann–Whitney U-test).
Figure 4
Figure 4. Inflammation and regenerative cell proliferation are separated in acute cerulein pancreatitis.
(A) Pancreas from control mouse showing normal tissue architecture with no detectable histological changes. (B) 12 hours after acute cerulein treatment, the pancreas shows histological signs of acute pancreatitis, such as edema and an inflammatory infiltrate. (C) Five days after acute cerulein treatment, inflammation is no longer detected and histology is comparable to healthy tissue. (D) Low Ki-67 staining indicates low proliferative activity in control pancreata. (E) Ki-67 staining remains low during acute pancreatitis, indicating no increase in cell proliferation during acute inflammation. (F) Five days after acute cerulein treatment, increased Ki-67 staining indicates increased cell proliferation during tissue regeneration. (G) Quantification of Ki-67 labeling shows significantly higher proliferation in regenerating tissue. Data are mean ± SEM in control mice (n = 16) and in mice with acute pancreatitis (n = 16). *** P < 0.001, Student’s t-test. (H) Increased cell proliferation during regeneration from acute pancreatitis is indicated by increased BrdU labeling. Five days after acute pancreatitis or mock treatment, mice received BrdU (75 mg/kg i.p.) to label newly replicated DNA in proliferating cells. Pancreata were harvested 4 hours later, disaggregated, and the frequencies of BrdU labeled cells were determined by antibody staining and flow cytometry. Data are mean ± SEM in control mice (n = 5) and in mice with acute pancreatitis (n = 5). ** P < 0.01, Student’s t-test. Panels B,C,D: Original magnification, ×10. Scale bar = 200 μm. Panels E,F,G: Original magnification, ×20. Scale bar = 100 μm.
Figure 5
Figure 5. Independent and overlapping bouts of pancreatic inflammation.
(A) For independent bouts of inflammation, three acute cerulein pancreatitis events were induced two weeks apart, and inflammation and proliferation were assessed at the second (analysis time A) and third (analysis time C) bout of inflammation. HR was quantified 10 to 15 days after the last pancreatitis event. (B) For overlapping bouts of inflammation, three acute cerulein pancreatitis events were induced on days 1, 4 and 9. Inflammation and proliferation were assessed at the second (analysis time B) and third (analysis time D) bout of inflammation. HR was quantified 10 to 15 days after the last pancreatitis event. (C) Pancreas section from a control mouse shows healthy tissue. (D,E) Treatment with cerulein (both independent and overlapping) results in edema and an inflammatory infiltrate chiefly of neutrophils, indicating acute inflammation. (F) Ki-67 immunohistochemistry shows low levels of baseline proliferation in control pancreata. (G) Cell proliferation remains low in the pancreas during acute inflammation. (H) During regeneration from acute inflammation, Ki-67 positive nuclei appear, indicating regenerative proliferation. (I) Immunohistochemical detection of γH2AX phosphorylation in pancreas sections show low levels of DSBs in healthy pancreata. (J) During independent bouts of inflammation, nuclei with γH2AX foci (arrowhead) become apparent. (K) During overlapping bouts of inflammation, more γH2AX positive nuclei are visible. (C-E) Original magnification, ×10. Scale bar = 200 μm. (F-H) Original magnification, ×20. Scale bar = 100 μm. (I-K) Original magnification, ×40.
Figure 6
Figure 6. Overlapping bouts of inflammation induce more DSBs than independent bouts of inflammation.
Inflammation, cell proliferation and γH2AX foci formation were quantified in pancreas sections from mice treated with independent bouts of inflammation (blue bars) and with overlapping bouts of inflammation (purple bars). (A,B) Cerulein induces inflammation in both independent (n = 7) and overlapping (n = 8) treatment regimens. Severity of inflammation in control and cerulein-treated mice was quantified by a trained pathologist. (C, D) Quantification of nuclei positive for the proliferation marker Ki-67 shows a moderate increase in independent bouts of inflammation (n = 7), and a large increase in overlapping bouts of inflammation (n = 8). (E,F) Quantification of nuclei positive for the DSB marker γH2AX (nuclei with >5 foci) shows a moderate increase in independent bouts of inflammation (n = 3), and a large increase in overlapping bouts of inflammation (n = 3). Data are mean ± SEM. See Methods for detailed pathological scoring criteria. Statistical testing could not be performed in groups containing only zero values. * P < 0.05; ** P < 0.01, *** P < 0.001 (Student’s t-test).
Figure 7
Figure 7. Simultaneous inflammation and cell proliferation induces HR in the pancreas.
(A) Representative images from pancreata of control mice (Top) and mice that experienced combined proliferation and inflammation (Bottom). Freshly harvested whole organs were compressed between glass coverslips and imaged under an epifluorescent microscope. Representative details of composite images are shown, fluorescent foci are apparent in situ. More foci are visible in the pancreas from the proliferation plus inflammation group. Brightness and contrast have been enhanced identically. (B) Numbers of fluorescent foci are higher in mice that experienced combined proliferation and inflammation (n = 18) than in control mice (n = 17). Symbols represent data from individual mice, horizontal bars show medians. **, P < 0.01, (Mann–Whitney U-test). (C) Higher fluorescent cell frequency in the pancreata of mice that experienced combined proliferation and inflammation (n = 18) than in control mice (n = 17). Pancreata were disaggregated into single-cell suspensions and the frequencies of fluorescent cells were determined by flow cytometry. Symbols represent data from individual mice, horizontal bars show median values. *, P < 0.05 (Mann–Whitney U-test).
Figure 8
Figure 8. Inflammation-associated cell proliferation potentiates the effect of exogenous DNA damage on DNA rearrangements.
(A) Treatment scheme. Mice were subjected to a single acute cerulein pancreatitis event or mock treatment. At the peak of replacement proliferation, mice received MNU (25 mg/kg i.p.) or mock treatment. 3 to 4 weeks after MNU injection, mice were humanely sacrificed for HR analysis. (B) Replacement proliferation in the pancreas is indicated by increased Ki-67 expression. Five days after acute pancreatitis or mock treatment, pancreata were harvested and processed for Ki-67 immunohistochemistry. Data are mean ± SEM in control mice (n = 7) and in mice with acute pancreatitis (n = 8). ** P < 0.01, Student’s t-test. (C) Representative images from pancreata after inflammation and/or exogenous DNA damage. Freshly harvested whole organs were compressed between glass coverslips and imaged under an epifluorescent microscope. Representative details of composite images are shown, fluorescent foci are apparent in situ. More foci are visible after treatment with MNU, and a large increase is evident after treatment with MNU during regenerative proliferation (Inflamm+MNU panel). (D) Quantification of fluorescent foci in pancreata after inflammation and/or exogenous DNA damage. The number of fluorescent foci is significantly higher in MNU-treated mice (n = 15) than in control mice (n = 16), but there is no statistically significant increase after a single acute inflammation event (n = 18). However, there is a large increase in the number of foci after treatment with MNU during regenerative proliferation (Inflamm + MNU, n = 15). Symbols represent data from individual mice, horizontal bars show median values in each group. *, P < 0.05; ***, P < 0.001 (Mann–Whitney U-test).
Figure 9
Figure 9. Model for the potentiation of sequence rearrangements induced by endogenous and exogenous DNA damage by inflammation-associated cell proliferation.
Cell proliferation associated with inflammation may be induced by RONS released from inflammatory cells. Regeneration after inflammation also involves cell proliferation to replenish cells lost to inflammation-induced tissue damage. DNA replication is increased in proliferation, and DNA damage during replication can lead to fork breakdown and the formation of DSBs. These DSBs are repaired by HR, but HR can result in LOH, sequence rearrangements, and point mutations. Thus, cell proliferation potentiates the deleterious effect of both endogenous (RONS-induced) and exogenous (exposure-induced) DNA damage, potentially contributing to cancer initiation and recurrence. See text for details.

References

    1. Friedberg EC, Walker GC, Siede W, Wood RD, Schultz R, and Ellenberger T. (2006). DNA repair and mutagenesis. ASM Press, Washington, DC, USA.
    1. Coussens LM, Werb Z. (2002) Inflammation and cancer. Nature 420: 860–7. 10.1038/nature01322 - DOI - PMC - PubMed
    1. Colotta F, Allavena P, Sica A, Garlanda C, Mantovani A. (2009) Cancer-related inflammation, the seventh hallmark of cancer: links to genetic instability. Carcinogenesis 30: 1073–81. 10.1093/carcin/bgp127 - DOI - PubMed
    1. Hussain SP, Hofseth LJ, Harris CC. (2003) Radical causes of cancer. Nat Rev Cancer. 3: 276–85. 10.1038/nrc1046 - DOI - PubMed
    1. Grivennikov SI, Greten FR, Karin M. (2010) Immunity, inflammation, and cancer. Cell. 140: 883–99. 10.1016/j.cell.2010.01.025 - DOI - PMC - PubMed

Publication types