. 2015 Feb 3;11(2):e1004961.
doi: 10.1371/journal.pgen.1004961. eCollection 2015 Feb.

Membrane recognition and dynamics of the RNA degradosome

Affiliations

Membrane recognition and dynamics of the RNA degradosome

Henrik Strahl et al. PLoS Genet. .

Abstract

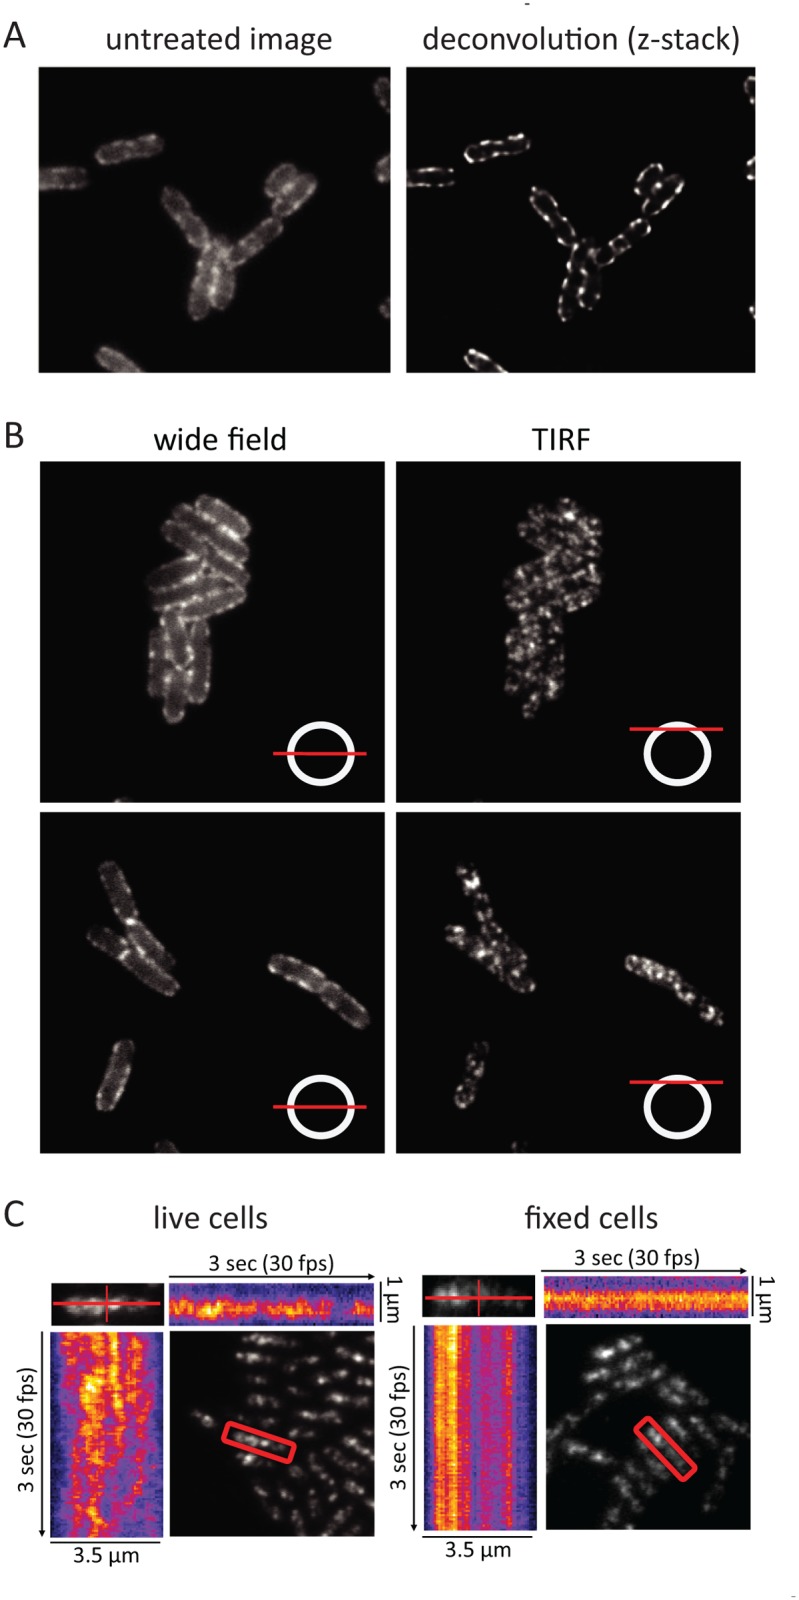
RNase E, which is the central component of the multienzyme RNA degradosome, serves as a scaffold for interaction with other enzymes involved in mRNA degradation including the DEAD-box RNA helicase RhlB. Epifluorescence microscopy under live cell conditions shows that RNase E and RhlB are membrane associated, but neither protein forms cytoskeletal-like structures as reported earlier by Taghbalout and Rothfield. We show that association of RhlB with the membrane depends on a direct protein interaction with RNase E, which is anchored to the inner cytoplasmic membrane through an MTS (Membrane Targeting Sequence). Molecular dynamics simulations show that the MTS interacts with the phospholipid bilayer by forming a stabilized amphipathic α-helix with the helical axis oriented parallel to the plane of the bilayer and hydrophobic side chains buried deep in the acyl core of the membrane. Based on the molecular dynamics simulations, we propose that the MTS freely diffuses in the membrane by a novel mechanism in which a large number of weak contacts are rapidly broken and reformed. TIRFm (Total Internal Reflection microscopy) shows that RNase E in live cells rapidly diffuses over the entire inner membrane forming short-lived foci. Diffusion could be part of a scanning mechanism facilitating substrate recognition and cooperativity. Remarkably, RNase E foci disappear and the rate of RNase E diffusion increases with rifampicin treatment. Control experiments show that the effect of rifampicin is specific to RNase E and that the effect is not a secondary consequence of the shut off of E. coli transcription. We therefore interpret the effect of rifampicin as being due to the depletion of RNA substrates for degradation. We propose a model in which formation of foci and constraints on diffusion arise from the transient clustering of RNase E into cooperative degradation bodies.


Conflict of interest statement

The authors have declared that no competing interests exist.

Figures

Figure 1
Figure 1. Membrane localization of RhlB depends on a direct protein-to-protein interaction with RNase E.
Gallery of micrographs showing images of cell expressing RNase E-mCherry and RhlB-CFP. Gene fusions are present as functional single copy chromosome replacements in the NCM3416 background. PC = phase contrast. In this figure, a few cells were chosen from a larger field (S1 Fig.). Wild type, Kti200 strain encoding RNase E-mCherry and RhlB-CFP. RNase E ΔMTS, Kti515 strain encoding a variant with deletion of the segment corresponding to the MTS (RNase E Δ567–582) and RhlB-CFP. RNase E ΔSca, Kti740 strain encoding a variant with deletion of the protein scaffold (RNase E Δ702–1061) and RhlB-CFP. RNase E ΔHBS, Kti738 strain encoding a variant with deletion of the HBS (RNase E Δ705–737) abd RhlB-CFP. Cultures were grown to mid logarithmic phase in MOPS-glycerol-amino acids media at 30°C. The RhlB and RNase E images were made with a 4 s exposure time.
Figure 2
Figure 2. Molecular dynamics simulation of MTS interaction with phospholipid bilayer.
A. Helical wheel representation of E. coli RNase E MTS (Membrane Targeting Sequence). The 15-residue sequence corresponds to residues 568–582 of RNase E. Yellow, hydrophobic residues; blue, basic residues; green, small hydrophilic residues. Molecular dynamics simulations were made with a slightly large peptide that corresponds to residues 565–585 of RNase E. B. Snapshot from molecular dynamics simulation of the interaction of the MTS with phospholipid bilayer. The backbone of the MTS is shown in red, hydrophobic residues in yellow and charged/hydrophilic residues in pink. Water molecules have been masked. The phospholipid bilayer has been sliced transversally (aqua, acyl interior; green, glycerol moieties; brown, phosphate moieties; turquoise, ethanolamine moieties). A molecular graphics movie of the simulation is provided (S1 Video). C. Depth of insertion of the wild type MTS peptide and variants into the phospholipid bilayer. Depth (ordinate) corresponds to distance from the plane of the phospholipid bilayer. The sequence (abscissa) corresponds to the region of RNase E containing the MTS. The sequence underlined in blue corresponds to the phylogenetically conserved element (residues 568–582 of RNase E) that was shown experimentally to have the propensity to form an α-helix upon interaction with the membrane [6]. WT = wild type sequence (black line). Sequence variants: AA, F574A/F575A (red line); E, F575E (green line); P, insertion of proline between F574 and F575 (blue line). The depth of the inserted proline is shown by the additional point on the blue line. D. Binding of fluorescein-labelled peptides corresponding to wild type MTS and AA variant (F574A/F575A) to liposomes prepared from E. coli lipid extracts. i) Large field image of phospholipid vesicles in the absence of peptide. ii) Vesicles in the presence of peptide. iii) Quantification of fluorescence intensity along the lines traced in ii). The higher background in the right image (AA variant) is due to unbound peptide.
Figure 3
Figure 3. RNase E localization and mobility. Images are of the KSL2000/pVK207 strain, which expresses RNase E-YFP.
Cultures were grown to mid logarithmic phase in LB at 30°C. A. Confocal microscopy of cells fixed with formaldehyde and spotted onto agarose pads. Left, image without deconvolution; right, deconvolution of the z-stack. B. Wide field and TIRF images of live cells spotted onto agarose pads. The diagram in the lower right hand corner of each image indicates the plane of focus. In these images, an exposure time of 100 ms was used to minimize distortion due to RNase E diffusion during the acquisition. C. Kymograms of RNase E mobility derived from TIRFm videos of RNase E-YFP. Left panel, live cells; right panel, formaldehyde fixed cells. The kymograms are based on a video that was made at 30 frames/sec for 3 sec (S2 Video). A single cell was scanned along its long and short axes in each frame to quantify fluorescence intensity. The scans were accumulated to generate heat maps in which the YFP signal is represented as a function of time and position in the cell.
Figure 4
Figure 4. Rifampicin treatment inhibits formation of RNase E foci. Images are of the KSL2000/pVK207 strain, which expresses RNase E-YFP.
Cultures were grown to mid logarithmic phase in LB at 30°C.A. Epifluorescence images showing localization of RNase E-YFP before and after treatment with rifampicin. B. Distribution of RNase E-YFP on the cytoplasmic membrane before and after treatment with rifampicin. The blue and red lines correspond to traces that were scanned to determine the fluorescence intensity. The graph shows the quantification of the scans. C. Statistical analysis of a field of cells before and after treatment with rifampicin. All cells in a field were scanned as described in panel B. Both sides of the cell were scanned except when one cell was adjacent to another. In that case, neither of the adjacent sides were scanned. A field of 83 cells (-rifampicin) yielded 118 line scans; a field of 90 cells (+rifampicin) yielded 136 line scans. The scans were analyzed to generate plots of average pixel intensity and variance in pixel intensity. The horizontal line in each plot indicates the median.
Figure 5
Figure 5. Rifampicin treatment increases the diffusion rate of RNase E.
Images are of the KSL2000/pVK207 strain, which expresses RNase E-YFP. Cultures were grown to mid logarithmic phase in LB at 30°C. A. TIRFm images of live cells: 100 ms exposures, +/- 200 ug/ml rifampicin (10 min). B. TIRFm time lapse showing photobleaching: 100 ms exposures, same contrast for all images. C. Quantification of TIRFm continuous photobleaching. Data points (red or blue) and error bars (vertical gray lines) correspond to averaged, background subtracted and normalized intensities of the individual cells in the field. The number of cells in the field (n) is indicated in the upper right hand corner of the panel. Curves were fitted as two phase exponential decay using the following constraints: initial intensity = 100, decay to 0, shared fast decay rate (GFP bleach). Black dashed lines are the curve fits. The table gives the slow diffusion limited rate constant (K), standard error of the curve fit (SEM), goodness of fit (R2) and number of cells analyzed (n). See [21] for more detail regarding determination of relative diffusion rates.
Figure 6
Figure 6. The effect rifampicin on the distribution and diffusion of RNase E is due to the absence of RNA substrate.
Images are of the ENS134/pVK207 strain, which expresses RNase E-YFP. Cultures were grown to mid logarithmic phase in LB at 30°C. A. Relevant features of the ENS134 strain. The expression of the bacteriophage T7 RNA polymerase, which is under the control of the lac repressor, can be induced with IPTG. The normal chromosomal copy of the lacZ gene is inactivated. The lacZ-tRNA transcript is under the control of a bacteriophage T7 promoter. The induction of T7 RNA polymerase synthesis by IPTG leads to transcription of lacZ-tRNA. If rifampicin is added after induction of T7 RNA polymerase, then E. coli transcription is shut off, but lacZ-tRNA synthesis continues since the T7 RNA polymerase is insensitive to rifampicin. RNase E acts on the lacZ-tRNA in two processes: it initiates the degradation of the lacZ mRNA and it is involved in the maturation of the tRNA. B. Epifluorescence images of cells after treatment with IPTG (1 mM, 10 min) and/or rifampicin (200 µg/ml, 10 min). In experiments where both compounds were added, the cells were treated first with IPTG, then with rifampicin. C. Analysis of cell fields corresponding to the conditions in panel B. The plots showing average pixel intensity and the variance were generated as described in Fig. 4. The horizontal lines indicate the median of average pixel intensity or variance. D. Quantification of TIRFm continuous photobleaching as described in Fig. 5. In the upper right hand corner, the different conditions are color coded; n indicates the number of cells that were in the field.

Similar articles

Cited by

References

    1. Gorna MW, Carpousis AJ, Luisi BF (2012) From conformational chaos to robust regulation: the structure and function of the multi-enzyme RNA degradosome. Q Rev Biophys 45: 105–145. 10.1017/S003358351100014X - DOI - PubMed
    1. Bandyra KJ, Bouvier M, Carpousis AJ, Luisi BF (2013) The social fabric of the RNA degradosome. Biochim Biophys Acta 1829: 514–522. 10.1016/j.bbagrm.2013.02.011 - DOI - PMC - PubMed
    1. Waters LS, Storz G (2009) Regulatory RNAs in bacteria. Cell 136: 615–628. 10.1016/j.cell.2009.01.043 - DOI - PMC - PubMed
    1. Beisel CL, Storz G (2010) Base pairing small RNAs and their roles in global regulatory networks. FEMS Microbiol Rev 34: 866–882. 10.1111/j.1574-6976.2010.00241.x - DOI - PMC - PubMed
    1. Carpousis AJ (2007) The RNA degradosome of Escherichia coli: an mRNA-degrading machine assembled on RNase E. Annu Rev Microbiol 61: 71–87. 10.1146/annurev.micro.61.080706.093440 - DOI - PubMed

Publication types

MeSH terms