. 2015 Apr;14(4):1137-47.
doi: 10.1074/mcp.O114.042259. Epub 2015 Feb 3.

xiNET: cross-link network maps with residue resolution

Affiliations

xiNET: cross-link network maps with residue resolution

Colin W Combe et al. Mol Cell Proteomics. 2015 Apr.

Abstract

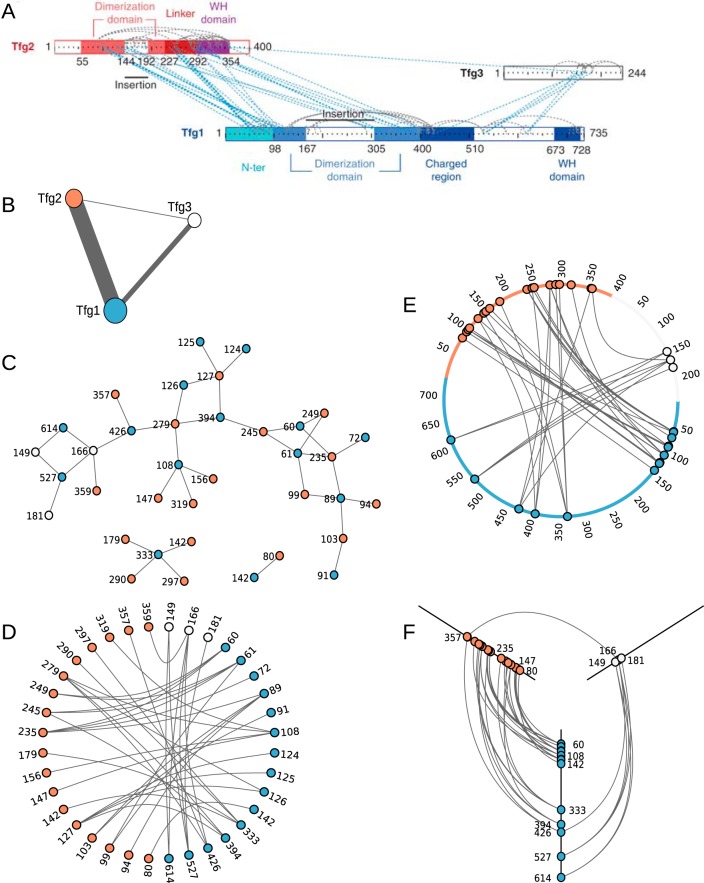
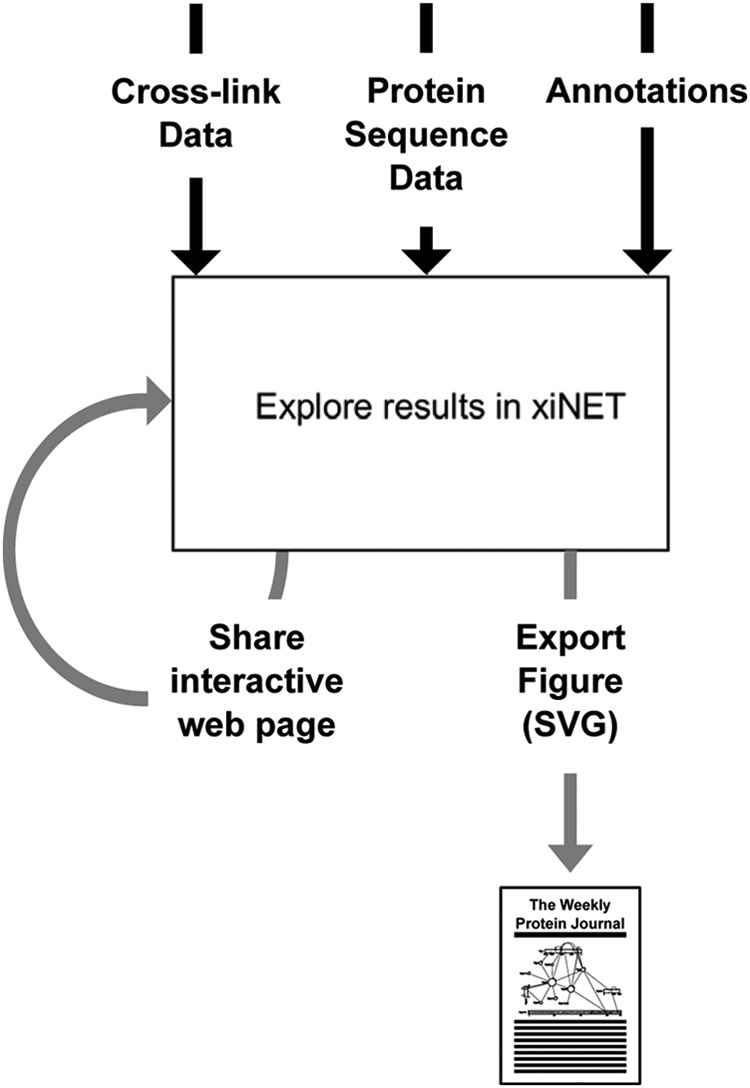
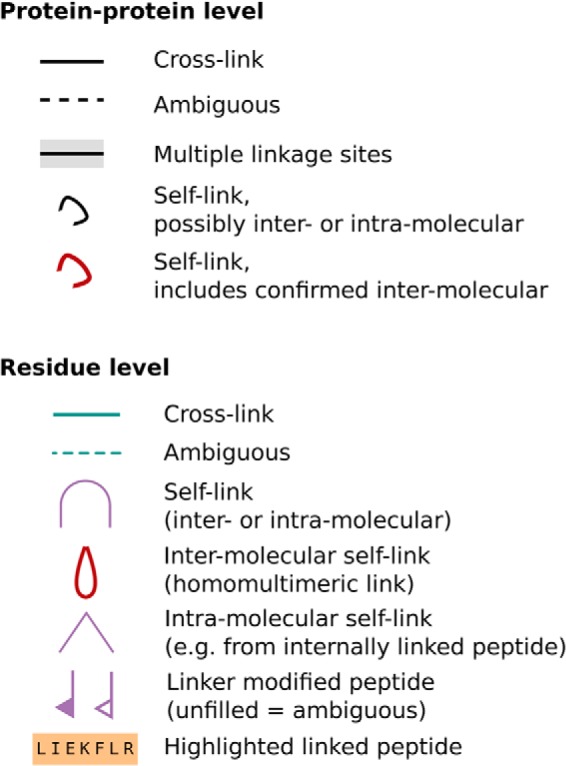
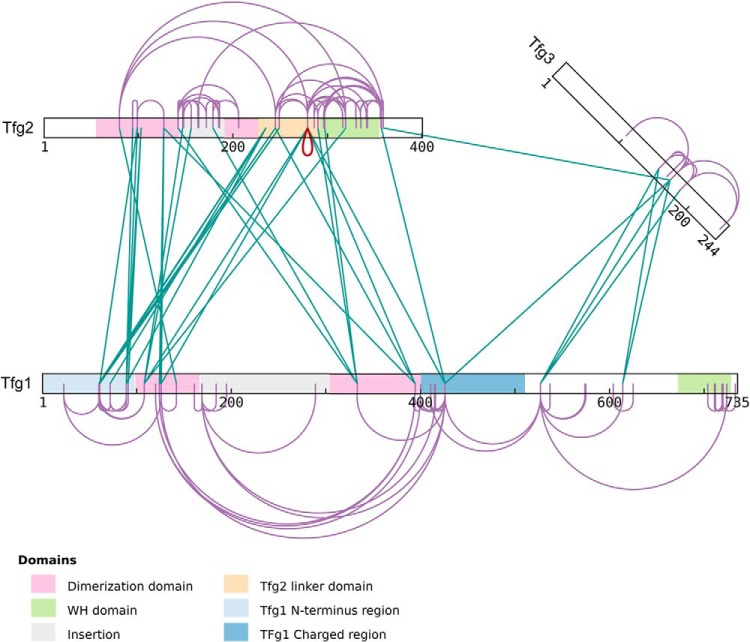
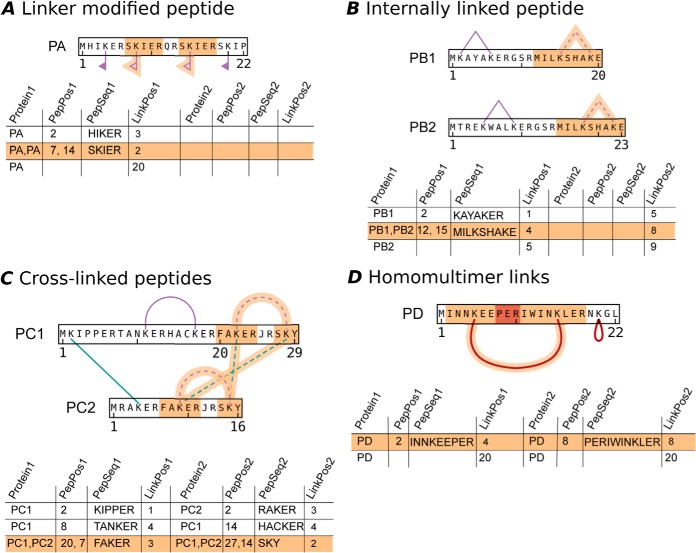
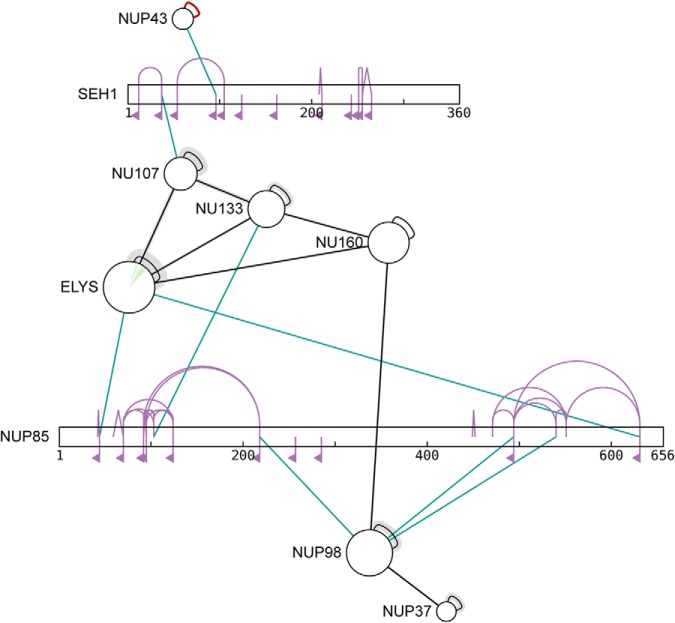
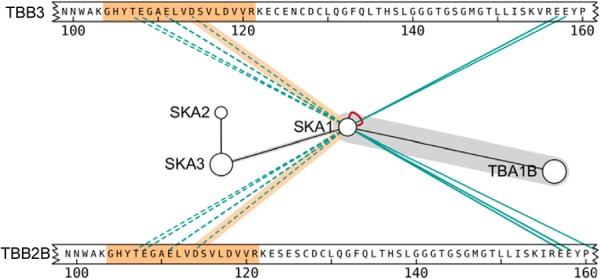
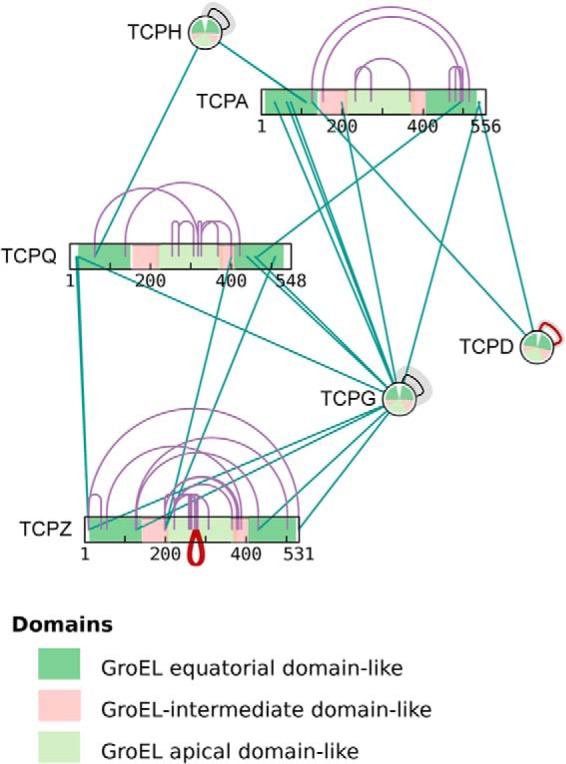
xiNET is a visualization tool for exploring cross-linking/mass spectrometry results. The interactive maps of the cross-link network that it generates are a type of node-link diagram. In these maps xiNET displays: (1) residue resolution positional information including linkage sites and linked peptides; (2) all types of cross-linking reaction product; (3) ambiguous results; and, (4) additional sequence information such as domains. xiNET runs in a browser and exports vector graphics which can be edited in common drawing packages to create publication quality figures.

Availability: xiNET is open source, released under the Apache version 2 license. Results can be viewed by uploading data to http://crosslinkviewer.org/ or by downloading the software from http://github.com/colin-combe/crosslink-viewer and running it locally.


Figures

Fig. 1.
Fig. 1.
Six different node-link diagrams of the same CLMS data. The data is from Chen et al. (1), A, is an extract from that paper designed to show how the CLMS evidence supports the location of a dimerization domain between Tfg1 and Tfg2. B–F, show alternative node-link diagrams (of the interprotein links only) produced using D3 (20). B, shows the typical use of node-link diagrams in biology, where nodes represent whole molecules (line width has been used to represent the number of links). C, uses distinct nodes to represent the linked residues, as is typical of RIN tools such as RINalyzer (12). In the absence of other information to guide the layout, C, uses a force directed layout. D, attempts to bring some order to the layout by arranging the nodes around a circle. E, again uses a circular layout but this time the placement of the nodes on the perimeter is determined by the linked residue's position in the protein sequence. F, shows a HivePlot (16) of the data, in which the categories (axes) represent each of the three proteins and the distance along the axis is determined by residue position in the sequence. A, E and F succeed in making an association between the individual cross-links and domain-level features: B, C, and D do not. To make this association it is necessary to use the position of the linked residues within the overall protein sequence to guide the placement of the nodes.
Fig. 2.
Fig. 2.
Overview of xiNET workflow. Three data sets form the input to a xiNET map: cross-link data (required); protein sequence data (can be omitted if UniProtKB accession numbers are used); and annotation data (optional, will be downloaded automatically if UniProtKB accession numbers are used for protein identifiers). Results can be communicated either by sharing the interactive map via the web or by exporting them as vector graphics that can be edited for use in publications.
Fig. 3.
Fig. 3.
Default key for xiNET figures. Any of the lines representing links may be dashed to indicate the link is ambiguous regarding linkage site. Note that self-links can be ambiguous regarding whether they are intra or intermolecular. The default key can be modified by users/developers to adapt it to their specific representation needs. Typically, such modifications involve assigning line color to an attribute of the cross-links, for example quantitation or confidence attributes.
Fig. 4.
Fig. 4.
TFIIF dimerization domain. Here we see xiNET displaying the data from Fig. 1, this time with self links included. xiNET uses the same numbered bar representation as is found in a variety of cross-linking publications (1, 17, 18, 19). A homomultimeric link (in red) occurs in the data set and xiNET highlights this - this link does not actually help support the conclusions of the original paper and it may be a false identification. The interactive figure can be viewed at http://crosslinkviewer.org/figure4.html.
Fig. 5.
Fig. 5.
The encoding of cross-linking reaction product types in xiNET's CLMS-CSV file format. xiNET displays and distinguishes all three cross-linking reaction product types, these are: A, linker modified peptides; B, internally linked peptides; and, C, cross-linked peptides. The tables show the input data for the example above it. In the input data, the product type is indicated by the presence or absence of information for the second protein and second link position. xiNET also identifies a subset of cross-linked peptides, D homomultimer links, in which the peptides overlap in the protein sequence. The overlapping region is highlighted in red. The tables also include examples in which peptide sequence information is omitted—in this case the columns LinkPos1 and LinkPos2 give the absolute position of the linkage site in the protein sequence. To record ambiguous linkage sites the values in the required columns are made into comma separated lists of alternatives. Note that peptide-level ambiguity must be treated differently depending on whether the product type is an internally linked peptide, B, or cross-linked peptides, C.
Fig. 6.
Fig. 6.
Example containing all three product types. The data pertains to the Human Nuclear Pore Complex, see Bui et al. (19), and xiNET distinguishes the three different product types present in the data. Note also, that the size of a circular node scales with the length of the protein sequence such that doubling the length of a protein leads to doubling the area of a circle. The interactive figure can be viewed at http://crosslinkviewer.org/figure6.html.
Fig. 7.
Fig. 7.
Example of ambiguous CLMS results. Ambiguity regarding the linkage site can occur if, for example, an identified cross-linked peptide belongs to more than one protein in the search space. xiNET uses a dashed line to represent ambiguous linkage sites while highlights on mouse-over are used to show the possible alternatives. The example data shows cross-links between microtubules and the human kinetochore Ska complex (18). The links from SKA1 to residues in the 110–120 range of Tubulin beta-3 chain isoforms TBB3 and TBB2B are all ambiguous; the same identified peptide (highlighted in orange) occurs in both isoforms. The links from SKA1 to residues around 160 in TBB3 and TBB2B are all unambiguous; for these links, all the identified peptides contained residue 155, which distinguishes TBB3 and TBB2B. In the interactive figures (for example http://crosslinkviewer.org/figure7.html), the peptide attached to a particular cross-link is highlighted in orange when the mouse is moved over a link and the highlight is accompanied by a tool-tip giving protein names or ID's, linked residue numbers and the number of supporting peptide-spectrum matches.
Fig. 8.
Fig. 8.
xiNET displays CLMS data in the context of other sequence information. Domains, or other annotated regions, are shown as color-coded segments of the bars or as color-coded sectors of the circles representing proteins. The start and end angles of a sector correspond to the start and end residues of the domain (residue 1 is at 12 o'clock). The data is a subset of the data from Herzog et al. (2). A live example containing the whole dataset can be seen at http://crosslinkviewer.org/figure8.html.

References

    1. Chen Z. A., Jawhari A., Fischer L., Buchen C., Tahir S., Kamenski T., Rasmussen M., Lariviere L., Bukowski-Wills J. C., Nilges M., Cramer P., Rappsilber J. (2010) Architecture of the RNA polymerase II–TFIIF complex revealed by cross-linking and mass spectrometry. EMBO J. 29, 717–726 - PMC - PubMed
    1. Herzog F., Kahraman A., Boehringer D., Mak R., Bracher A., Walzthoeni T., Leitner A., Beck M., Hartl F. U., Ban N., Malmström L., Aebersold R. (2012) Structural probing of a protein phosphatase 2a network by chemical cross-linking and mass spectrometry. Science 337, 1348–1352 - PubMed
    1. Zheng C., Yang L., Hoopmann M. R., Eng J. K., Tang X., Weisbrod C. R., Bruce J. E. (2011) Cross-linking measurements of in vivo protein complex topologies. Mol. Cell. Proteomics 10, M110.006841–M110.006841 - PMC - PubMed
    1. Gehlenborg N., Wong B. (2012) Points of view: Networks. Nat. Methods 9, 115. - PubMed
    1. Seebacher J., Mallick P., Zhang N., Eddes J. S., Aebersold R., Gelb M. H. (2006) Protein cross-linking analysis using mass spectrometry, isotope-coded cross-linkers, and integrated computational data processing. J. Proteome Res. 5, 2270–2282 - PubMed

Publication types

MeSH terms

LinkOut - more resources