. 2015 Apr 1;308(7):E592-602.
doi: 10.1152/ajpendo.00437.2014. Epub 2015 Feb 3.

Human islet preparations distributed for research exhibit a variety of insulin-secretory profiles

Affiliations

Human islet preparations distributed for research exhibit a variety of insulin-secretory profiles

Nora S Kayton et al. Am J Physiol Endocrinol Metab. .

Abstract

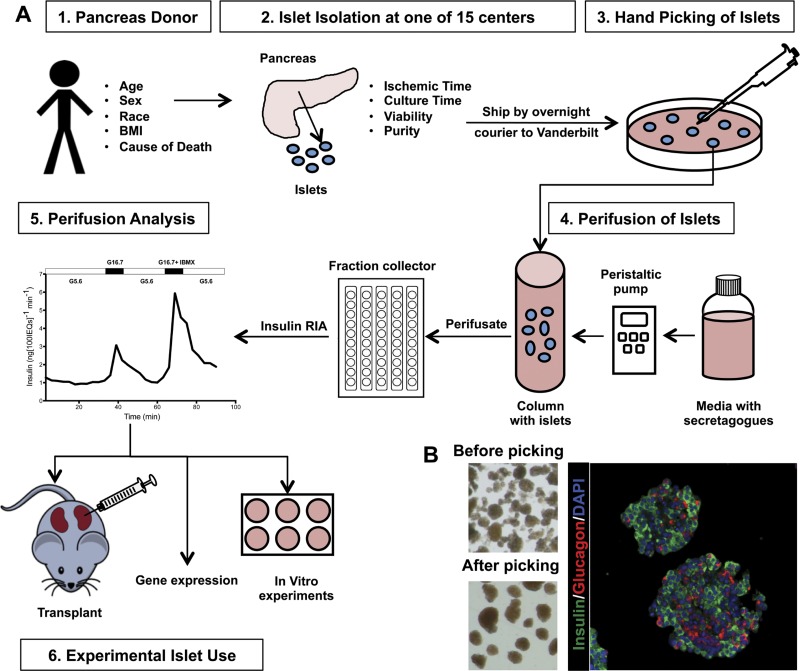
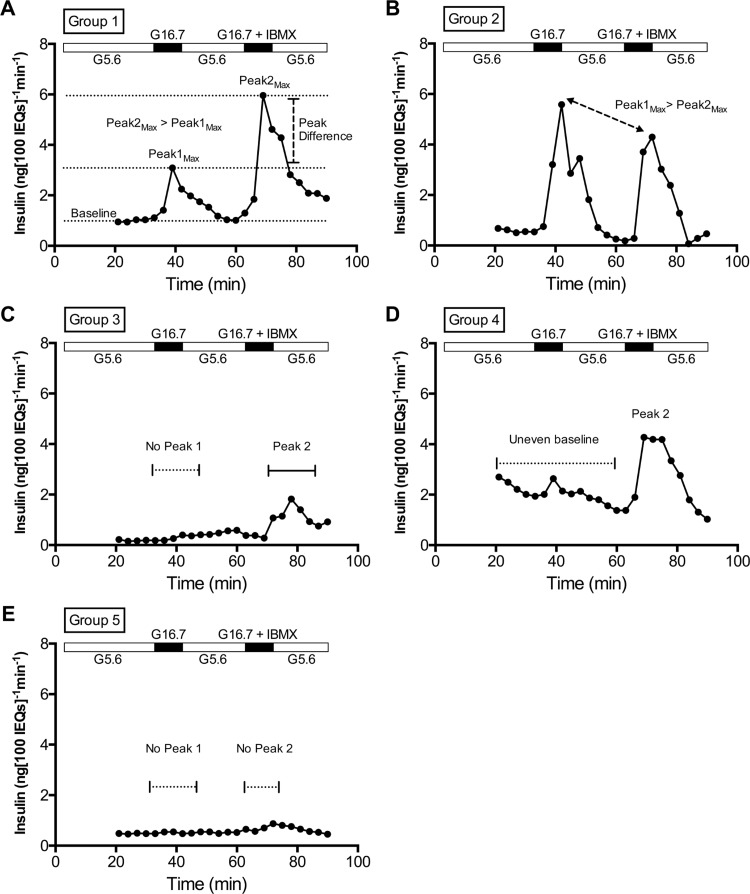
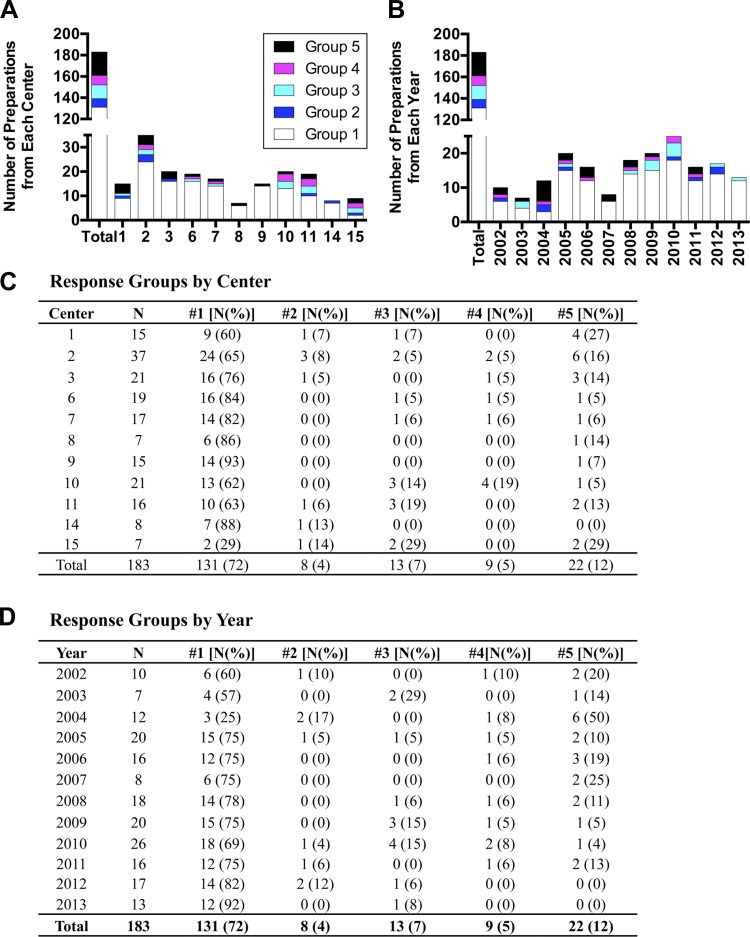
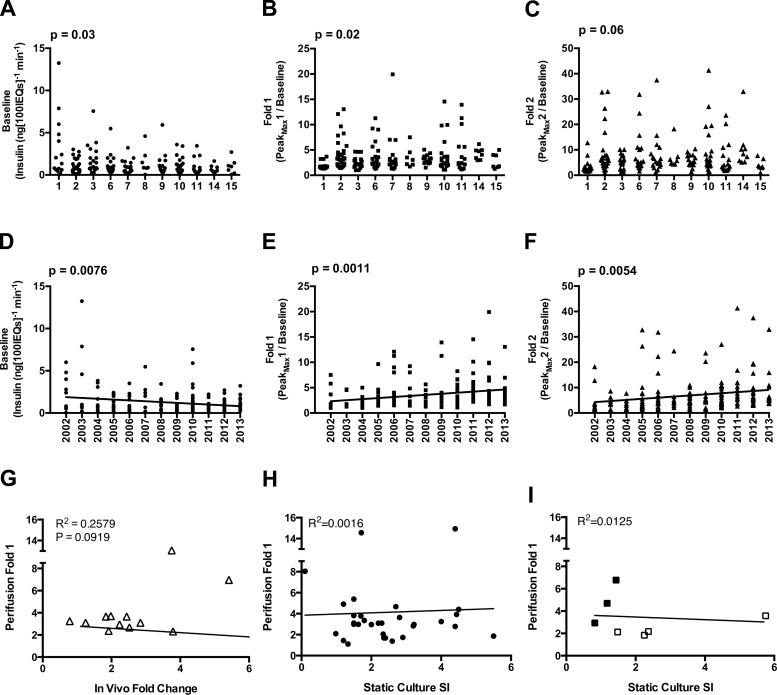
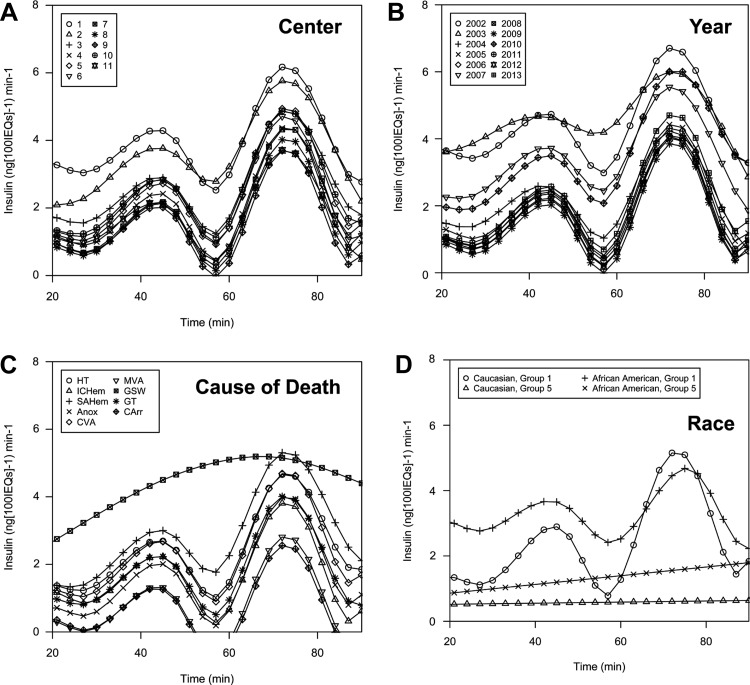
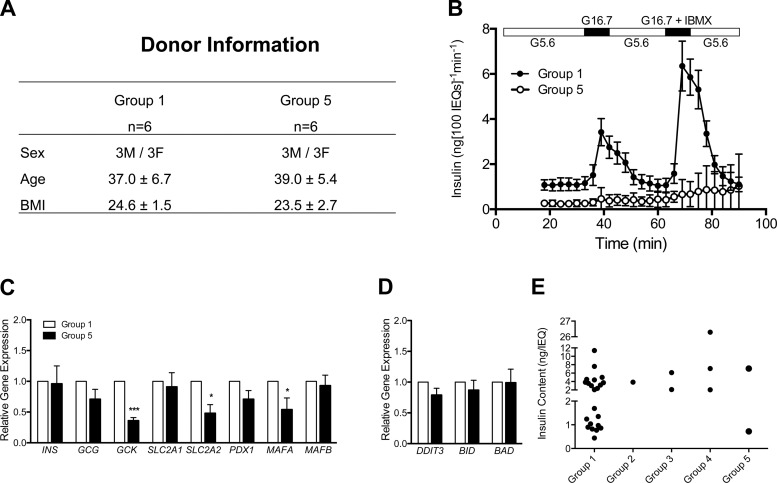
Human islet research is providing new insights into human islet biology and diabetes, using islets isolated at multiple US centers from donors with varying characteristics. This creates challenges for understanding, interpreting, and integrating research findings from the many laboratories that use these islets. In what is, to our knowledge, the first standardized assessment of human islet preparations from multiple isolation centers, we measured insulin secretion from 202 preparations isolated at 15 centers over 11 years and noted five distinct patterns of insulin secretion. Approximately three quarters were appropriately responsive to stimuli, but one quarter were dysfunctional, with unstable basal insulin secretion and/or an impairment in stimulated insulin secretion. Importantly, the patterns of insulin secretion by responsive human islet preparations (stable Baseline and Fold stimulation of insulin secretion) isolated at different centers were similar and improved slightly over the years studied. When all preparations studied were considered, basal and stimulated insulin secretion did not correlate with isolation center, biological differences of the islet donor, or differences in isolation, such as Cold Ischemia Time. Dysfunctional islet preparations could not be predicted from the information provided by the isolation center and had altered expression of genes encoding components of the glucose-sensing pathway, but not of insulin production or cell death. These results indicate that insulin secretion by most preparations from multiple centers is similar but that in vitro responsiveness of human islets cannot be predicted, necessitating preexperimental human islet assessment. These results should be considered when one is designing, interpreting, and integrating experiments using human islets.

Keywords: function; human; islet.


Figures

Fig. 1.
Fig. 1.
Order of events for assessing human pancreatic islets. A: islets isolated from donor pancreata at isolation centers were shipped by overnight courier to Vanderbilt, where they were hand-picked for further purity and IEQ quantification. Islets were perifused to assess in vitro function. Islets were used for subsequent studies that are not part of the current report. B: images showing a human islet preparation before (top left) and after (top right) hand picking. Immunolabeling of human islets for DAPI (blue), insulin (green), and glucagon (red) embedded in collagen gel (far right).
Fig. 2.
Fig. 2.
Definitions of in vitro response groups. Perifusion of human islets with the following order of stimuli in media: 5.6 to 16.7 mM glucose, back to 5.6 mM glucose, then to 16.7 mM glucose with IBMX. From the entire body of perifusion data, 5 general response groups emerged. A–E: real curves from representative preparations, illustrating characteristics of each Group. A: Group 1 had 2 stimulation peaks (16.7 mM glucose + IBMX induces a higher Peakmax than 16.7 mM glucose alone) and a stable Baseline. B: Group 2 differed from Group 1 by having a higher Peak1max (in response to 16.7 mM glucose) than Peak2max (in response to 16.7 mM glucose + IBMX). C: Group 3 had no Peak1 but did have a Peak2. D: Group 4 had an uneven Baseline but has one or both Peaks. E: Group 5 was considered nonresponsive, because it had neither Peak1 nor Peak2.
Fig. 3.
Fig. 3.
Distribution of response groups among isolation centers and across year of isolation. Distribution of response groups by Center (A) or Year (B), and actual values for Center (C) and Year (D).
Fig. 4.
Fig. 4.
Effects of isolation Year and Center on in vitro and in vivo responsiveness. A–C: univariate analyses of Center vs. Baseline (A), Fold 1 (B), and Fold 2 (C). D–F: linear regression analysis of Year vs. Baseline (D), Fold 1 (E), and Fold 2 (F). G: plot of Fold 1 values from perifusion (Perifusion Fold 1) against in vivo Fold change, measured via glucose-arginine stimulation. Basal human insulin values measured in mouse plasma after 6-h fast. Stimulated insulin values measured 15 min after injection of glucose-arginine; n = 12. H: Perifusion Fold 1 values graphed against static culture stimulation index (SI), the ratio of insulin secretion at high glucose to secretion at low glucose, as reported by isolation centers to the IIDP; n = 30. I: plot of Perifusion Fold 1 vs. Static Culture SI from static culture performed in our laboratory. Previously published data points are represented by open squares (10); newly procured data points are closed squares (see research design and methods).
Fig. 5.
Fig. 5.
Fitted spline analysis of perifusion data. A–C: smoothed average curve fits for response by (A) Center, (B) Year, and (C) Cause of Death. D: fitted differences between Group 1 and Group 5 islet preparations by Race (Caucasian and African American). HT, head trauma; ICHem, intracerebral hemorrhage; SAHem, subarachnoid hemorrhage; Anox, anoxia; CVA, cerebrovascular accident; MVA, motor vehicle accident; GSW, gunshot wound; GT, general trauma; CArr, cardiac arrest.
Fig. 6.
Fig. 6.
Gene expression in Group 1 and Group 5 islets. A: islets from 6 Group 1 and 6 Group 5 preparations were matched for Sex, Age, and BMI. B: perifusion results. Plotted insulin concentration (ng/100 IEQ/min) values for all collected media fractions, n = 6 for each group. These Group 1 preparations were a subset of a previously published data set (10). C and D: expression of islet-enriched (C) and apoptosis (D) genes quantified by RT-PCR. Gene transcript levels expressed relative to Group 1 values, n = 6 for each group. E: insulin content (ng/IEQ) of aliquots from 30 human islet preparations, separated by response group (Groups 1–5) (not same 30 islet preparations as in Fig. 4H).

References

    1. Andrali SS, Virostko J, Henske J, Vanderford NL, Vinet L, Özcan S, Lamprianou S, Dai C, Radhika A, Baldwin RM, Ansari MS, Hefti F, Skovronsky D, Kung HF, Herrera PL, Peterson TE, Meda P, Powers AC. Multimodal image coregistration and inducible selective cell ablation to evaluate imaging ligands. Proc Natl Acad Sci USA 108: 20719–20724, 2011. - PMC - PubMed
    1. Avrahami D, Changhong L, Yu M, Jiao Y, Zhang J, Naji A, Ziaie S, Glaser B, Kaestner KH. Targeting the cell cycle inhibitor p57Kip2 promotes adult human β cell replication. J Clin Invest 124: 670, 2014. - PMC - PubMed
    1. Bentsi-Barnes K, Doyle ME, Abad D, Kandeel F, Al-Abdullah IH. Detailed protocol for evaluation of dynamic perifusion of human islets to assess β-cell function. Islets 3: 284, 2011. - PMC - PubMed
    1. Bramswig NC, Everett LJ, Schug J, Dorrell C, Liu C, Luo Y, Streeter PR, Naji A, Grompe M, Kaestner KH. Epigenomic plasticity enables human pancreatic α to β cell reprogramming. J Clin Invest 123: 1275–1284, 2013. - PMC - PubMed
    1. Brissova M, Aamodt K, Brahmachary P, Prasad N, Hong JY, Dai C, Mellati M, Shostak A, Poffenberger G, Aramandla R, Levy SE, Powers AC. Islet microenvironment, modulated by vascular endothelial growth factor-A signaling, promotes β cell regeneration. Cell Metab 19: 498–511, 2014. - PMC - PubMed

Publication types