

SMAD3 negatively regulates serum irisin and skeletal muscle FNDC5 and peroxisome proliferator-activated receptor γ coactivator 1-α (PGC-1α) during exercise
- PMID: 25648888
- PMCID: PMC4367270
- DOI: 10.1074/jbc.M114.617399
SMAD3 negatively regulates serum irisin and skeletal muscle FNDC5 and peroxisome proliferator-activated receptor γ coactivator 1-α (PGC-1α) during exercise
Erratum in
-
SMAD3 negatively regulates serum irisin and skeletal muscle FNDC5 and peroxisome proliferator-activated receptor γ coactivator 1-α (PGC-1α) during exercise.J Biol Chem. 2015 May 1;290(18):11431. doi: 10.1074/jbc.A114.617399. J Biol Chem. 2015. PMID: 25934839 Free PMC article. No abstract available.
Abstract
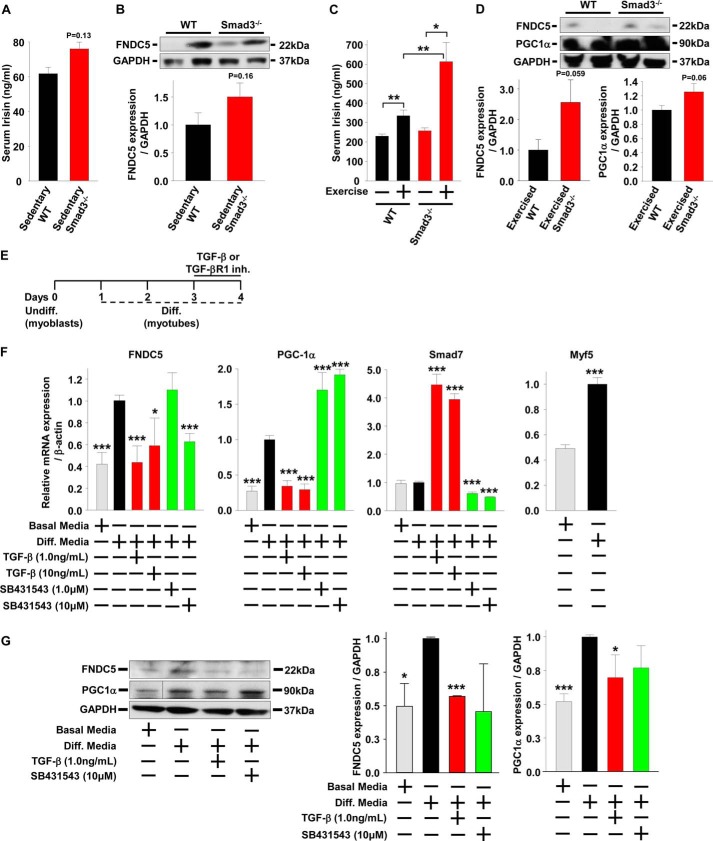
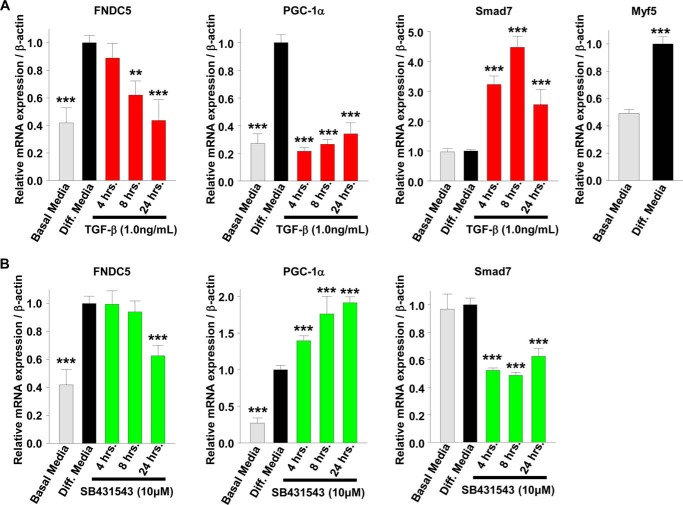
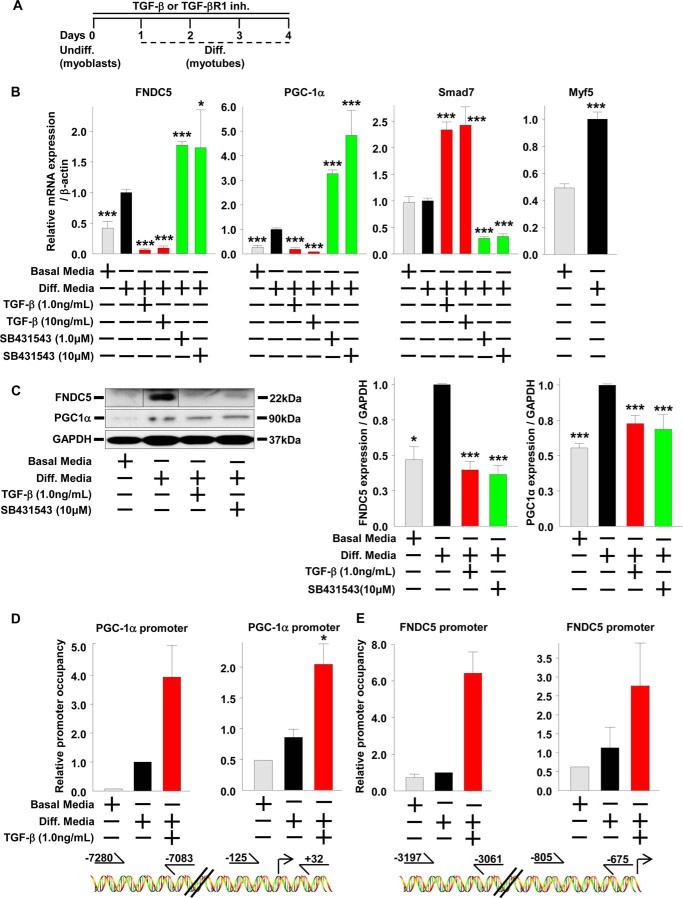
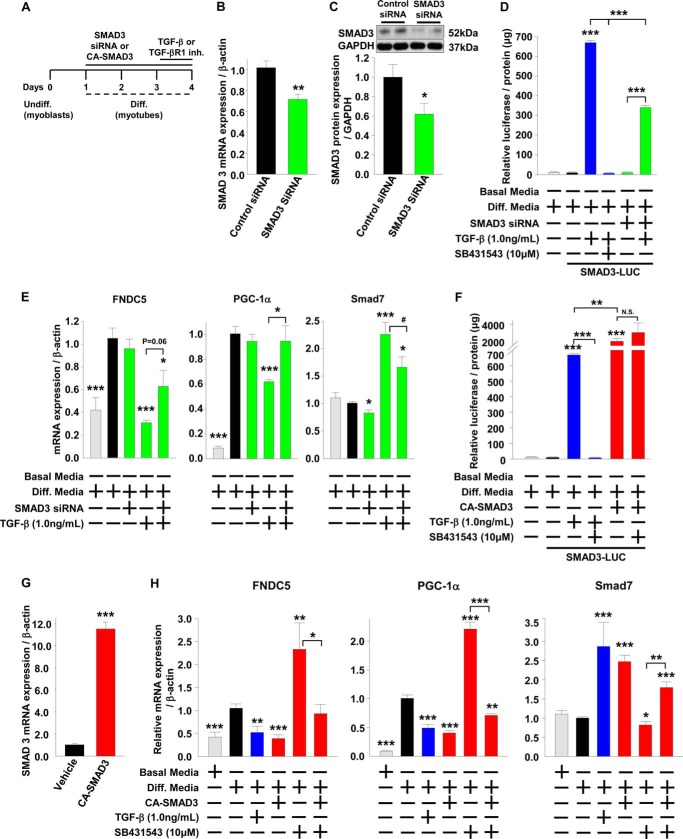
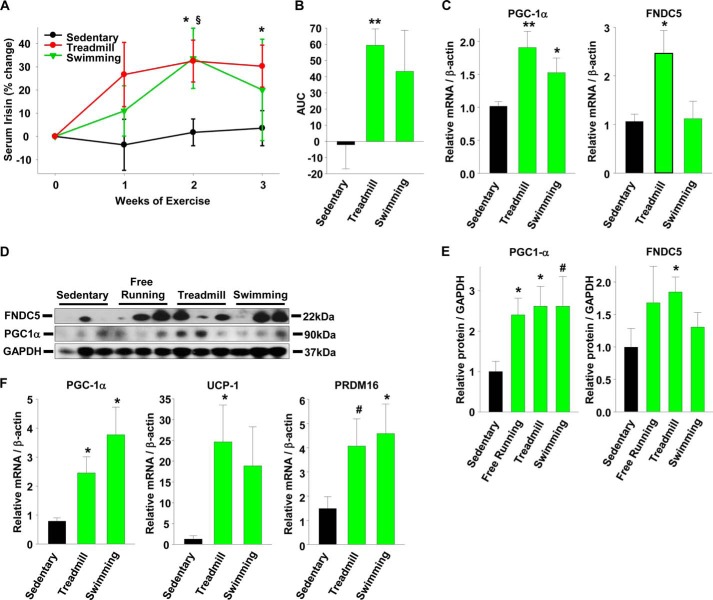
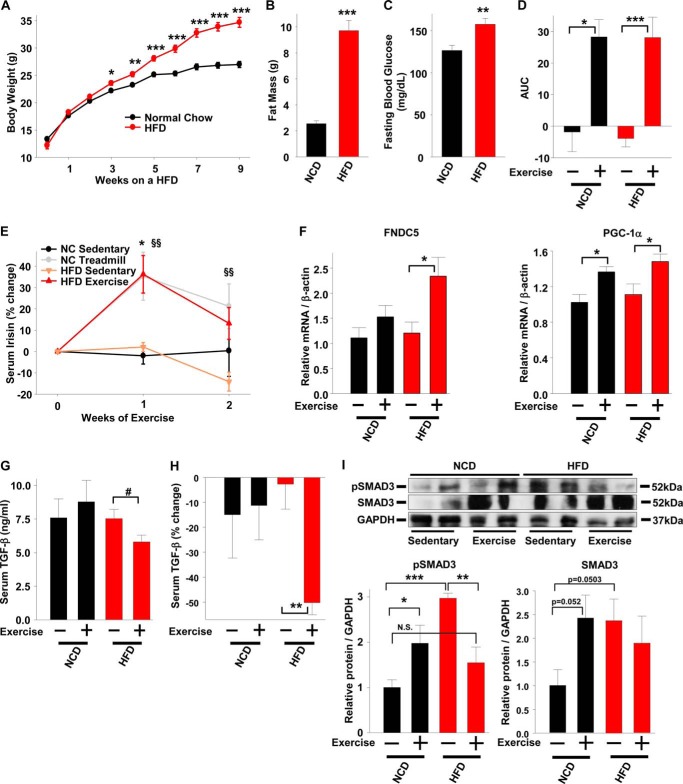
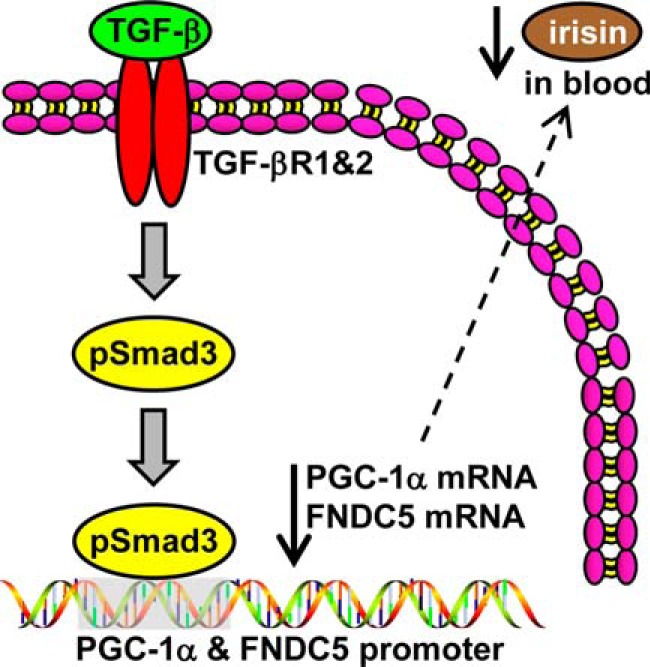
Beige adipose cells are a distinct and inducible type of thermogenic fat cell that express the mitochondrial uncoupling protein-1 and thus represent a powerful target for treating obesity. Mice lacking the TGF-β effector protein SMAD3 are protected against diet-induced obesity because of browning of their white adipose tissue (WAT), leading to increased whole body energy expenditure. However, the role SMAD3 plays in WAT browning is not clearly understood. Irisin is an exercise-induced skeletal muscle hormone that induces WAT browning similar to that observed in SMAD3-deficient mice. Together, these observations suggested that SMAD3 may negatively regulate irisin production and/or secretion from skeletal muscle. To address this question, we used wild-type and SMAD3 knock-out (Smad3(-/-)) mice subjected to an exercise regime and C2C12 myotubes treated with TGF-β, a TGF-β receptor 1 pharmacological inhibitor, adenovirus expressing constitutively active SMAD3, or siRNA against SMAD3. We find that in Smad3(-/-) mice, exercise increases serum irisin and skeletal muscle FNDC5 (irisin precursor) and its upstream activator peroxisome proliferator-activated receptor γ coactivator 1-α (PGC-1α) to a greater extent than in wild-type mice. In C2C12 myotubes, TGF-β suppresses FNDC5 and PGC-1α mRNA and protein levels via SMAD3 and promotes SMAD3 binding to the FNDC5 and PGC-1α promoters. These data establish that SMAD3 suppresses FNDC5 and PGC-1α in skeletal muscle cells. These findings shed light on the poorly understood regulation of irisin/FNDC5 by demonstrating a novel association between irisin and SMAD3 signaling in skeletal muscle.
Keywords: Exercise; Irisin; Obesity; SMAD Transcription Factor; Skeletal Muscle; Transforming Growth Factor Beta (TGF-B).
© 2015 by The American Society for Biochemistry and Molecular Biology, Inc.
Figures
Similar articles
-
Time-Dependent Changes in Increased Levels of Plasma Irisin and Muscle PGC-1α and FNDC5 after Exercise in Mice.Tohoku J Exp Med. 2018 Feb;244(2):93-103. doi: 10.1620/tjem.244.93. Tohoku J Exp Med. 2018. PMID: 29415899
-
Thermogenic capacity is antagonistically regulated in classical brown and white subcutaneous fat depots by high fat diet and endurance training in rats: impact on whole-body energy expenditure.J Biol Chem. 2014 Dec 5;289(49):34129-40. doi: 10.1074/jbc.M114.591008. Epub 2014 Oct 25. J Biol Chem. 2014. PMID: 25344623 Free PMC article.
-
The effects of acute and chronic exercise on PGC-1α, irisin and browning of subcutaneous adipose tissue in humans.FEBS J. 2014 Feb;281(3):739-49. doi: 10.1111/febs.12619. Epub 2013 Dec 10. FEBS J. 2014. PMID: 24237962 Clinical Trial.
-
From Skeletal Muscle to Myocardium: Molecular Mechanisms of Exercise-Induced Irisin Regulation of Cardiac Fibrosis.Int J Mol Sci. 2025 Apr 10;26(8):3550. doi: 10.3390/ijms26083550. Int J Mol Sci. 2025. PMID: 40332022 Free PMC article. Review.
-
Role of irisin in physiology and pathology.Front Endocrinol (Lausanne). 2022 Sep 26;13:962968. doi: 10.3389/fendo.2022.962968. eCollection 2022. Front Endocrinol (Lausanne). 2022. PMID: 36225200 Free PMC article. Review.
Cited by
-
CCL2 signaling promotes skeletal muscle wasting in non-tumor and breast tumor models.Dis Model Mech. 2024 Aug 1;17(8):dmm050398. doi: 10.1242/dmm.050398. Epub 2024 Sep 9. Dis Model Mech. 2024. PMID: 38973385 Free PMC article.
-
New insights into the cellular activities of Fndc5/Irisin and its signaling pathways.Cell Biosci. 2020 Mar 30;10:51. doi: 10.1186/s13578-020-00413-3. eCollection 2020. Cell Biosci. 2020. PMID: 32257109 Free PMC article. Review.
-
Sarcopenia and Cognitive Function: Role of Myokines in Muscle Brain Cross-Talk.Life (Basel). 2021 Feb 23;11(2):173. doi: 10.3390/life11020173. Life (Basel). 2021. PMID: 33672427 Free PMC article. Review.
-
Serum Levels of Irisin Predict Cumulative Clinical Outcomes in Heart Failure Patients With Type 2 Diabetes Mellitus.Front Physiol. 2022 May 16;13:922775. doi: 10.3389/fphys.2022.922775. eCollection 2022. Front Physiol. 2022. PMID: 35651870 Free PMC article.
-
Myostatin/Activin Receptor Ligands in Muscle and the Development Status of Attenuating Drugs.Endocr Rev. 2022 Mar 9;43(2):329-365. doi: 10.1210/endrev/bnab030. Endocr Rev. 2022. PMID: 34520530 Free PMC article. Review.
References
-
- Kelly T., Yang W., Chen C. S., Reynolds K., He J. (2008) Global burden of obesity in 2005 and projections to 2030. Int. J. Obes. (Lond.) 32, 1431–1437 - PubMed
-
- Finkelstein E. A., Trogdon J. G., Cohen J. W., Dietz W. (2009) Annual medical spending attributable to obesity: payer-and service-specific estimates. Health Aff. (Millwood) 28, w822–w831 - PubMed
-
- Crawford A. G., Cote C., Couto J., Daskiran M., Gunnarsson C., Haas K., Haas S., Nigam S. C., Schuette R. (2010) Prevalence of obesity, type II diabetes mellitus, hyperlipidemia, and hypertension in the United States: findings from the GE Centricity Electronic Medical Record database. Popul. Health Manag. 13, 151–161 - PubMed
-
- Kim J. Y., van de Wall E., Laplante M., Azzara A., Trujillo M. E., Hofmann S. M., Schraw T., Durand J. L., Li H., Li G., Jelicks L. A., Mehler M. F., Hui D. Y., Deshaies Y., Shulman G. I., Schwartz G. J., Scherer P. E. (2007) Obesity-associated improvements in metabolic profile through expansion of adipose tissue. J. Clin. Invest. 117, 2621–2637 - PMC - PubMed
Publication types
MeSH terms
Substances
Grants and funding
LinkOut - more resources
Full Text Sources
Research Materials
