. 2015 Mar 27;290(13):8081-94.
doi: 10.1074/jbc.M114.603985. Epub 2015 Feb 3.

Impaired bone homeostasis in amyotrophic lateral sclerosis mice with muscle atrophy

Affiliations

Impaired bone homeostasis in amyotrophic lateral sclerosis mice with muscle atrophy

Ke Zhu et al. J Biol Chem. .

Abstract

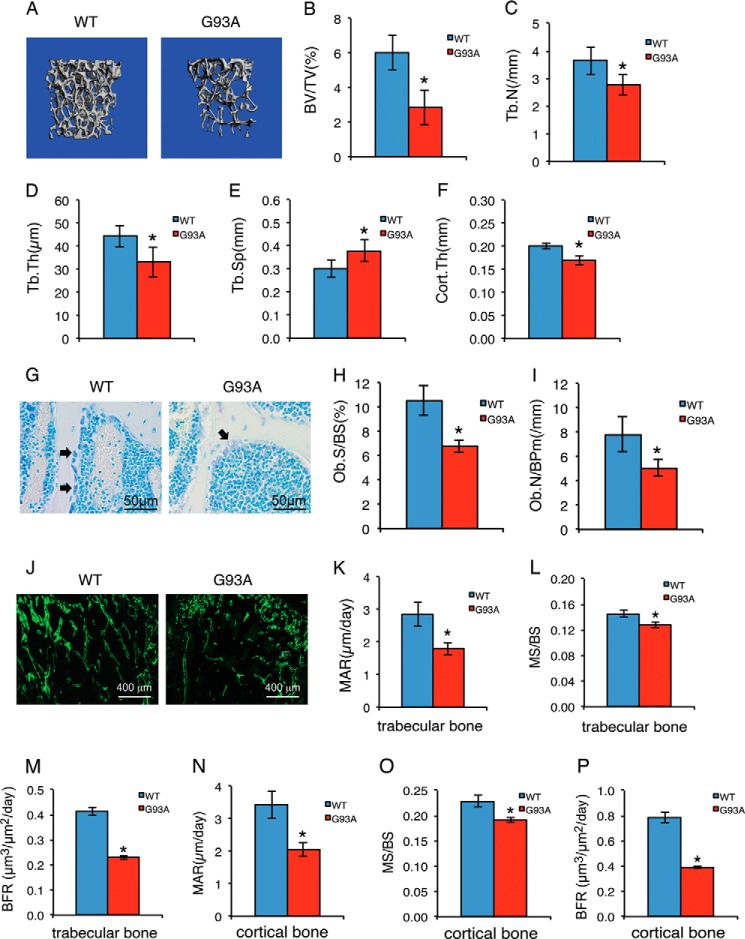
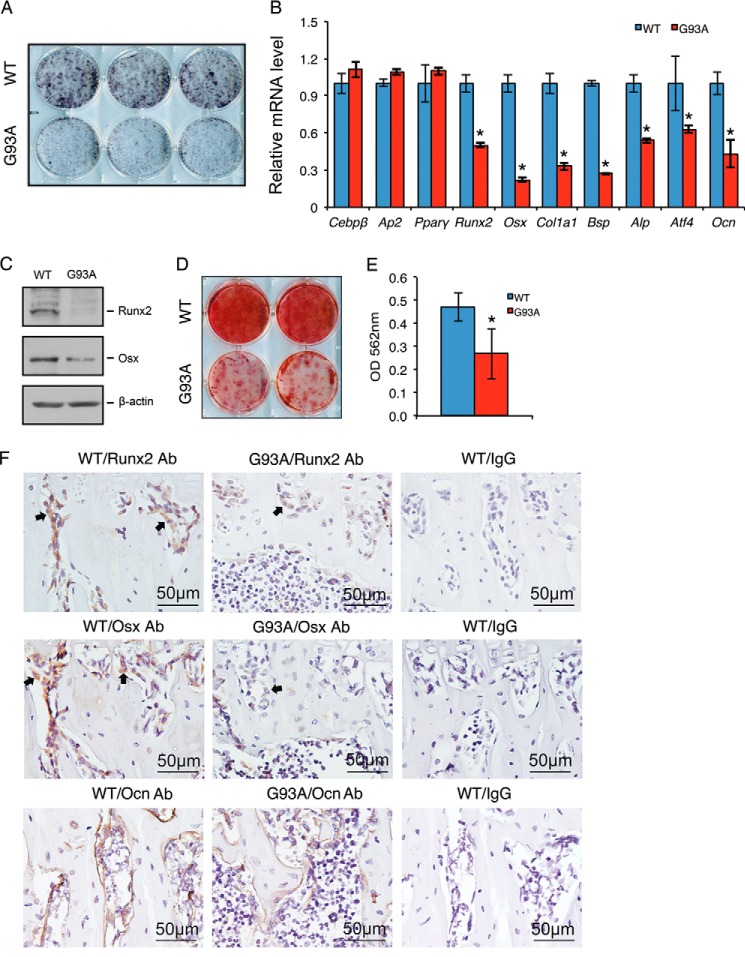
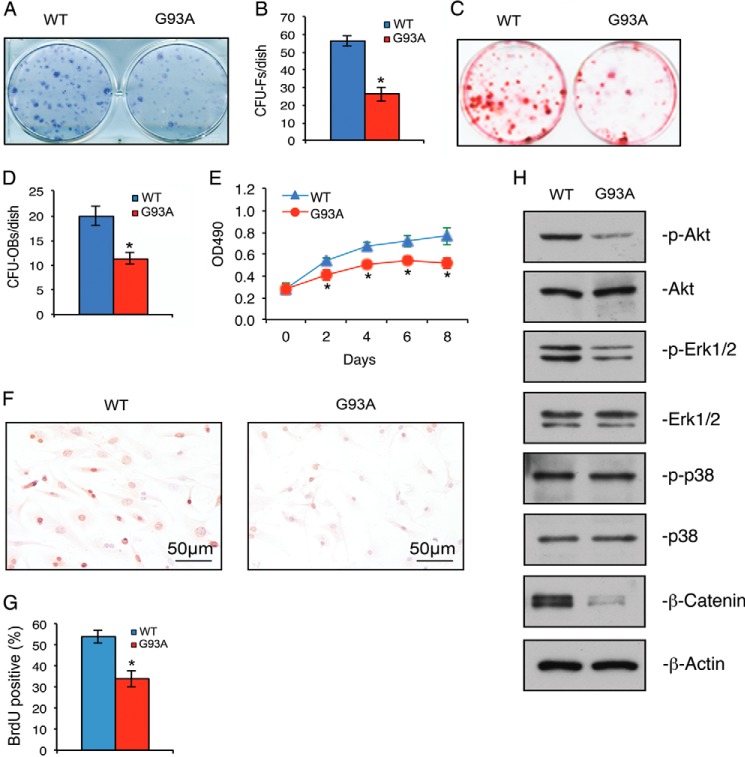
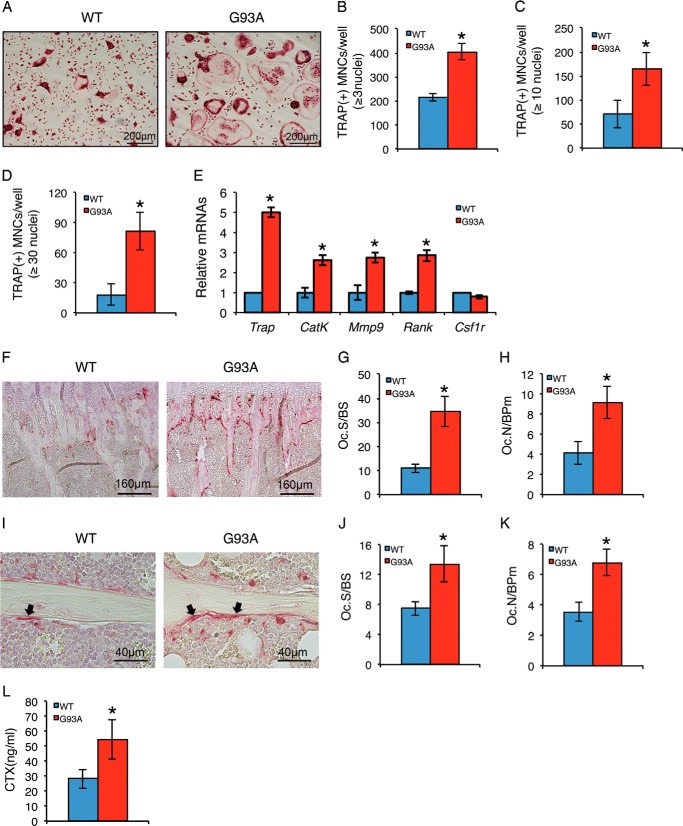
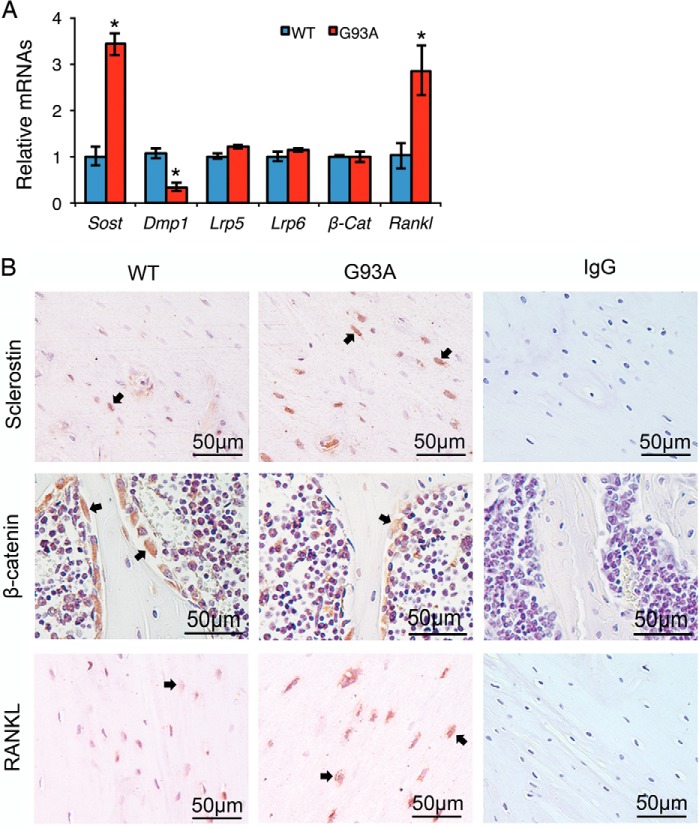
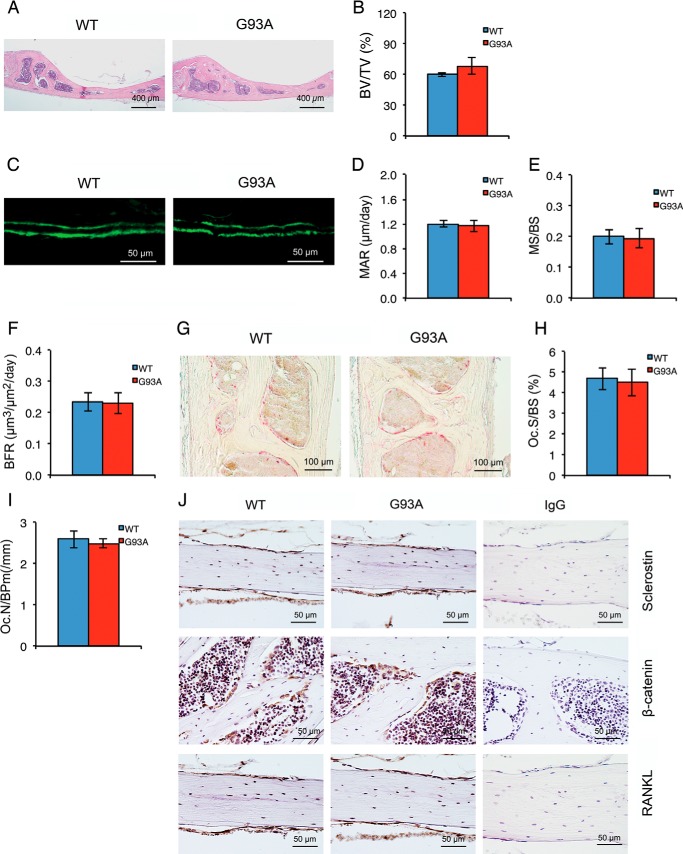
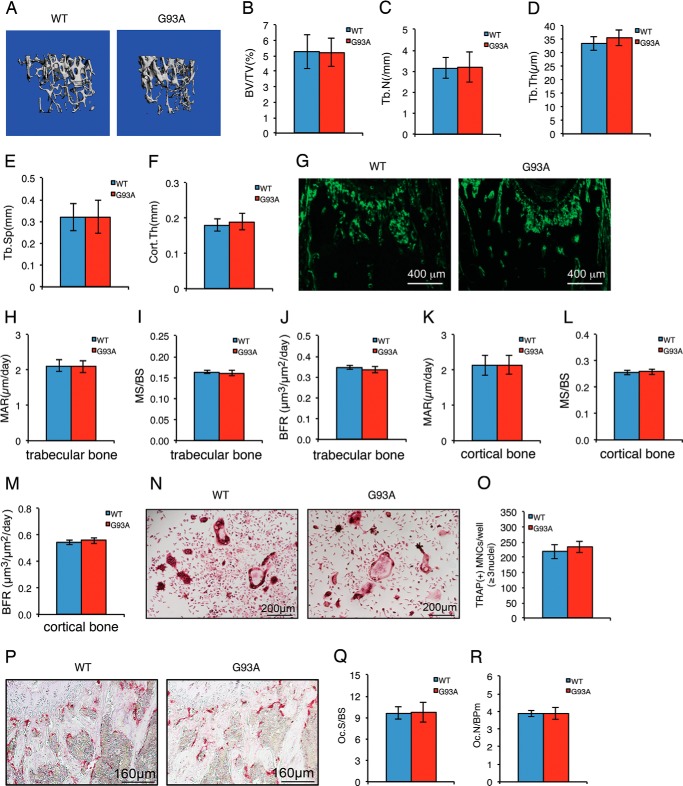
There is an intimate relationship between muscle and bone throughout life. However, how alterations in muscle functions in disease impact bone homeostasis is poorly understood. Amyotrophic lateral sclerosis (ALS) is a neuromuscular disease characterized by progressive muscle atrophy. In this study we analyzed the effects of ALS on bone using the well established G93A transgenic mouse model, which harbors an ALS-causing mutation in the gene encoding superoxide dismutase 1. We found that 4-month-old G93A mice with severe muscle atrophy had dramatically reduced trabecular and cortical bone mass compared with their sex-matched wild type (WT) control littermates. Mechanically, we found that multiple osteoblast properties, such as the formation of osteoprogenitors, activation of Akt and Erk1/2 pathways, and osteoblast differentiation capacity, were severely impaired in primary cultures and bones from G93A relative to WT mice; this could contribute to reduced bone formation in the mutant mice. Conversely, osteoclast formation and bone resorption were strikingly enhanced in primary bone marrow cultures and bones of G93A mice compared with WT mice. Furthermore, sclerostin and RANKL expression in osteocytes embedded in the bone matrix were greatly up-regulated, and β-catenin was down-regulated in osteoblasts from G93A mice when compared with those of WT mice. Interestingly, calvarial bone that does not load and long bones from 2-month-old G93A mice without muscle atrophy displayed no detectable changes in parameters for osteoblast and osteoclast functions. Thus, for the first time to our knowledge, we have demonstrated that ALS causes abnormal bone remodeling and defined the underlying molecular and cellular mechanisms.

Keywords: Amyotrophic Lateral Sclerosis (ALS) (Lou Gehrig Disease); Bone; Muscle Atrophy; Osteoblast; Osteoclast.


Figures

FIGURE 1.
FIGURE 1.
Four-month-old G93A mice with muscle atrophy show reduced trabecular and cortical bone mass associated with impaired osteoblast function. A, three-dimensional reconstructions from μCT scans of femurs from 4-month-old G93A (n = 10) and WT (n = 10) female mice. B–F, quantitative analyses of BV/TV, Tb.N, Tb.Th, Tb.Sp), and Cort.Th. *, p < 0.01 (versus WT). G–I, 5-μm tibial sections were stained with toluidine blue (G). Quantitative analyses of osteoblast surface/bone surface (Ob.S/BS) (H) and osteoblast numbers/bone perimeter (Ob.N/BPm) (I) are shown. *, p < 0.01 (versus WT), n = 7 for both WT and G93A. Arrowheads indicate osteoblasts located on trabecular surfaces. J–P, MAR, MS/BS, and BFR assays. Sections of non-demineralized femurs were used for MAR, MS/BS, and BRF assays. Magnification: 40×. Quantitative MAR, MS/BS, and BFR data for metaphyseal trabecular bones (K–M) and diaphyseal cortical bones (N–P). *, p < 0.01 (versus WT), n = 10 for both WT and G93A.
FIGURE 2.
FIGURE 2.
Osteoblast differentiation is suppressed in primary cultures and bones of 4-month-old G93A mice with muscle atrophy. A–E, in vitro osteoblast differentiation. Primary BMSCs from 4-month-old WT and G93A female mice were plated at a density of 4 × 10⁵/dish in 35-mm dishes in differentiation media for 7 days followed by alkaline phosphatase staining (A), RT-qPCR analyses (B), or Western blot analyses (C) or for 14 days followed by Alizarin red staining (D). Gapdh mRNA was used as internal control for RT-qPCR analyses, and β-actin was used as loading control for Western blotting. Quantitative data of D are shown in E. Experiments were repeated three times in triplicate (A), quadruplicate (B), or in duplicate (D). *, p < 0.05 (versus WT). F, IHC, 5-μm tibial sections were stained with antibodies (Ab) against Runx2 (top), Osx (middle), and Ocn (bottom) or a control IgG (left panels). Runx2- and Osx-positive cells were stained brown (see arrowheads), and negative cells were stained blue. Cebpβ, CCAAT enhancer binding proteins β; Ap2, adipocyte protein 2; Pparγ, peroxisome proliferator-activated receptor γ; Col1a1, type I collagen; Bsp, bone sialoprotein; Atf4, activating transcription factor 4.
FIGURE 3.
FIGURE 3.
The numbers of CFU-Fs and CFU-OBs and of Akt and Erk1/2 phosphorylation, cell proliferation, and β-catenin expression are down-regulated in primary BMSCs from 4-month-old G93A mice with muscle atrophy. A and B, CFU-F assay. 1 × 10⁶ bone marrow nucleated cells from 4-month-old WT and G93A female mice were cultured in complete MesenCult medium (Stemcell Technologies) for 10 days followed by Giemsa solution. CFU-Fs from each group were quantified. *, p < 0.05 (versus WT). Experiments were repeated three times in triplicate. C and D, CFU-OB assay. 2 × 10⁶ bone marrow nucleated cells from 4-month-old WT and G93A female mice were cultured in osteoblast differentiation media for 21 days followed by Alizarin red staining. The number of CFU-OB colonies was quantified. *, p < 0.05 (versus WT). Experiments were repeated three times in triplicate. E, MTS assay. Primary BMSCs from 4-month-old WT and G93A female mice were seeded at a density of 1 × 10⁴/well in 96-well plates in proliferation media. MTS assays were performed on days 0, 2, 4, 6, and 8 as indicated. *, p < 0.05 (versus WT). Experiments were repeated three times in quadruplicate. F and G, BrdU labeling. Primary BMSCs from 4-month-old WT and G93A female mice were seeded at 105 cells/well in 8-well chambers and cultured in proliferation media for 2 days followed by BrdU staining. Experiments were repeated three times in quadruplicate. H, Western blot analysis. Primary BMSCs from 4-month-old WT and G93A female mice were plated at a density of 4 × 10⁵/dish in 35-mm dishes and cultured in proliferation media for 2 days. Experiments were repeated three times.
FIGURE 4.
FIGURE 4.
Osteoclast formation is enhanced in primary BMM cultures and in bones of 4-month-old G93A mice with muscle atrophy. A–D, in vitro osteoclast formation. Primary BMMs isolated from 4-month-old wild type (WT) and G93A female mice were differentiated with macrophage colony stimulating factor (M-CSF) (10 ng/ml) and RANKL (50 ng/ml) for 5 days followed by TRAP staining. TRAP-positive MNCs (B, ≥3 nuclei; C, ≥10 nuclei; D, ≥30 nuclei) per well were scored (B–D). *, p < 0.05 (versus WT). Experiments were repeated three times with six samples per group. E, RT-qPCR analysis. Primary BMMs were differentiated for 5 days followed by RT-qPCR analysis using primers for Trap, Cat K, Mmp9, Rank, and Csf1r. Gapdh mRNA was used as internal control. *, p < 0.05 (versus WT). Experiments were repeated three times in quadruplicate. F–K, in vivo osteoclast formation. Tibial sections of 4-month-old WT and G93A female mice were stained for TRAP activity. Arrowheads indicate osteoclasts on trabecular surfaces. Quantitative data of Oc.S/BS (G and J) and Oc.N/BPm (H and K) in primary (F–H) and secondary (I–K) spongiosa. *, p < 0.05 (versus WT), n = 7. L, serum C-terminal telopeptide of type 1 collagen (CTX) assay. Serum CTX levels were assayed. *, p < 0.05 (versus WT), n = 7. CatK, cathepsin K; Mmp9, matrix metallopeptidase 9; Rank, receptor activator of nuclear factor κB; Csf1r, colony stimulating factor 1 receptor.
FIGURE 5.
FIGURE 5.
Sclerostin and RANKL expression in osteocytes in the bone matrix are up-regulated and β-catenin expression in osteoblasts on bone surfaces is down-regulated in 4-month-old G93A mice with muscle atrophy. A, RT-qPCR analysis. Total RNA isolated from 4-month-old WT and G93A female tibiae were subjected to RT-qPCR analysis using primers for Sost, Lrp5, Lrp6, Dmp-1, Rankl, and β-Cat. Gapdh mRNA was used as internal control. *, p < 0.05 (versus WT). Experiments were repeated three times in quadruplicate. B, immunohistochemistry. 5-μm tibial sections from 4-month-old WT and G93A female mice were stained with antibodies against sclerostin (top), β-catenin (middle), and RANKL (bottom) or a control IgG (left panels). Sclerostin-, β-catenin-, and RANKL-positive cells were stained brown (see arrowheads), and negative cells were stained blue. Note: transverse tibial sections (top and bottom) were used to show sclerostin and RANKL expression in osteocytes embedded in the bone matrix, and longitudinal tibial sections (middle) were used to display β-catenin expression in osteoblasts on trabecular bone surfaces. Sost, sclerostin; Lrp5, low density lipoprotein receptor-related protein 5; Dmp-1, dentin matrix acidic phosphoprotein 1; RANKL, receptor activator of nuclear factor κB ligand; β-Cat, β-catenin.
FIGURE 6.
FIGURE 6.
Calvarial bone is not affected in four-month-old G93A mice with severe muscle atrophy. A and B, H&E staining. Sections of calvarial bones from 4-month-old G93A and WT female mice were subjected to H&E staining. BV/TV was measured (B). *, p < 0.01 (versus WT), n = 9 for both WT and G93A. C–F, MAR, MS/BS, and BFR assays. Sections of non-demineralized calvariae of the two genotypes were used for MAR, MS/BS, and BFR assays. Magnification: 40×. Quantitative MAR, MS/BS, and BFR data (D–F). p > 0.05 (versus WT), n = 9 for both WT and G93A. G–I, TRAP staining. Calvarial sections of 4-month-old WT and G93A female mice were stained for TRAP activity. Quantitative data of Oc.S/BS and Oc.N/BPm (I) are shown. p > 0.05 (versus WT), n = 7. J, immunohistochemistry. 5-μm calvarial sections from 4-month-old WT and G93A female mice were stained with antibodies against sclerostin (top), β-catenin (middle), and RANKL (bottom) or a control IgG (left panels). Sclerostin-, β-catenin-, and RANKL-positive cells were stained brown, and negative cells were stained blue.
FIGURE 7.
FIGURE 7.
Two-month-old G93A mice without muscle atrophy have normal bone mass with no detectable changes in parameters for osteoblast and osteoclast function. A, three-dimensional reconstruction from μCT scans of femurs from 2-month-old G93A and WT female mice. B–F, quantitative analyses of BV/TV, Tb.Th, Tb.Sp, and Cort.Th. G–M, MAR, MS/BS, and BFR assays. Sections of undecalcified femurs of 2-month-old G93A (n = 8) and WT (n = 8) female mice were used for MAR, MS/BS, and BFR assays. Quantitative data of MAR, MS/BS, and BFR for metaphyseal trabecular bones (H–J) and diaphyseal cortical bones (K–M). Magnification: 40×. N and O, in vitro osteoclast formation. Primary BMMs from 2-month-old WT and G93A female mice were differentiated for 5 days followed by TRAP staining. TRAP-positive MNCs (≥3 nuclei) per well were scored (K). Experiments were repeated three times with six samples per group. P–R, in vivo osteoclast formation. Representative TRAP staining images of tibial sections of 2-month-old G93A and WT female mice (P) are shown. Quantitative analyses of Oc.S/BS and Oc.N/BPm (R) of secondary spongiosa of tibiae are shown. n = 8.

Similar articles

Cited by

References

    1. Pasinelli P., Brown R. H. (2006) Molecular biology of amyotrophic lateral sclerosis: insights from genetics. Nat. Rev. Neurosci. 7, 710–723 - PubMed
    1. Borchelt D. R., Lee M. K., Slunt H. S., Guarnieri M., Xu Z. S., Wong P. C., Brown R. H., Jr., Price D. L., Sisodia S. S., Cleveland D. W. (1994) Superoxide dismutase 1 with mutations linked to familial amyotrophic lateral sclerosis possesses significant activity. Proc. Natl. Acad. Sci. U.S.A. 91, 8292–8296 - PMC - PubMed
    1. Rosen D. R., Siddique T., Patterson D., Figlewicz D. A., Sapp P., Hentati A., Donaldson D., Goto J., O'Regan J. P., Deng H. X. (1993) Mutations in Cu2+/Zn2+ superoxide dismutase gene are associated with familial amyotrophic lateral sclerosis. Nature 362, 59–62 - PubMed
    1. McGoldrick P., Joyce P. I., Fisher E. M., Greensmith L. (2013) Rodent models of amyotrophic lateral sclerosis. Biochim. Biophys. Acta 1832, 1421–1436 - PubMed
    1. Kaji H. (2014) Interaction between muscle and bone. J. Bone Metab. 21, 29–40 - PMC - PubMed

Publication types

MeSH terms