

A kinetic model identifies phosphorylated estrogen receptor-α (ERα) as a critical regulator of ERα dynamics in breast cancer
- PMID: 25648997
- PMCID: PMC4415015
- DOI: 10.1096/fj.14-265637
A kinetic model identifies phosphorylated estrogen receptor-α (ERα) as a critical regulator of ERα dynamics in breast cancer
Abstract
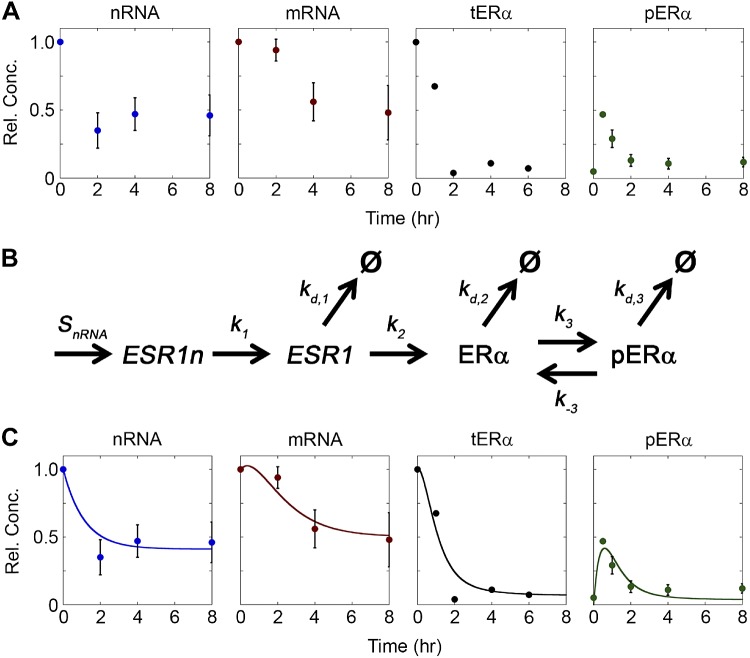
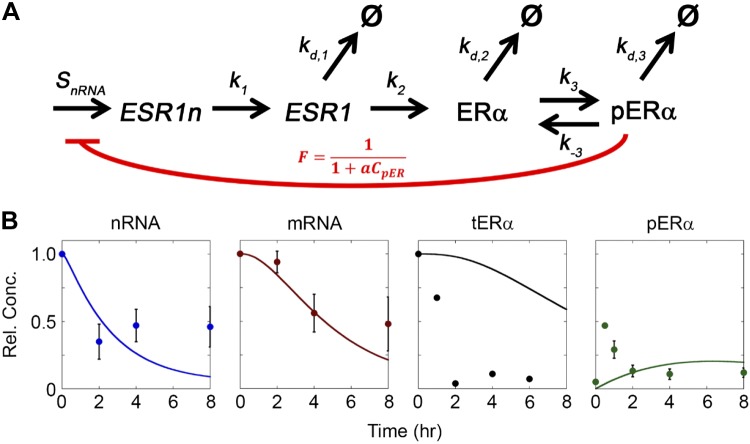
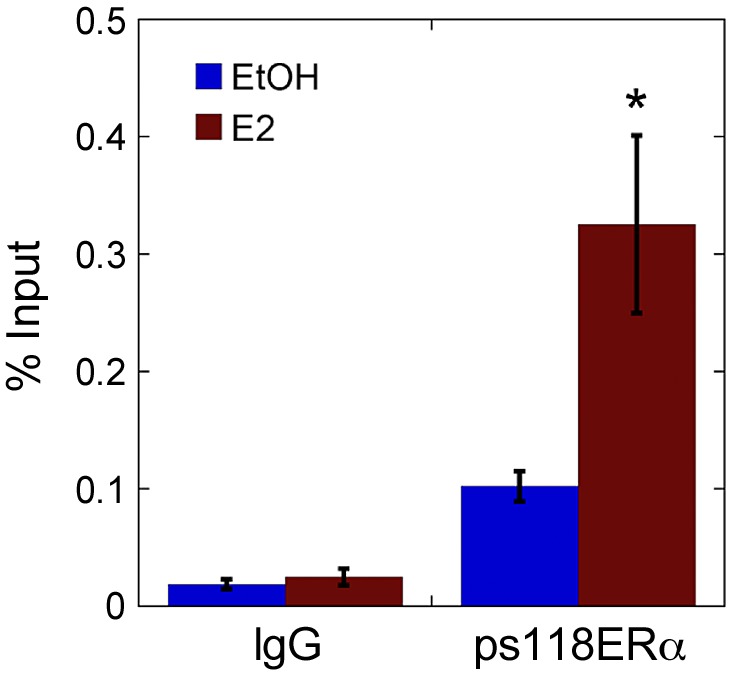
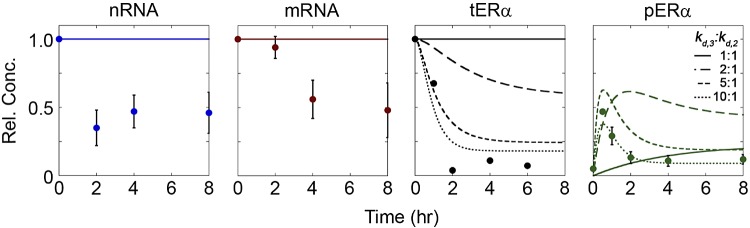
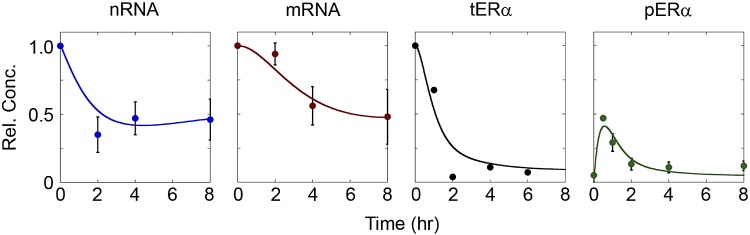
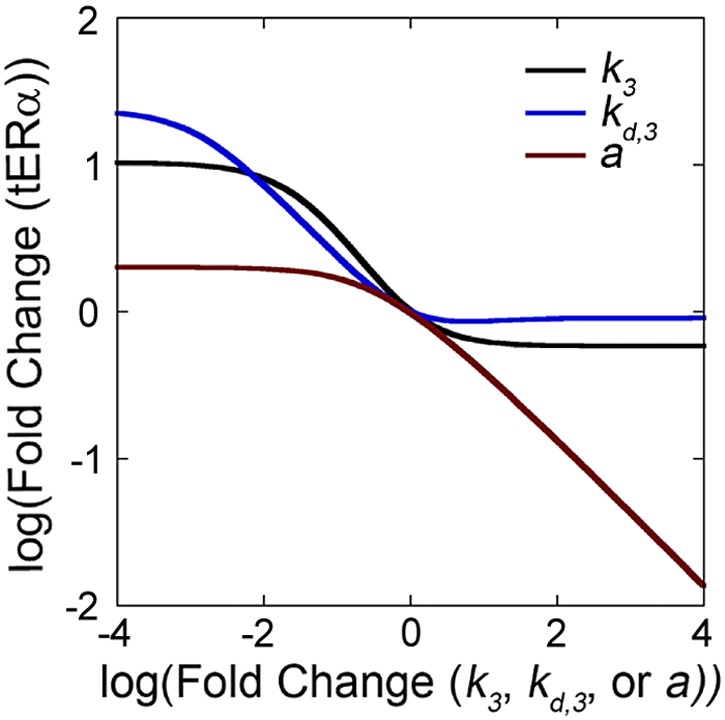
Receptor levels are a key mechanism by which cells regulate their response to stimuli. The levels of estrogen receptor-α (ERα) impact breast cancer cell proliferation and are used to predict prognosis and sensitivity to endocrine therapy. Despite the clinical application of this information, it remains unclear how different cellular processes interact as a system to control ERα levels. To address this question, experimental results from the ERα-positive human breast cancer cell line (MCF-7) treated with 17-β-estradiol or vehicle control were used to develop a mass-action kinetic model of ERα regulation. Model analysis determined that RNA dynamics could be captured through phosphorylated ERα (pERα)-dependent feedback on transcription. Experimental analysis confirmed that pERα-S118 binds to the estrogen receptor-1 (ESR1) promoter, suggesting that pERα can feedback on ESR1 transcription. Protein dynamics required a separate mechanism in which the degradation rate for pERα was 8.3-fold higher than nonphosphorylated ERα. Using a model with both mechanisms, the root mean square error was 0.078. Sensitivity analysis of this combined model determined that while multiple mechanisms regulate ERα levels, pERα-dependent feedback elicited the strongest effect. Combined, our computational and experimental results identify phosphorylation of ERα as a critical decision point that coordinates the cellular circuitry to regulate ERα levels.
Keywords: feedback; mathematical modeling; nuclear receptor; systems biology.
© FASEB.
Figures
Similar articles
-
Endocrine therapy resistance can be associated with high estrogen receptor alpha (ERalpha) expression and reduced ERalpha phosphorylation in breast cancer models.Endocr Relat Cancer. 2006 Dec;13(4):1121-33. doi: 10.1677/erc.1.01257. Endocr Relat Cancer. 2006. PMID: 17158758
-
FOXM1 is a transcriptional target of ERalpha and has a critical role in breast cancer endocrine sensitivity and resistance.Oncogene. 2010 May 20;29(20):2983-95. doi: 10.1038/onc.2010.47. Epub 2010 Mar 8. Oncogene. 2010. PMID: 20208560 Free PMC article.
-
Estrogen-dependent sushi domain containing 3 regulates cytoskeleton organization and migration in breast cancer cells.Oncogene. 2015 Jan 15;34(3):323-33. doi: 10.1038/onc.2013.553. Epub 2014 Jan 13. Oncogene. 2015. PMID: 24413080 Free PMC article.
-
Estrogen receptor alpha phosphorylation and its functional impact in human breast cancer.Mol Cell Endocrinol. 2015 Dec 15;418 Pt 3:264-72. doi: 10.1016/j.mce.2015.01.016. Epub 2015 Jan 15. Mol Cell Endocrinol. 2015. PMID: 25597633 Review.
-
Mechanisms of estrogen receptor-α upregulation in breast cancers.Med Mol Morphol. 2010 Dec;43(4):193-6. doi: 10.1007/s00795-010-0514-3. Epub 2011 Jan 26. Med Mol Morphol. 2010. PMID: 21267694 Review.
Cited by
-
Intrinsic and Extrinsic Factors Governing the Transcriptional Regulation of ESR1.Horm Cancer. 2020 Aug;11(3-4):129-147. doi: 10.1007/s12672-020-00388-0. Epub 2020 Jun 26. Horm Cancer. 2020. PMID: 32592004 Free PMC article. Review.
-
Physiological significance of bistable circuit design in metabolic homeostasis: role of integrated insulin-glucagon signalling network.Mol Biol Rep. 2022 Jun;49(6):5017-5028. doi: 10.1007/s11033-022-07175-w. Epub 2022 Jan 25. Mol Biol Rep. 2022. PMID: 35079935 Review.
-
The estrogen receptor-alpha S118P variant does not affect breast cancer incidence or response to endocrine therapies.Breast Cancer Res Treat. 2019 Apr;174(2):401-412. doi: 10.1007/s10549-018-05087-7. Epub 2018 Dec 17. Breast Cancer Res Treat. 2019. PMID: 30560461 Free PMC article.
-
DNA methylation and expression of estrogen receptor alpha in fathead minnows exposed to 17α-ethynylestradiol.Aquat Toxicol. 2021 Apr;233:105788. doi: 10.1016/j.aquatox.2021.105788. Epub 2021 Feb 23. Aquat Toxicol. 2021. PMID: 33662878 Free PMC article.
-
The high methylation level of a novel 151-bp CpG island in the ESR1 gene promoter is associated with a poor breast cancer prognosis.Cancer Cell Int. 2021 Dec 4;21(1):649. doi: 10.1186/s12935-021-02343-7. Cancer Cell Int. 2021. PMID: 34863151 Free PMC article.
References
-
- Zwart W., Theodorou V., Carroll J. S. (2011) Estrogen receptor-positive breast cancer: a multidisciplinary challenge. Systems Biol Med. 3, 216–230 - PubMed
-
- Giuliano M., Schifp R., Osborne C. K., Trivedi M. V. (2011) Biological mechanisms and clinical implications of endocrine resistance in breast cancer. Breast 20(Suppl 3), S42–S49 - PubMed
-
- Couse J. F., Korach K. S. (1999) Estrogen receptor null mice: what have we learned and where will they lead us? Endocr. Rev. 20, 358–417 - PubMed
Publication types
MeSH terms
Substances
Grants and funding
LinkOut - more resources
Full Text Sources
Other Literature Sources
Medical
Miscellaneous
