. 2015 Jan 28;7(1):5.
doi: 10.1186/s13073-014-0120-4. eCollection 2015.

Bayesian models for syndrome- and gene-specific probabilities of novel variant pathogenicity

Affiliations

Bayesian models for syndrome- and gene-specific probabilities of novel variant pathogenicity

Dace Ruklisa et al. Genome Med. .

Abstract

Background: With the advent of affordable and comprehensive sequencing technologies, access to molecular genetics for clinical diagnostics and research applications is increasing. However, variant interpretation remains challenging, and tools that close the gap between data generation and data interpretation are urgently required. Here we present a transferable approach to help address the limitations in variant annotation.

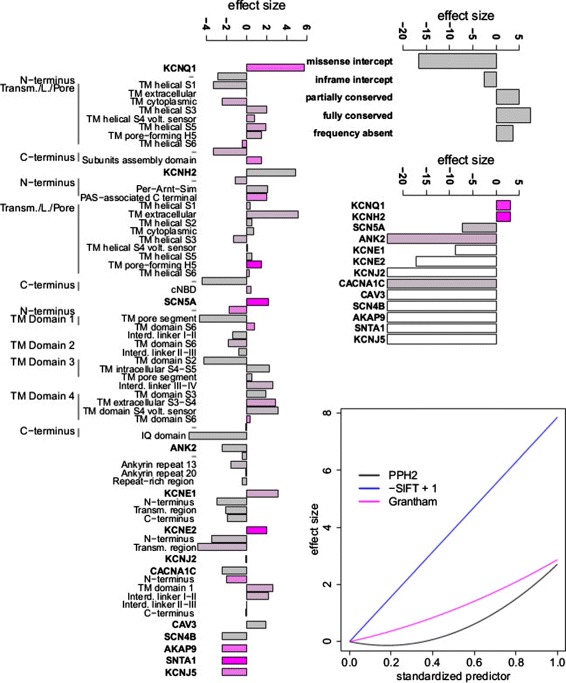
Methods: We develop a network of Bayesian logistic regression models that integrate multiple lines of evidence to evaluate the probability that a rare variant is the cause of an individual's disease. We present models for genes causing inherited cardiac conditions, though the framework is transferable to other genes and syndromes.

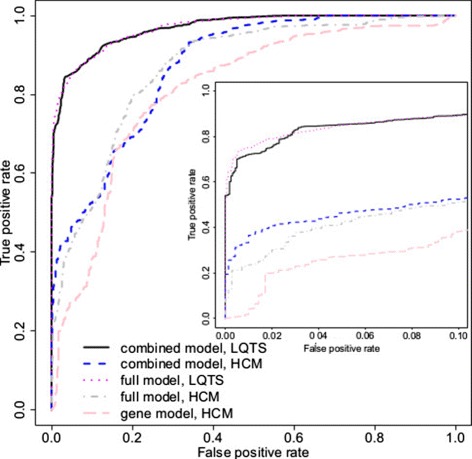
Results: Our models report a probability of pathogenicity, rather than a categorisation into pathogenic or benign, which captures the inherent uncertainty of the prediction. We find that gene- and syndrome-specific models outperform genome-wide approaches, and that the integration of multiple lines of evidence performs better than individual predictors. The models are adaptable to incorporate new lines of evidence, and results can be combined with familial segregation data in a transparent and quantitative manner to further enhance predictions. Though the probability scale is continuous, and innately interpretable, performance summaries based on thresholds are useful for comparisons. Using a threshold probability of pathogenicity of 0.9, we obtain a positive predictive value of 0.999 and sensitivity of 0.76 for the classification of variants known to cause long QT syndrome over the three most important genes, which represents sufficient accuracy to inform clinical decision-making. A web tool APPRAISE [http://www.cardiodb.org/APPRAISE] provides access to these models and predictions.

Conclusions: Our Bayesian framework provides a transparent, flexible and robust framework for the analysis and interpretation of rare genetic variants. Models tailored to specific genes outperform genome-wide approaches, and can be sufficiently accurate to inform clinical decision-making.


Figures

Figure 1
Figure 1
Comparison of the distributions of predictor variables for benign and pathogenic variants. Histograms depict the numbers of variants that are pathogenic (magenta bars) and benign (black bars) with predictor values within a range as indicated on the x-axes for the four predictor variables. Conservation categories are defined in the Methods section.
Figure 2
Figure 2
Graphical representation of the three prediction models for a single syndrome. The logistic regression models are represented as the three rectangles on the right, for a radical variant (top), an inframe indel (middle) and a missense substitution (bottom). Ellipses describe model predictors. Each model is additive on a logistic scale. Multiple arrows emerging from an ellipse indicate that the parameter is shared across the models indicated by the destinations of the arrows. This diagram represents the model for one syndrome.
Figure 3
Figure 3
Comparison of pathogenicity prediction models for LQTS. Receiver operating characteristic curves are shown for four nested LQTS models, as well as for SIFT with and without the addition of prior odds. The inner plot shows the false positive rate from 0 to 0.1, while the axis of the outer plot spans the false positive rate from 0 to 1. See text for explanation of the models. LQTS, long QT syndrome.
Figure 4
Figure 4
Pathogenicity prediction models for Brugada syndrome. The receiver operating characteristic curve for the full model for BrS is shown alongside that for LQTS (as in Figure 3) for comparison. Sensitivity could be improved at low false positive rates by building a combined model, in which some parameters were fit jointly for the LQTS and BrS models (see text for details) to compensate for the smaller BrS training set. Joint fitting does not impede performance of the LQTS model. BrS, Brugada syndrome; LQTS, long QT syndrome.
Figure 5
Figure 5
Comparison of pathogenicity prediction models for hypertrophic cardiomyopathy. Receiver operating characteristic curves for the full HCM model (full model, HCM) and a simpler gene model without domain-specific prediction (gene model, HCM) are shown alongside the LQTS classifier for comparison. As for BrS, the full HCM model was re-estimated in combination with the LQTS model with modest benefits at low false positive rates. BrS, Brugada syndrome; HCM, hypertrophic cardiomyopathy; LQTS, long QT syndrome.
Figure 6
Figure 6
Magnitude of effect sizes estimated from the full LQTS model. A positive effect size indicates that the evidence supports pathogenicity, whereas a negative effect size indicates evidence against pathogenicity. On the left, the effect size for each gene and domain term is shown, with gene effects corresponding to the logarithm of the prior odds for non-radical variants in Table 1 multiplied by a scale parameter. Domains are ordered sequentially according to genome position. The colour of the bars reflects the number of variants in the LQTS training set for each gene or domain: magenta bars are derived from many training variants (indicating high confidence), and grey bars from few variants. The top right panel shows the effect size for other binary variables, i.e. variant class (inframe/missense), allele frequency and conservation classes. The middle right panel includes gene terms for radical variants, where a gene term corresponds to the logarithm of the prior odds for radical variants in Table 1 multiplied by a scale parameter and added to the effect of variant class (radical). Magenta bars imply many training variants, while grey bars indicate few radical variants and white bars denote genes without any radical variants in the LQTS training data. The bottom right panel shows the effect size for continuous predictors (nsSNP algorithms) as linear or quadratic functions of the predictor value. Interd., Interdomain; IQ, IQ calmodulin binding motif, named after the first two amino acids of the motif, isoleucine (I) and glutamine (Q); L., Linker; LQTS, long QT syndrome; PAS, Per-Arnt-Sim domain, named after homology to the Drosophila period protein (PER), the aryl hydrocarbon receptor nuclear translocator protein (ARNT) and the Drosophila single-minded protein (SIM); PPh2, PolyPhen-2; TM, Transmembrane; Transm., Transmembrane; volt., voltage.

References

    1. Yang Y, Muzny D, Reid J, Bainbridge M, Willis A, Ward P, Clinical whole-exome sequencing for the diagnosis of Mendelian disorders. N Engl J Med. 2013;369:1502–1511. doi: 10.1056/NEJMoa1306555. - DOI - PMC - PubMed
    1. Katsanis S, Katsanis N. Molecular genetic testing and the future of clinical genomics. Nat Rev Genet. 2013;14:415–426. doi: 10.1038/nrg3493. - DOI - PMC - PubMed
    1. Ware J, Roberts A, Cook S. Next generation sequencing for clinical diagnostics and personalised medicine: implications for the next generation cardiologist. Heart. 2012;98:276–281. doi: 10.1136/heartjnl-2011-300742. - DOI - PubMed
    1. Biesecker L, Burke W, Kohane I, Plon S, Zimmern R. Next-generation sequencing in the clinic: are we ready? Nat Rev Genet. 2012;13:818–824. doi: 10.1038/nrg3357. - DOI - PMC - PubMed
    1. Kapa S, Tester D, Salisbury B, Harris-Kerr C, Pungliya M, Alders M, Genetic testing for long QT syndrome: distinguishing pathogenic mutations from benign variants. Circulation. 2009;120:1752–1760. doi: 10.1161/CIRCULATIONAHA.109.863076. - DOI - PMC - PubMed