

Heterogeneity of amplification of HER2, EGFR, CCND1 and MYC in gastric cancer
- PMID: 25649416
- PMCID: PMC4324419
- DOI: 10.1186/s12876-015-0231-4
Heterogeneity of amplification of HER2, EGFR, CCND1 and MYC in gastric cancer
Abstract
Background: Intra-tumor heterogeneity is a potential cause for failure of targeted therapy in gastric cancer, but the extent of heterogeneity of established (HER2) or potential (EGFR, CCND1) target genes and prognostic gene alterations (MYC) had not been systematically studied.
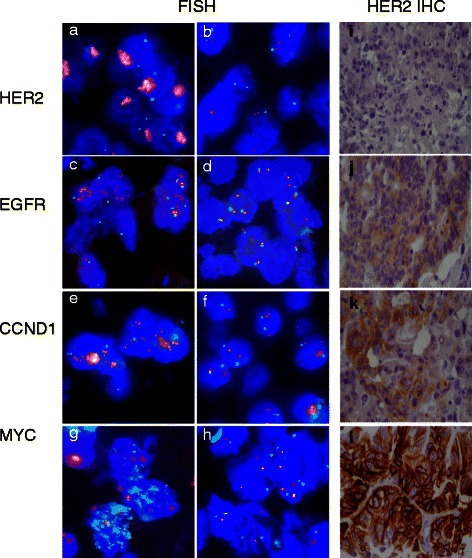
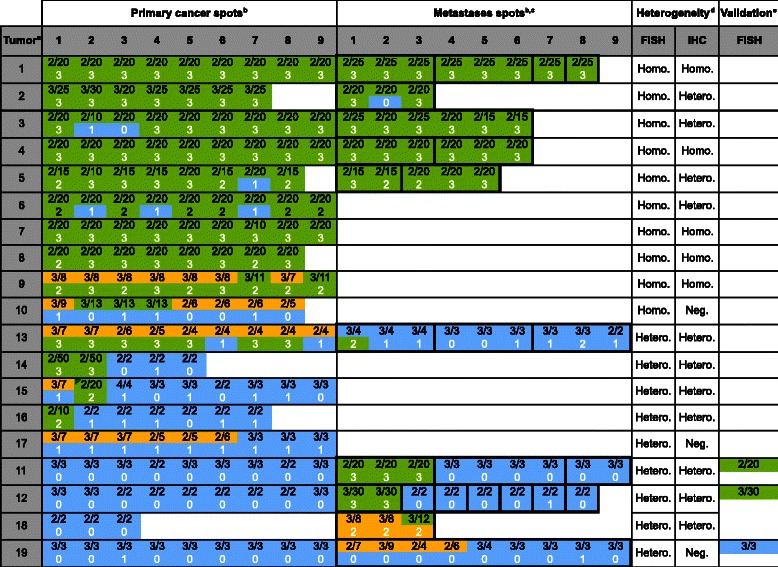
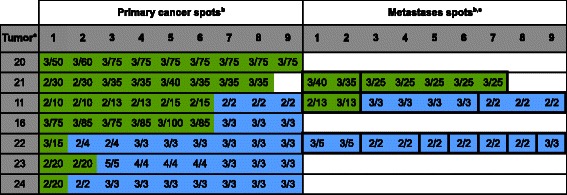
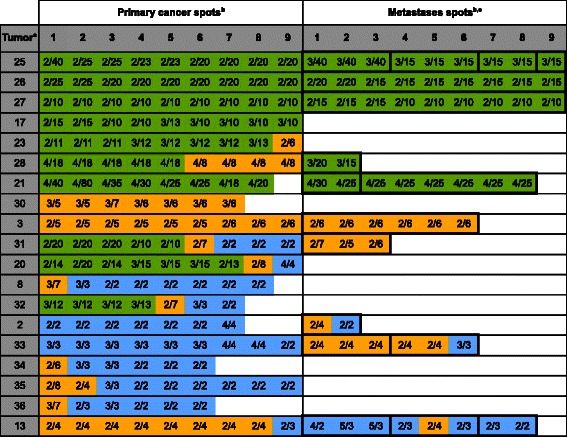
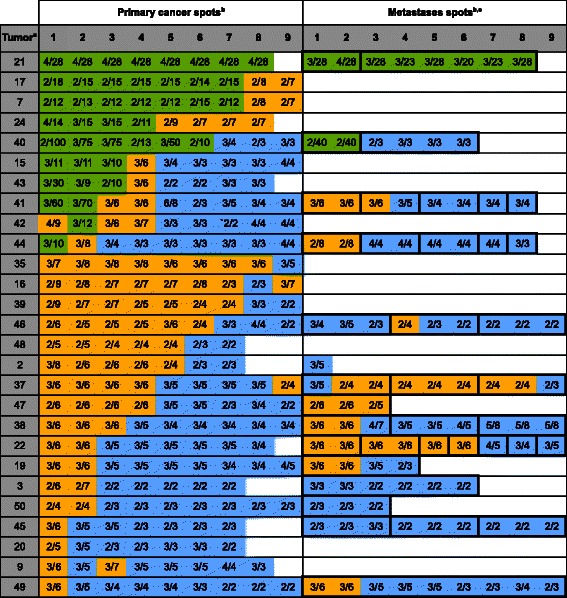
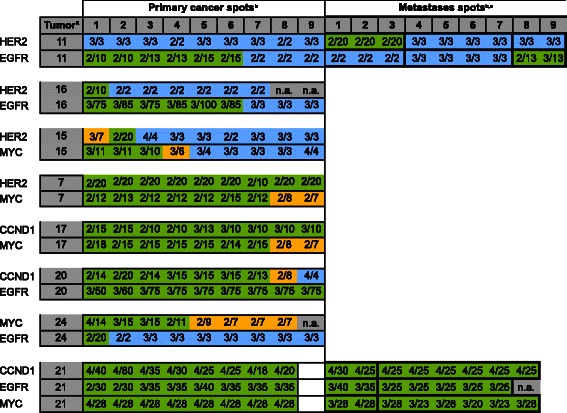
Methods: To study heterogeneity of these genes in a large patient cohort, a heterogeneity tissue microarray was constructed containing 0.6 mm tissue cores from 9 different areas of the primary gastric cancers of 113 patients and matched lymph node metastases from 61 of these patients. Dual color fluorescence in-situ hybridization was performed to assess amplification of HER2, EGFR, CCND1 and MYC using established thresholds (ratio ≥ 2.0). Her2 immunohistochemistry (IHC) was performed in addition.
Results: Amplification was found in 17.4% of 109 interpretable cases for HER2, 6.4% for EGFR, 17.4% for CCND1, and 24.8% for MYC. HER2 amplification was strongly linked to protein overexpression by IHC in a spot-by-spot analysis (p < 0.0001). Intra-tumor heterogeneity was found in the primary tumors of 9 of 19 (47.3%) cancers with HER2, 8 of 17 (47.0%) cancers with CCND1, 5 of 7 (71.4%) cancers with EGFR, and 23 of 27 (85.2%) cancers with MYC amplification. Amplification heterogeneity was particularly frequent in case of low-level amplification (<10 gene copies). While the amplification status was often different between metastases, unequivocal intra-tumor heterogeneity was not found in individual metastases.
Conclusion: The data of our study demonstrate that heterogeneity is common for biomarkers in gastric cancer. Given that both TMA tissue cores and clinical tumor biopsies analyze only a small fraction of the tumor bulk, it can be concluded that such heterogeneity may potentially limit treatment decisions based on the analysis of a single clinical cancer biopsy.
Figures
Similar articles
-
Prognostic relevance of gene amplifications and coamplifications in breast cancer.Cancer Res. 2004 Dec 1;64(23):8534-40. doi: 10.1158/0008-5472.CAN-04-1945. Cancer Res. 2004. PMID: 15574759
-
Correlation of human epidermal growth factor receptor 2 expression with clinicopathological characteristics and prognosis in gastric cancer.World J Gastroenterol. 2013;19(14):2171-8. doi: 10.3748/wjg.v19.i14.2171. World J Gastroenterol. 2013. PMID: 23599643 Free PMC article.
-
Gene amplification of CCNE1, CCND1, and CDK6 in gastric cancers detected by multiplex ligation-dependent probe amplification and fluorescence in situ hybridization.Hum Pathol. 2017 Mar;61:58-67. doi: 10.1016/j.humpath.2016.10.025. Epub 2016 Nov 15. Hum Pathol. 2017. PMID: 27864121
-
CCND1/CyclinD1 status in metastasizing bladder cancer: a prognosticator and predictor of chemotherapeutic response.Mod Pathol. 2014 Jan;27(1):87-95. doi: 10.1038/modpathol.2013.125. Epub 2013 Jul 26. Mod Pathol. 2014. PMID: 23887292
-
MYC gene amplification is often acquired in lethal distant breast cancer metastases of unamplified primary tumors.Mod Pathol. 2012 Mar;25(3):378-87. doi: 10.1038/modpathol.2011.171. Epub 2011 Nov 4. Mod Pathol. 2012. PMID: 22056952 Free PMC article.
Cited by
-
Coupling CDH17 and CLDN18 markers for comprehensive membrane-targeted detection of human gastric cancer.Oncotarget. 2016 Sep 27;7(39):64168-64181. doi: 10.18632/oncotarget.11638. Oncotarget. 2016. PMID: 27580354 Free PMC article.
-
Enhanced tumor-targeting selectivity by modulating bispecific antibody binding affinity and format valence.Sci Rep. 2017 Jan 9;7:40098. doi: 10.1038/srep40098. Sci Rep. 2017. PMID: 28067257 Free PMC article.
-
Combination of Sodium Selenite and Doxorubicin Prodrug Ac-Phe-Lys-PABC-ADM Affects Gastric Cancer Cell Apoptosis in Xenografted Mice.Biomed Res Int. 2019 Aug 19;2019:2486783. doi: 10.1155/2019/2486783. eCollection 2019. Biomed Res Int. 2019. PMID: 31531348 Free PMC article.
-
RPP30 is a novel diagnostic and prognostic biomarker for gastric cancer.Front Genet. 2022 Jul 19;13:888051. doi: 10.3389/fgene.2022.888051. eCollection 2022. Front Genet. 2022. PMID: 35928448 Free PMC article.
-
Cancer Bioinformatic Methods to Infer Meaningful Data From Small-Size Cohorts.Cancer Inform. 2015 Nov 2;14:131-9. doi: 10.4137/CIN.S32696. eCollection 2015. Cancer Inform. 2015. PMID: 26568679 Free PMC article. Review.
References
MeSH terms
Substances
LinkOut - more resources
Full Text Sources
Other Literature Sources
Medical
Research Materials
Miscellaneous
