. 2015 Feb;27(2):306-22.
doi: 10.1105/tpc.114.134205. Epub 2015 Feb 3.

Global analysis of the role of autophagy in cellular metabolism and energy homeostasis in Arabidopsis seedlings under carbon starvation

Affiliations

Global analysis of the role of autophagy in cellular metabolism and energy homeostasis in Arabidopsis seedlings under carbon starvation

Tamar Avin-Wittenberg et al. Plant Cell. 2015 Feb.

Abstract

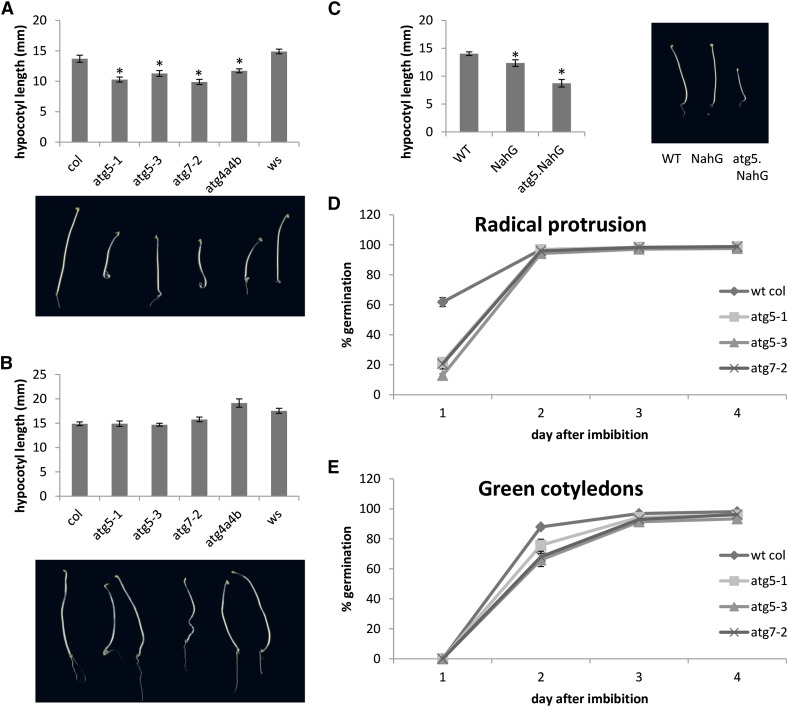
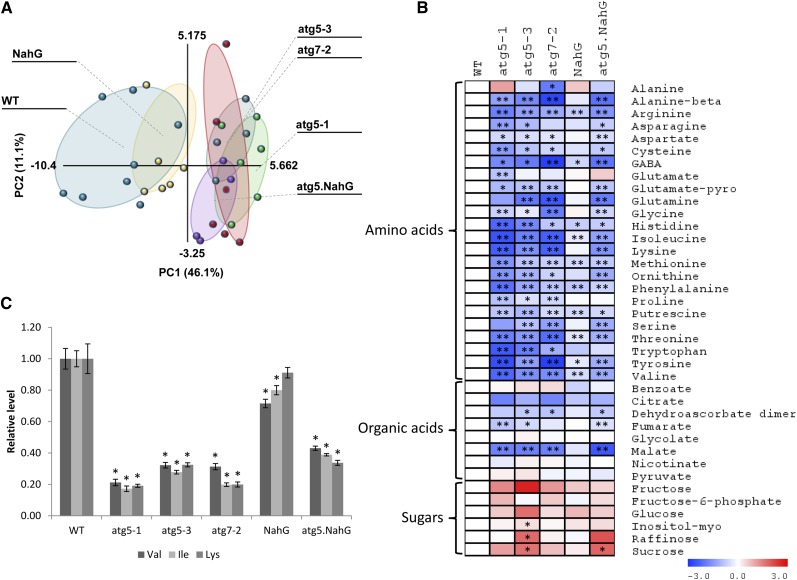
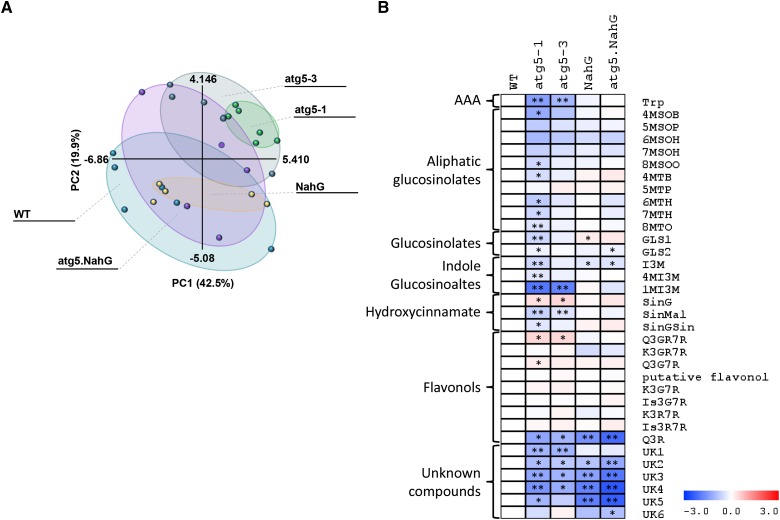
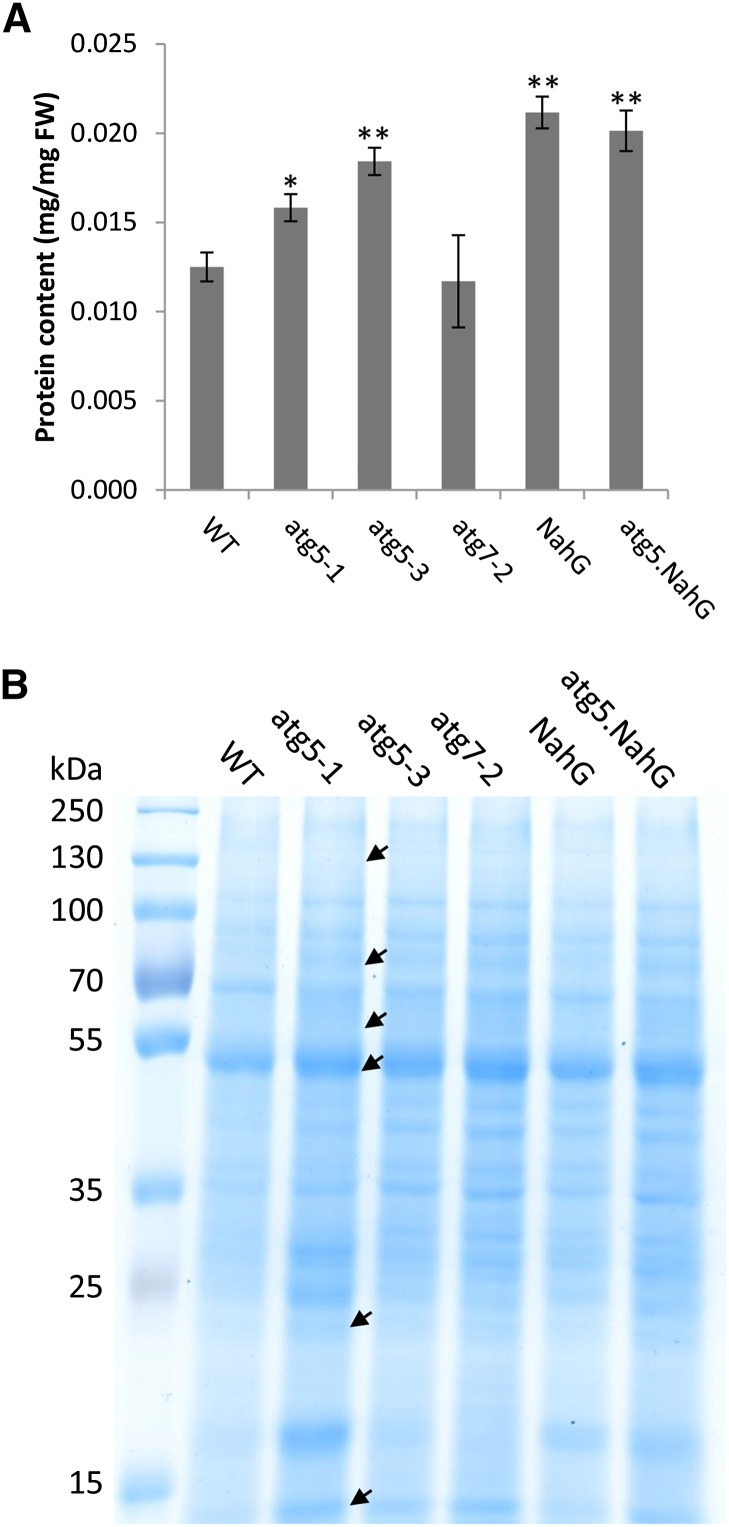
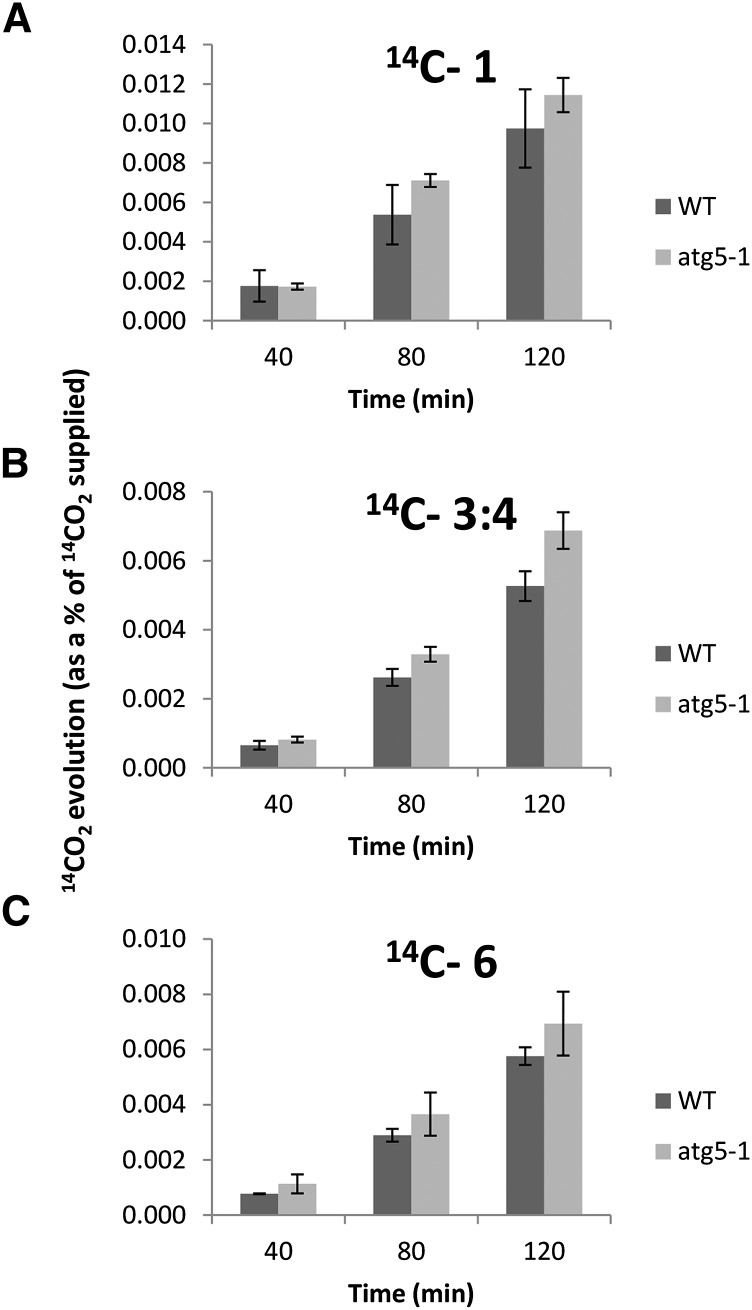
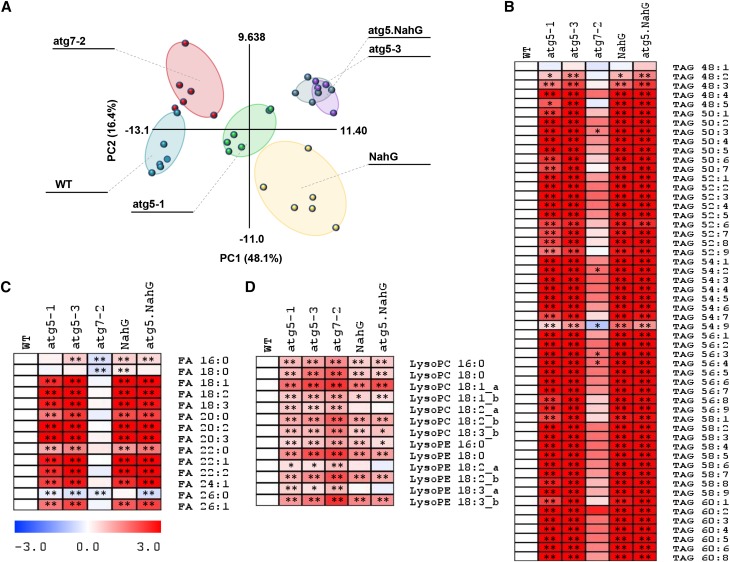
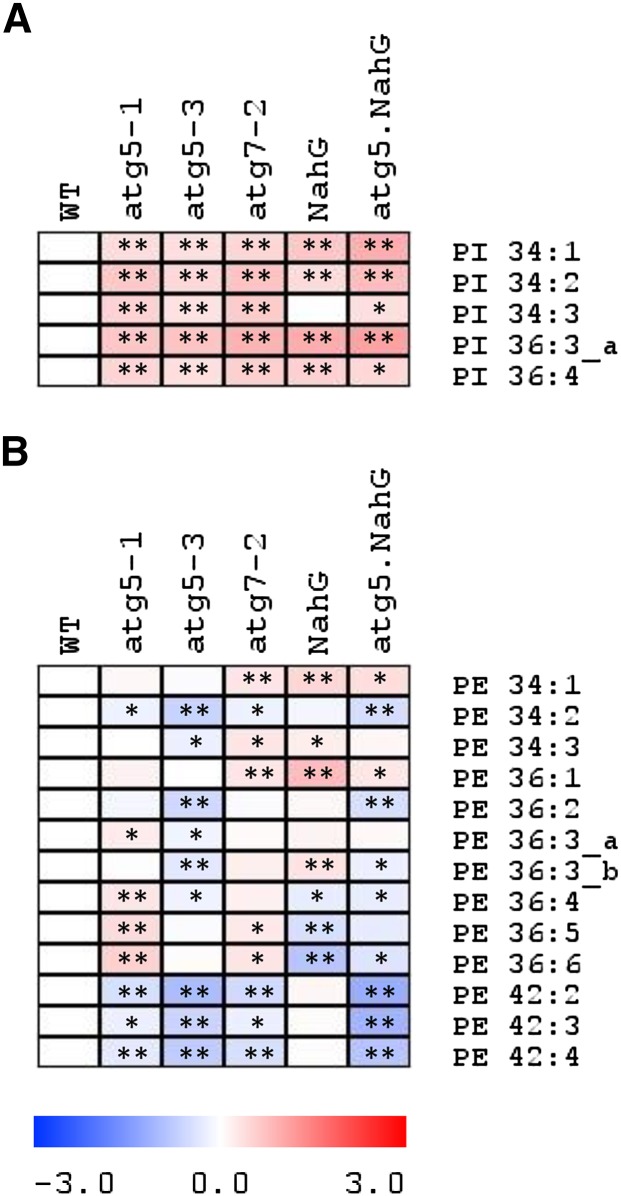
Germination and early seedling establishment are developmental stages in which plants face limited nutrient supply as their photosynthesis mechanism is not yet active. For this reason, the plant must mobilize the nutrient reserves provided by the mother plant in order to facilitate growth. Autophagy is a catabolic process enabling the bulk degradation of cellular constituents in the vacuole. The autophagy mechanism is conserved among eukaryotes, and homologs of many autophagy-related (ATG) genes have been found in Arabidopsis thaliana. T-DNA insertion mutants (atg mutants) of these genes display higher sensitivity to various stresses, particularly nutrient starvation. However, the direct impact of autophagy on cellular metabolism has not been well studied. In this work, we used etiolated Arabidopsis seedlings as a model system for carbon starvation. atg mutant seedlings display delayed growth in response to carbon starvation compared with wild-type seedlings. High-throughput metabolomic, lipidomic, and proteomic analyses were performed, as well as extensive flux analyses, in order to decipher the underlying causes of the phenotype. Significant differences between atg mutants and wild-type plants have been demonstrated, suggesting global effects of autophagy on central metabolism during carbon starvation as well as severe energy deprivation, resulting in a morphological phenotype.


Figures

Figure 1.
Figure 1.
Carbon-Starved Etiolated atg Mutant Seedlings Display Shorter Hypocotyls in Comparison to Wild-Type Plants. (A) atg mutant seeds and their respective wild-type controls (Col for atg5-1, atg5-3, and atg7-2; Ws for atg4a4b) were sown on 0.5× MS plates without sucrose and grown in the dark for 7 d after imbibition. Representative pictures of the etiolated seedling are shown as well as measurement of hypocotyl length performed using ImageJ (n = 15). Data are presented with se; significant difference compared with the wild type (P < 0.05 in Student’s t test) is denoted by an asterisk. (B) atg mutant seeds and their respective wild-type controls (Col for atg5-1, atg5-3, and atg7-2; Ws for atg4a4b) were sown on 0.5× MS plates containing 1% sucrose and grown in the dark for 7 d after imbibition. Representative pictures of the etiolated seedling are shown as well as measurement of hypocotyl length performed using ImageJ (n = 15). Data are presented with se. (C) Wild-type, NahG, and atg5.NahG seeds were sown on 0.5× MS plates without sucrose and grown in the dark for 7 d after imbibition. Representative pictures of the etiolated seedling are shown as well as measurement of hypocotyl length performed using ImageJ (n = 15). Data are presented with se; significant difference compared with the wild type (P < 0.05 in Student’s t test) is denoted by an asterisk. (D) atg mutant and wild-type control seeds were sown on 0.5× MS plates without sucrose, imbibed for 48 h, and transferred to continuous light conditions. The number of germinated seedlings (defined by radical protrusion) was scored each day for 4 d, and average percent germination (n = 6) is presented with se. Detailed results of the assay for the depicted lines as well as additional lines are presented in Supplemental Table 1. (E) atg mutant and wild-type control seeds were sown on 0.5× MS plates without sucrose, imbibed for 48 h, and transferred to continuous light conditions. The number of germinated seedlings (defined by the appearance of two green cotyledons) was scored each day for 4 d, and average percent germination (n = 6) is presented with se. Detailed results of the assay for the depicted lines as well as additional lines are presented in Supplemental Table 1.
Figure 2.
Figure 2.
atg Mutants Exhibit a Reduction in Amino Acid Levels under Carbon Starvation. atg mutants as well as their respective wild-type and SA controls (NahG and atg5.NahG) were sown on 0.5× MS plates and grown in the dark for 6 d after imbibition. Metabolic content was analyzed using GC-MS (n = 4 to 8). Detailed results of the assay for the depicted lines as well as additional lines are presented in Supplemental Table 2. (A) PCA of primary metabolite levels. (B) Log2 values of the relative metabolic content are presented as a heat map. Significant differences compared with the wild type following Student’s t test are denoted by one asterisk (P < 0.05) or two asterisks (P < 0.01). (C) Relative levels of BCAA compared with the wild type. Data are presented with se; significant differences following Student’s t test are denoted by an asterisk (P < 0.05).
Figure 3.
Figure 3.
Most of the Differences in Secondary Metabolism of atg Mutants Compared with the Wild Type Are SA Dependent. atg mutants as well as their respective wild-type and SA controls (NahG and atg5.NahG) were sown on 0.5× MS plates and grown in the dark for 6 d after imbibition. Secondary metabolite content was analyzed by LC-MS (n = 5 to 6). Detailed results of the assay for the depicted lines as well as additional lines are presented in Supplemental Table 3. (A) PCA of secondary metabolite levels. (B) Log2 values of the relative metabolic content are presented as a heat map (n = 5 to 6). Significant differences compared with the wild type following Student’s t test are denoted by one asterisk (P < 0.05) or two asterisks (P < 0.01).
Figure 4.
Figure 4.
Differential Protein Accumulation in atg Mutants Compared with the Wild Type under Carbon Starvation. atg mutants as well as wild-type and SA controls (NahG and atg5.NahG) were sown on 0.5× MS plates and grown in the dark for 6 d after imbibition. (A) Total protein amount was analyzed using BCA protein assay (n = 6). Significant differences compared with the wild type following Student’s t test are denoted by one asterisk (P < 0.05) or two asterisks (P < 0.01). (B) Separation of proteins on SDS-PAGE gel. Bands displaying higher intensity in atg mutants compared with the wild type and NahG (marked by arrowheads) were cut from the gel for mass spectrometry identification. Mass spectrometry results are detailed in Table 1.
Figure 5.
Figure 5.
14CO2 Evolution of Etiolated Seedlings in the Dark. Wild-type and atg5-1 etiolated seedlings were grown in the dark for 7 d and incubated in 10 mM MES-KOH, pH 6.5, supplemented with [1-14C]-, [3:4-14C]-, or [6-14C]Glc ([A] to [C], respectively). The 14CO2 liberated was captured (every 40 min) in a KOH trap, and the amount of radiolabel released was subsequently quantified by liquid scintillation counting. Values are presented as average ± se of determinations of four independent samples per line.
Figure 6.
Figure 6.
Lipid Analysis Suggests Altered Lipid Degradation in atg Mutants under Carbon Starvation. atg mutants as well as their respective wild-type and SA controls (NahG and atg5.NahG) were sown on 0.5× MS plates and grown in the dark for 6 d after imbibition. Lipid content was analyzed by UPLC-MS (n = 4 to 6). Detailed results of the assay for the depicted lines as well as additional lines are presented in Supplemental Data Set 1. (A) PCA of lipid levels. (B) Heat map of log2 values of TAG relative levels in comparison to the wild type. Significant differences following Student’s t test are denoted by one asterisk (P < 0.05) or two asterisks (P < 0.01). (C) Heat map of log2 values of FA relative levels in comparison to the wild type. Significant differences following Student’s t test are denoted by one asterisk (P < 0.05) or two asterisks (P < 0.01). (D) Heat map of log2 values of lysophosphatidylcholine (LysoPC) and LysoPE relative levels in comparison to the wild type. Significant differences following Student’s t test are denoted by one asterisk (P < 0.05) or two asterisks (P < 0.01).
Figure 7.
Figure 7.
Altered Levels of Autophagy-Related Lipids in Carbon-Starved atg Mutants. atg mutants as well as their respective wild-type and SA controls (NahG and atg5.NahG) were sown on 0.5× MS plates and grown in the dark for 6 d after imbibition. Lipid content was analyzed by UPLC-MS (n = 4 to 6). Detailed results of the assay for the depicted lines as well as additional lines are presented in Supplemental Data Set 1. (A) Heat map of log2 values of PI relative levels in comparison to the wild type. Significant differences following Student’s t test are denoted by one asterisk (P < 0.05) or two asterisks (P < 0.01). (B) Heat map of log2 values of PE relative levels in comparison to the wild type. Significant differences following Student’s t test are denoted by one asterisk (P < 0.05) or two asterisks (P < 0.01).

Similar articles

Cited by

References

    1. Andriotis V.M., Pike M.J., Schwarz S.L., Rawsthorne S., Wang T.L., Smith A.M. (2012). Altered starch turnover in the maternal plant has major effects on Arabidopsis fruit growth and seed composition. Plant Physiol. 160: 1175–1186. - PMC - PubMed
    1. Araújo W.L., Ishizaki K., Nunes-Nesi A., Larson T.R., Tohge T., Krahnert I., Witt S., Obata T., Schauer N., Graham I.A., Leaver C.J., Fernie A.R. (2010). Identification of the 2-hydroxyglutarate and isovaleryl-CoA dehydrogenases as alternative electron donors linking lysine catabolism to the electron transport chain of Arabidopsis mitochondria. Plant Cell 22: 1549–1563. - PMC - PubMed
    1. Araújo W.L., Tohge T., Ishizaki K., Leaver C.J., Fernie A.R. (2011). Protein degradation - an alternative respiratory substrate for stressed plants. Trends Plant Sci. 16: 489–498. - PubMed
    1. Arc E., Galland M., Cueff G., Godin B., Lounifi I., Job D., Rajjou L. (2011). Reboot the system thanks to protein post-translational modifications and proteome diversity: How quiescent seeds restart their metabolism to prepare seedling establishment. Proteomics 11: 1606–1618. - PubMed
    1. Avin-Wittenberg T., Fernie A.R. (2014). At long last: evidence for pexophagy in plants. Mol. Plant 7: 1257–1260. - PubMed

Publication types

MeSH terms

LinkOut - more resources