

The human burst suppression electroencephalogram of deep hypothermia
- PMID: 25649968
- PMCID: PMC4504839
- DOI: 10.1016/j.clinph.2014.12.022
The human burst suppression electroencephalogram of deep hypothermia
Abstract
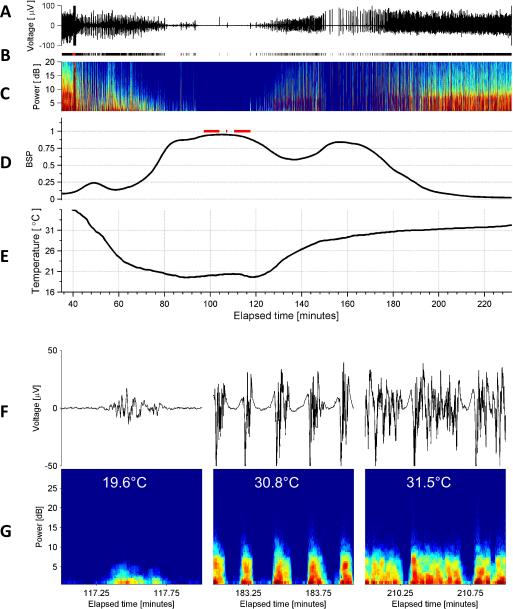
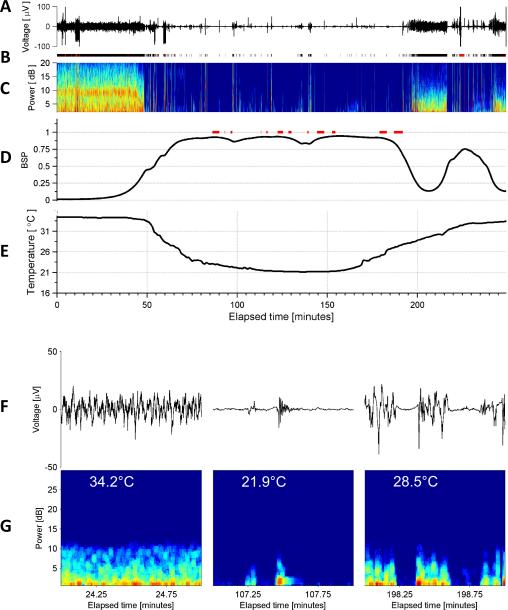
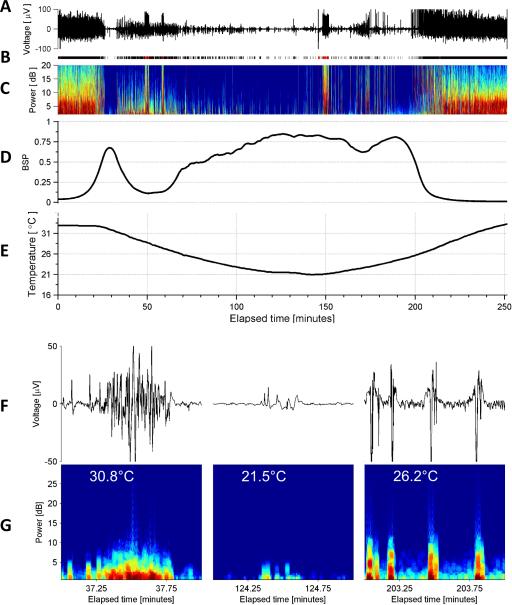
Objective: Deep hypothermia induces 'burst suppression' (BS), an electroencephalogram pattern with low-voltage 'suppressions' alternating with high-voltage 'bursts'. Current understanding of BS comes mainly from anesthesia studies, while hypothermia-induced BS has received little study. We set out to investigate the electroencephalogram changes induced by cooling the human brain through increasing depths of BS through isoelectricity.
Methods: We recorded scalp electroencephalograms from eleven patients undergoing deep hypothermia during cardiac surgery with complete circulatory arrest, and analyzed these using methods of spectral analysis.
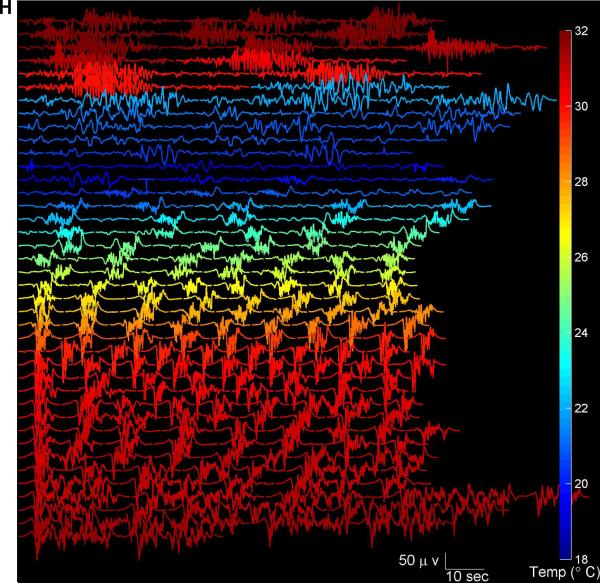
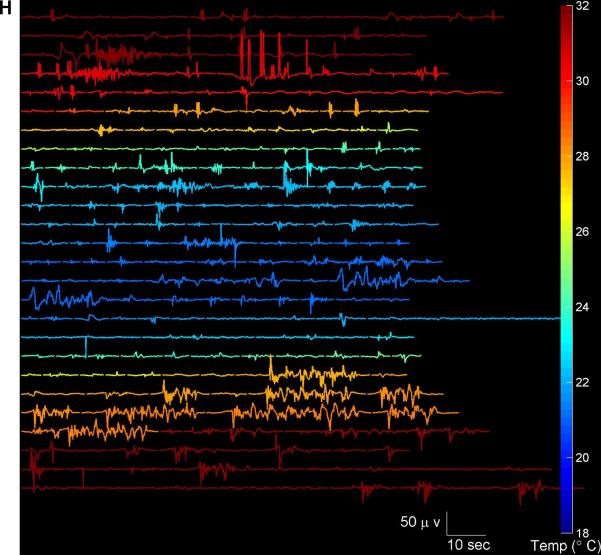
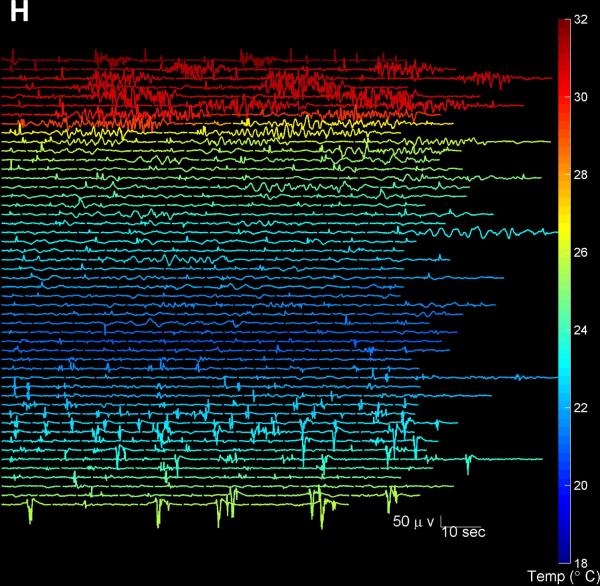
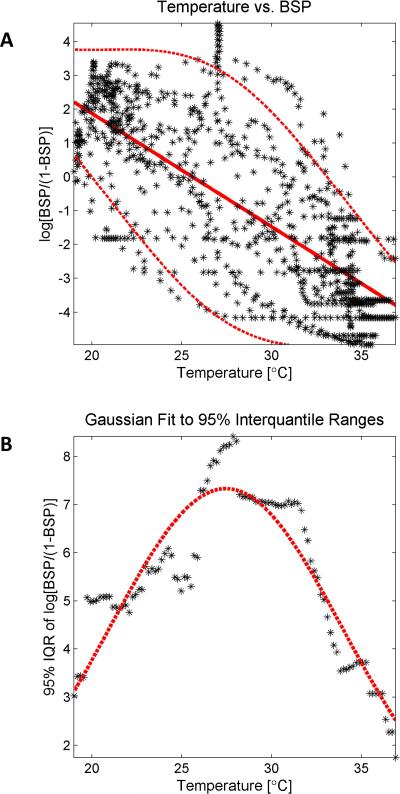
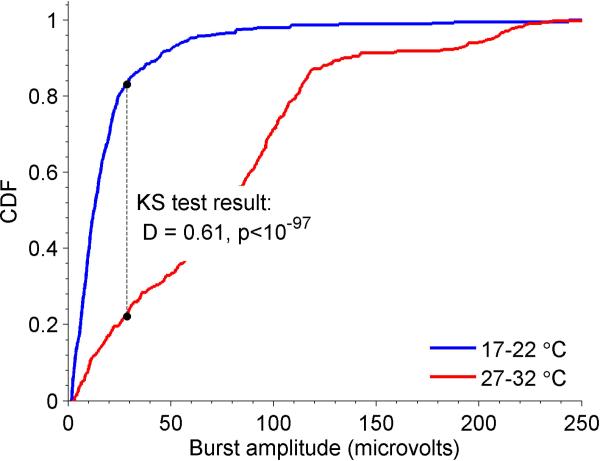
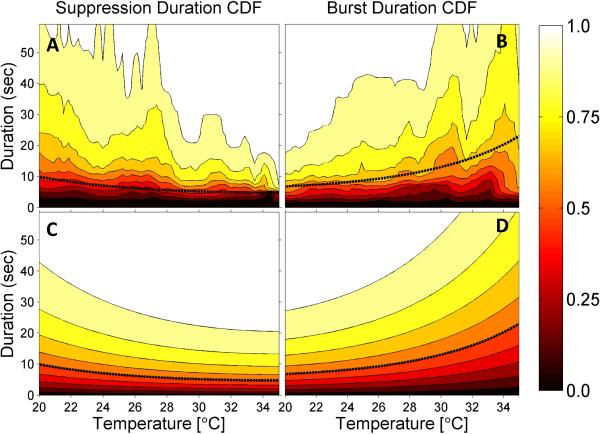
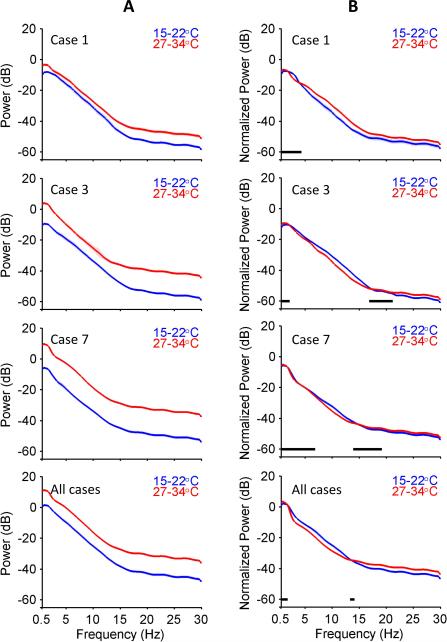
Results: Within patients, the depth of BS systematically depends on the depth of hypothermia, though responses vary between patients except at temperature extremes. With decreasing temperature, burst lengths increase, and burst amplitudes and lengths decrease, while the spectral content of bursts remains constant.
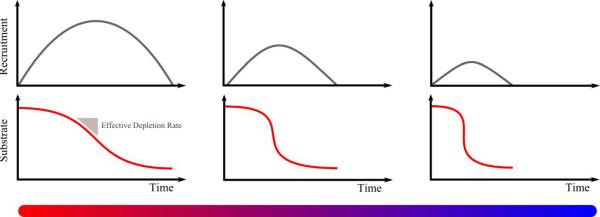
Conclusions: These findings support an existing theoretical model in which the common mechanism of burst suppression across diverse etiologies is the cyclical diffuse depletion of metabolic resources, and suggest the new hypothesis of local micro-network dropout to explain decreasing burst amplitudes at lower temperatures.
Significance: These results pave the way for accurate noninvasive tracking of brain metabolic state during surgical procedures under deep hypothermia, and suggest new testable predictions about the network mechanisms underlying burst suppression.
Keywords: Burst suppression; Electroencephalogram; Hypothermia.
Copyright © 2015 International Federation of Clinical Neurophysiology. Published by Elsevier Ireland Ltd. All rights reserved.
Figures
Similar articles
-
Local cortical dynamics of burst suppression in the anaesthetized brain.Brain. 2013 Sep;136(Pt 9):2727-37. doi: 10.1093/brain/awt174. Epub 2013 Jul 25. Brain. 2013. PMID: 23887187 Free PMC article.
-
Electroencephalogram predicts outcome in patients with postanoxic coma during mild therapeutic hypothermia.Crit Care Med. 2015 Jan;43(1):159-67. doi: 10.1097/CCM.0000000000000626. Crit Care Med. 2015. PMID: 25251761
-
The effects of mild hypothermia on thiopental-induced electroencephalogram burst suppression.J Neurosurg Anesthesiol. 1998 Jul;10(3):137-41. doi: 10.1097/00008506-199807000-00002. J Neurosurg Anesthesiol. 1998. PMID: 9681400
-
Does electroencephalographic burst suppression still play a role in the perioperative setting?Best Pract Res Clin Anaesthesiol. 2021 Jul;35(2):159-169. doi: 10.1016/j.bpa.2020.10.007. Epub 2020 Oct 31. Best Pract Res Clin Anaesthesiol. 2021. PMID: 34030801 Free PMC article. Review.
-
Neurophysiological Intraoperative Monitoring During Aortic Arch Surgery.Semin Cardiothorac Vasc Anesth. 2016 Dec;20(4):273-282. doi: 10.1177/1089253216672441. Epub 2016 Oct 4. Semin Cardiothorac Vasc Anesth. 2016. PMID: 27708177 Review.
Cited by
-
Acute continuous nocturnal light exposure decreases BSR under sevoflurane anesthesia in C57BL/6J mice: possible role of differentially spared light-sensitive pathways under anesthesia.Am J Transl Res. 2020 Jun 15;12(6):2843-2859. eCollection 2020. Am J Transl Res. 2020. PMID: 32655814 Free PMC article.
-
A working model for hypothermic neuroprotection.J Physiol. 2018 Dec;596(23):5641-5654. doi: 10.1113/JP274928. Epub 2018 May 24. J Physiol. 2018. PMID: 29660115 Free PMC article. Review.
-
Electroencephalography as a tool to predict cerebral oxygen metabolism during deep-hypothermic circulatory arrest in neonates with critical congenital heart disease.JTCVS Open. 2023 Aug 13;16:801-809. doi: 10.1016/j.xjon.2023.08.004. eCollection 2023 Dec. JTCVS Open. 2023. PMID: 38204663 Free PMC article.
-
Perioperative electroencephalography in cardiac surgery with hypothermic circulatory arrest: a narrative review.Interact Cardiovasc Thorac Surg. 2022 Sep 9;35(4):ivac198. doi: 10.1093/icvts/ivac198. Interact Cardiovasc Thorac Surg. 2022. PMID: 35904759 Free PMC article. Review.
-
Surgery on the aortic arch and feasibility of electroencephalography (SAFE) monitoring in neonates: protocol for a prospective observational cohort study.BMJ Open. 2025 Jul 10;15(7):e106423. doi: 10.1136/bmjopen-2025-106423. BMJ Open. 2025. PMID: 40639843 Free PMC article.
References
-
- Amzica F, Kroeger D. Cellular mechanisms underlying EEG waveforms during coma. Epilepsia. 2011;52(Suppl 8):25–7. - PubMed
Publication types
MeSH terms
Grants and funding
LinkOut - more resources
Full Text Sources
Other Literature Sources
