. 2015 Jun;29(6):1290-300.
doi: 10.1038/leu.2015.18. Epub 2015 Feb 4.

Mutated Ptpn11 alters leukemic stem cell frequency and reduces the sensitivity of acute myeloid leukemia cells to Mcl1 inhibition

Affiliations

Mutated Ptpn11 alters leukemic stem cell frequency and reduces the sensitivity of acute myeloid leukemia cells to Mcl1 inhibition

L Chen et al. Leukemia. 2015 Jun.

Abstract

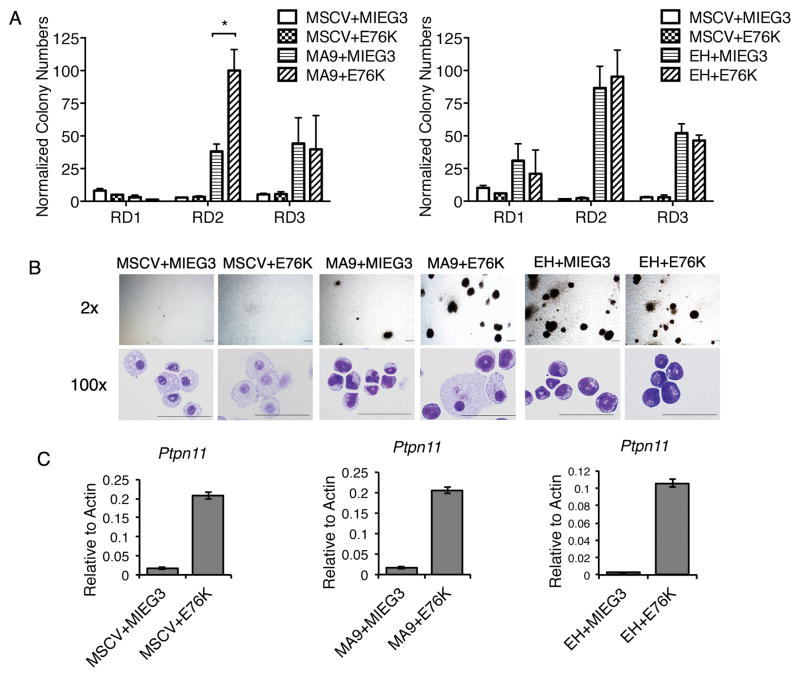
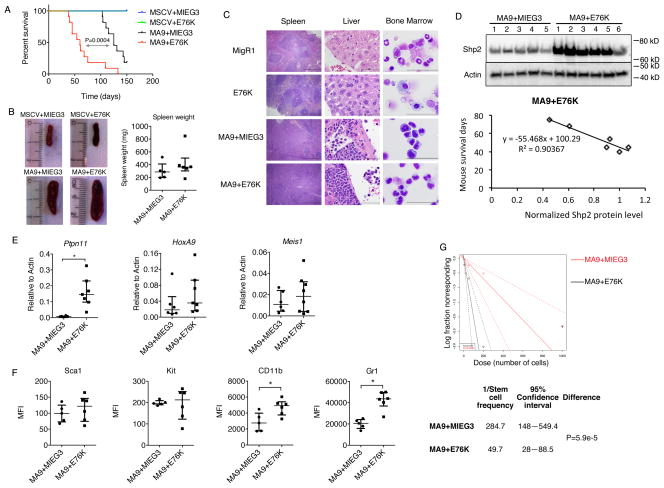
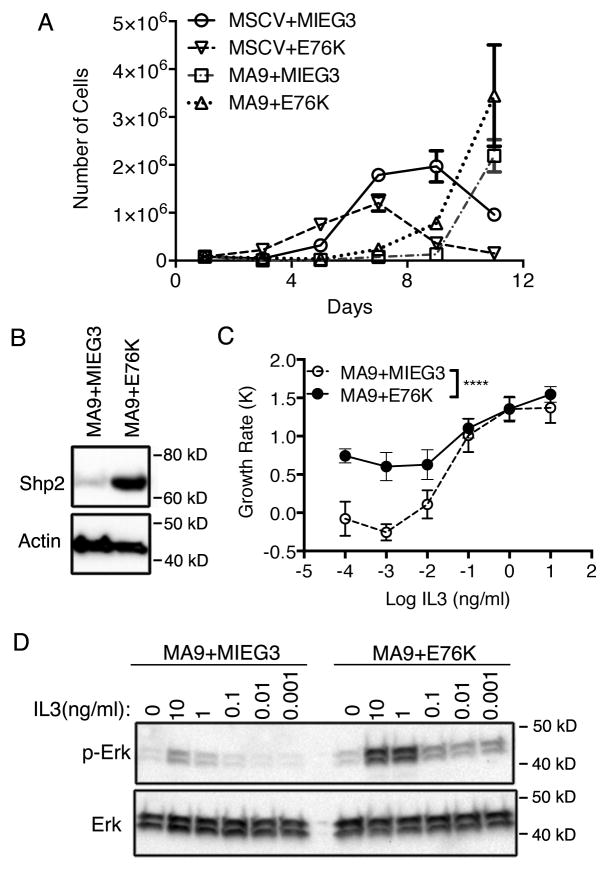
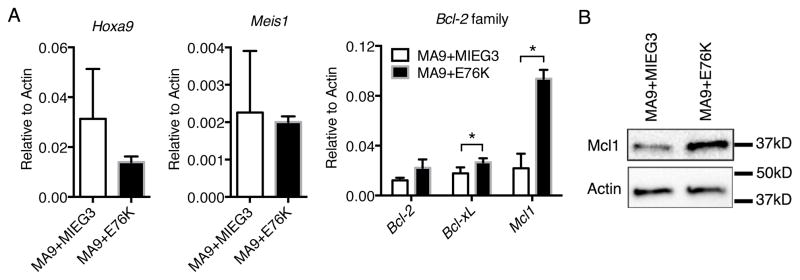
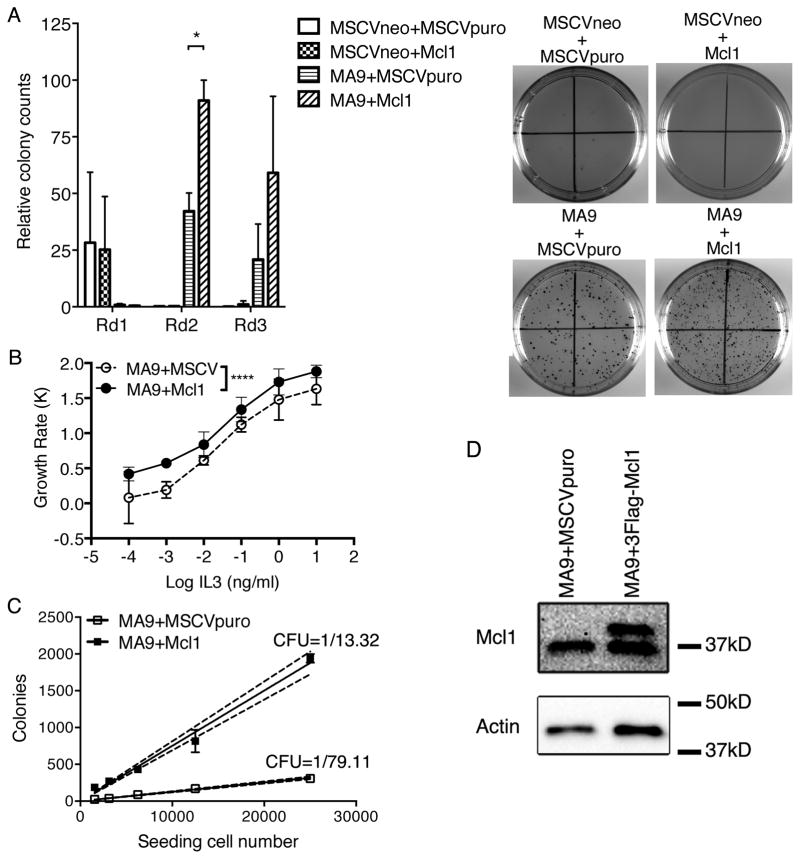
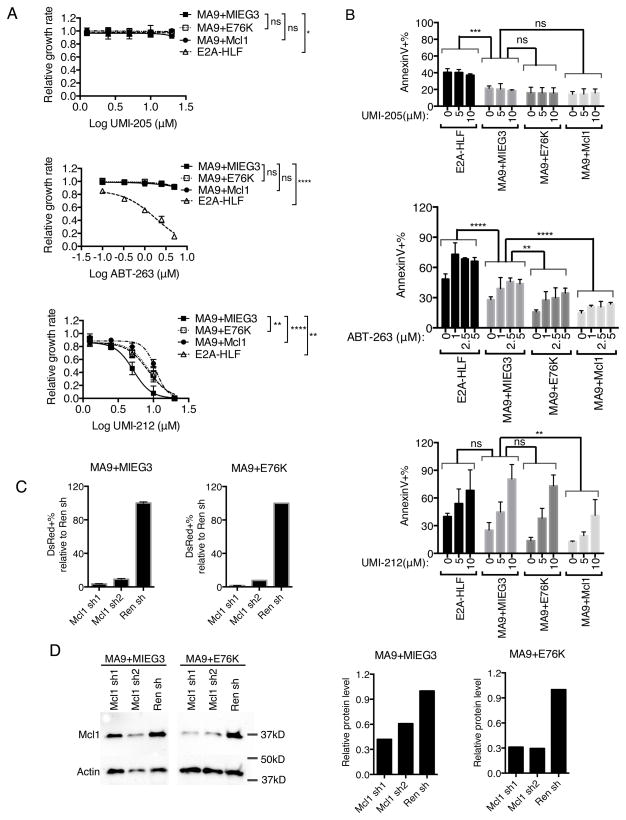
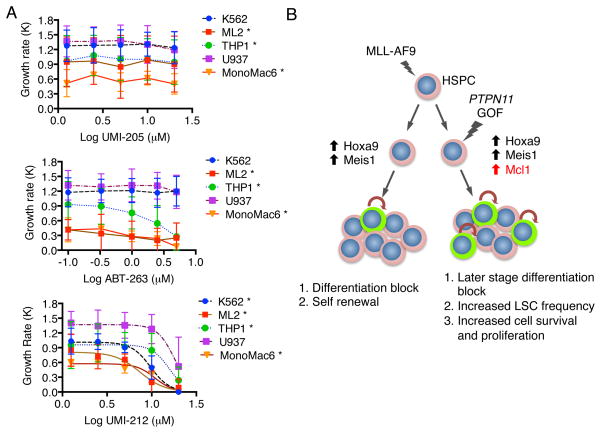
PTPN11 encodes the Shp2 non-receptor protein-tyrosine phosphatase implicated in several signaling pathways. Activating mutations in Shp2 are commonly associated with juvenile myelomonocytic leukemia but are not as well defined in other neoplasms. Here we report that Shp2 mutations occur in human acute myeloid leukemia (AML) at a rate of 6.6% (6/91) in the ECOG E1900 data set. We examined the role of mutated Shp2 in leukemias harboring MLL translocations, which co-occur in human AML. The hyperactive Shp2E76K mutant, commonly observed in leukemia patients, significantly accelerated MLL-AF9-mediated leukemogenesis in vivo. Shp2E76K increased leukemic stem cell frequency and affords MLL-AF9 leukemic cells IL3 cytokine hypersensitivity. As Shp2 is reported to regulate anti-apoptotic genes, we investigated Bcl2, Bcl-xL and Mcl1 expression in MLL-AF9 leukemic cells with and without Shp2E76K. Although the Bcl2 family of genes was upregulated in Shp2E76K cells, Mcl1 showed the highest upregulation in MLL-AF9 cells in response to Shp2E76K. Indeed, expression of Mcl1 in MLL-AF9 cells phenocopies expression of Shp2E76K, suggesting Shp2 mutations cooperate through activation of anti-apoptotic genes. Finally, we show Shp2E76K mutations reduce sensitivity of AML cells to small-molecule-mediated Mcl1 inhibition, suggesting reduced efficacy of drugs targeting MCL1 in patients with hyperactive Shp2.


Conflict of interest statement

The authors declare no conflict of interest.

The authors have no competing financial interests.

Figures

Figure 1
Figure 1
Shp2E76K increases leukemia colony formation by MLL-AF9 in vitro. (A) Hematopoietic progenitor cells were transduced with empty MSCV, MIEG3 or MSCV-F-MLL-AF9 (MA9), MSCV-E2A-HLF (EH) and MIEG3-Shp2E76K (E76K) and plated in methylcellulose media for three rounds of 7 day culture. Data shows the average and standard deviation from three independent experiments with duplicated samples normalized to the highest colony formation. Data indicates cooperation between Shp2E76K and MLL-AF9 but not E2A-HLF. (* p<0.05; t-test) (B) Representative colonies after the second round of the methylcellulose colony assays were pictured using a 2x lens on an Olympus IX71 microscope (Camera: DP73; objective lens: Plan N 2x/0.06; software: cellSens Entry 1.7)(scale bar = 500μm). Images illustrate increased colony formation specifically in MLL-AF9 transduced cells with Shp2E76K. Cell morphology is obtained by staining cytospun cells following the second round of the colony assay. Cells are imaged using a 100x lens on an Olympus BX41 microscope (Camera: DP71; objective lens: 100x/1.30; software: DP Controller)(scale bars = 50μm). (C) Overexpression of Ptpn11 is confirmed from the colony assay described in (A) by real-time qPCR following RNA extraction from cells collected after the first round of the colony assay. Expression is shown relative to β-actin expression.
Figure 2
Figure 2
Shp2E76K accelerates leukemia development by MLL-AF9 in vivo. (A) Survival of mice transplanted with cells transduced with MSCV+MIEG3 (n=4), MSCV+E76K (n=4), MA9+MIEG3 (n=11, median survival = 125 days), MA9+E76K (n=11, median survival = 60 days). MA9+E76K accelerates leukemogenesis compared to MA9+MIEG3 (p=0.0004, Log-Rank) (B) Splenomegaly is observed in leukemic mice injected with MA9+MIEG3 or MA9+E76K. Spleen weights for diseased mice are shown in the panel on the right. (C) Spleen, liver and bone marrow samples were collected from diseased MA9+MIEG3 and MA9+E76K mice and censored MSCV+MIEG3 and MSCV+E76K mice. Tissue sections or cytospun bone marrow was stained by H&E and imaged with an Olympus BX41 microscope (Camera: DP71; objective lens: 10x/0.3 for spleen, 100x/1.30 for liver and bone marrow; software: DP Controller) (scale bar = 500μm for the spleen and 50μm for liver and bone marrow images). Infiltrating leukemic blasts are evident in MA9 and MA9+E76K mice. (D) Top: Expression of Shp2 in mouse splenocytes was detected by western blot. Samples are numbered in chronological order of detection of disease. Bottom: β-Actin normalized Shp2 protein expression is plotted relative to disease latency. (E) Expression of Ptpn11, Hoxa9 and Meis1 detected by real-time PCR. (* p< 0.05; t-test) (F) Mean fluorescence intensity (MFI) of Sca1, c-Kit, Cd11b and Gr1 on MA9+MIEG3 and MA9+E76K splenocytes detected by flow cytometry. (* p< 0.05; t-test). In (B), (E) and (F), median value and error bar stands for interquartile range are shown with each dot representing one mouse. (G) MA9+MIEG3, MA9+E76K stem cell frequency determined by serially diluted secondary transplantation. 5 cells (n=10), 20 cells (n=5), 50 cells (n=10), 200 cells (n=10) and 1000 cells (n=5) from diseased primary mice were injected by i.v. into sublethally irradiated C57bl/6 syngeneic recipients. Figures and stem cell frequency were generated by ELDA (46).
Figure 3
Figure 3
Shp2E76K induces cytokine hypersensitivity in MLL-AF9 leukemic cells. (A) Lin-c-kit+ bone marrow cells were transduced with the indicated retroviruses and selected. Cells were grown in liquid culture and counted every other day. The total number of cells is plotted. (B) Shp2 expression in MA9+MIEG3, MA9+E76K cell lines are detected by western blot following whole cell lysis. (C) MA9+MIEG3 and MA9+E76K cells were cultured in serially diluted IL3 for 3 days. The growth rate was calculated and plotted showing cytokine hypersensitivity by MA9+E76K cells. (* p<0.0001; 2-way Anova; biological duplicates). (D) Western blotting was performed for total Erk and p-Erk in MA9+MIEG3 and MA9+E76K cells. Cells were cultured in serum free OPTI-MEM media overnight before a pulse with different doses of IL3 for 10 minutes.
Figure 4
Figure 4
Shp2E76K up-regulates anti-apoptotic genes in MLL-AF9 cells. (A) Cells were cultured with 0.001ng/ml IL3 and Bcl2, Bcl-xL, and Mcl1 expression is shown for MA9+MIEG3 and MA9+E76K cells relative to Actin (* for Bcl2 p=0.066, for Bcl-xL p=0.0241, for Mcl1 p=0.0067). Average transcript expression and standard deviation from biological duplicate experiments is shown relative to β–actin. (B) MA9+MIEG3 and MA9+E76K cells were cultured with 10ng/ml IL3 and Mcl1 expression was detected by western blotting.
Figure 5
Figure 5
Mcl1 partially phenocopies Shp2E76K in MLL-AF9 cells. (A) Hematopoietic progenitor cells were transduced with empty vectors, Mcl1 alone, MA9 alone or MA9+Mcl1 and plated in methylcellulose. Colonies were counted after 7 days and replated for a total of three rounds. Colonies numbers are shown relative to the highest number of colonies observed. Error bars indicate standard deviation of biological duplicate experiments. (* p<0.05; t-test). Plates were stained with INT and imaged with a ChemiDoc XRS+ Imaging System after the 3rd round. Data represents average of 3 independent experiments. (B) MA9+MSCVpuro and MA9+Mcl1 cells were cultured in serially diluted doses of IL3. Cells were counted after three days and growth rates are plotted. Data shows cytokine hypersensitivity with the overexpression of Mcl1. (* p<0.0001; 2-way Anova; biological duplicates). (C) Limiting dilution colony formation assays were performed with MA9+MIEG3 and MA9+E76K cells. The average number of colonies from biological duplicate experiments after 7 days in culture is plotted against seeding cell number with the dashed line representing a 95% confidence interval. CFU potential is determined by 1/slope. (D) Mcl1 overexpression was detected by western blotting.
Figure 6
Figure 6
Shp2E76K desensitizes MLL-AF9 cells to Mcl1 inhibition. (A) Growth rate of E2A-HLF, MA9+MIEG3, MA9+E76K, MA9+Mcl1 cells was determined after treatment with DMSO carrier or ABT-263, UMI-205, UMI-212 chemical inhibitors. Average growth rates from biological duplicate experiments are normalized to DMSO control and shown with standard deviation after 48 hours of chemical treatment and plotted against concentration with a fitted sigmoidal curve. Data indicates ABT-263 preferentially inhibits E2A-HLF while UMI-212 mediated Mcl1 inhibition preferentially inhibits MLL-AF9 cell growth, which is mitigated by Shp2E76K. (2-away Anova, * p<0.05, **p<0.01, ****p<0.0001) (B) Quantified flow cytometry data from cells co-stained with AnnexinV and DAPI. Data shows increased apoptosis with chemical inhibition of Mcl1 or Bcl2/Bcl-xL which is lessoned by Shp2E76K. Statistical analysis was performed by 2-way Anova (** p<0.01, *** p<0.001; **** p<0.0001, ns= Not Significant) (C) MA9+MIEG3, MA9+E76K cells were transduced with shRNA retroviruses targeting Mcl1 and selected with Hygromycin for 1 week before performing a competitive growth assay in the presence of Doxycycline to induce shRNA expression. Average dsRed+ population percentages with standard deviation were determined by flow cytometry after 1 day. Data is plotted relative to cells transduced with control shRNA targeting renilla (Ren sh). (D) Mcl1 knockdown was verified by western blot and the relative protein level was quantified with image lab software (BioRad).
Figure 7
Figure 7
Human leukemia cell lines with activated SHP2 mutations show resistance to Mcl1 inhibitors. (A) The growth rate of K562, U937, THP-1, Monomac6 and ML2 cells was determined following culture with UMI-205 (negative control), ABT-263 (Bcl-2/Bcl-xL inhibitor), and UMI-212 (Mcl1 inhibitor) and plotted against concentration with a fitted sigmoidal curve. Averaged data with standard deviation are shown for biological duplicate experiments normalized to DMSO treatment indicates the Shp2 mutation in U937 cells leads to greater resistance to Mcl1 inhibition. * indicates statistical significance (p<0.05) between the indicated cell line and the U937 cell line (2-way ANOVA) (B) Model of mechanistic cooperation between MLL-AF9 and Shp2E76K. A pre-leukemic clone containing an MLL-AF9 fusion protein displays blocked differentiation and increased self-renewal through upregulation of Hoxa9 and Meis1. A second genetic lesion involving a gain of function (GOF) mutation to PTPN11 leads to increased expression of Mcl1 which increases leukemic stem cell (green) frequency and cell survival.

Similar articles

Cited by

References

    1. Raimondi SC, Chang MN, Ravindranath Y, Behm FG, Gresik MV, Steuber CP, et al. Chromosomal abnormalities in 478 children with acute myeloid leukemia: clinical characteristics and treatment outcome in a cooperative pediatric oncology group study-POG 8821. Blood. 1999 Dec 1;94(11):3707–16. - PubMed
    1. Rubnitz JE, Link MP, Shuster JJ, Carroll AJ, Hakami N, Frankel LS, et al. Frequency and prognostic significance of HRX rearrangements in infant acute lymphoblastic leukemia: a Pediatric Oncology Group study. Blood. 1994 Jul 15;84(2):570–3. - PubMed
    1. Huret JL, Minor SL, Dorkeld F, Dessen P, Bernheim A. Atlas of genetics and cytogenetics in oncology and haematology, an interactive database. Nucleic Acids Res. 2000 Jan 1;28(1):349–51. - PMC - PubMed
    1. Bitoun E, Oliver PL, Davies KE. The mixed-lineage leukemia fusion partner AF4 stimulates RNA polymerase II transcriptional elongation and mediates coordinated chromatin remodeling. Hum Mol Genet. 2007 Jan 1;16(1):92–106. Epub 2006/12/01. eng. - PubMed
    1. Lin C, Smith ER, Takahashi H, Lai KC, Martin-Brown S, Florens L, et al. AFF4, a component of the ELL/P-TEFb elongation complex and a shared subunit of MLL chimeras, can link transcription elongation to leukemia. Mol Cell. 2010 Feb 12;37(3):429–37. - PMC - PubMed

Publication types

MeSH terms

Substances