. 2015 Mar;25(3):316-27.
doi: 10.1101/gr.180612.114. Epub 2015 Feb 3.

Whole-genome and multisector exome sequencing of primary and post-treatment glioblastoma reveals patterns of tumor evolution

Affiliations

Whole-genome and multisector exome sequencing of primary and post-treatment glioblastoma reveals patterns of tumor evolution

Hoon Kim et al. Genome Res. 2015 Mar.

Abstract

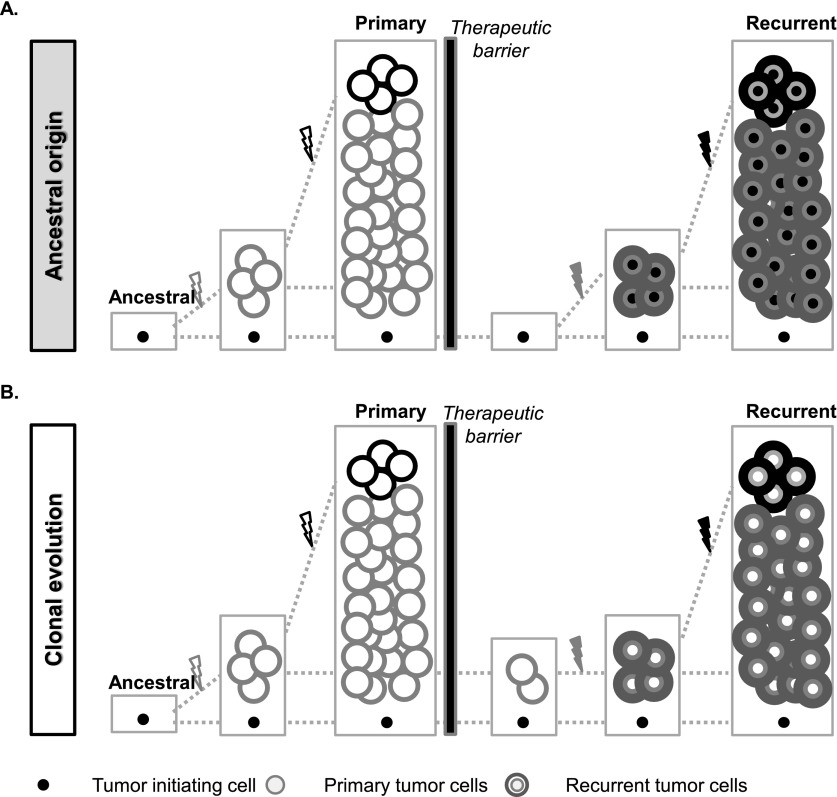
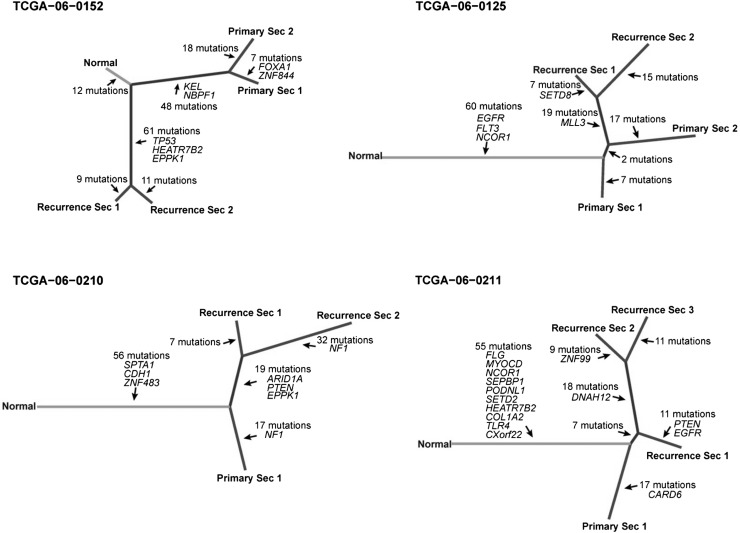
Glioblastoma (GBM) is a prototypical heterogeneous brain tumor refractory to conventional therapy. A small residual population of cells escapes surgery and chemoradiation, resulting in a typically fatal tumor recurrence ∼ 7 mo after diagnosis. Understanding the molecular architecture of this residual population is critical for the development of successful therapies. We used whole-genome sequencing and whole-exome sequencing of multiple sectors from primary and paired recurrent GBM tumors to reconstruct the genomic profile of residual, therapy resistant tumor initiating cells. We found that genetic alteration of the p53 pathway is a primary molecular event predictive of a high number of subclonal mutations in glioblastoma. The genomic road leading to recurrence is highly idiosyncratic but can be broadly classified into linear recurrences that share extensive genetic similarity with the primary tumor and can be directly traced to one of its specific sectors, and divergent recurrences that share few genetic alterations with the primary tumor and originate from cells that branched off early during tumorigenesis. Our study provides mechanistic insights into how genetic alterations in primary tumors impact the ensuing evolution of tumor cells and the emergence of subclonal heterogeneity.


Figures

Figure 1.
Figure 1.
Inference of mutational clonality and association with patient age. (A) Validation of clonal and subclonal classifications using multisector sequencing. Mutations found in all nonoverlapping tumor sectors from the same tumor were defined as ubiquitous mutations, otherwise as private. Ubiquitous and private mutations were further subdivided into clonal and subclonal mutations, resulting in four categories (ubiquitous/clonal, ubiquitous/subclonal, private/clonal, and private/subclonal). (B) The clonal mutation frequency correlates with age across 221 primary GBMs with available age information (left panel), whereas the subclonal mutation frequency does not (right panel). The patients were separated into discrete age groups by intervals of 10 yr.
Figure 2.
Figure 2.
Association of subclonal fraction with TP53 mutation and event-free survival. (A) Clonal (yellow) and subclonal (blue) mutation frequencies and their association with G-CIMP methylation phenotype (blue) and p53 pathway-related alterations. The total number of sSNVs per patient is indicated in the top panel. (B) Patients with non-G-CIMP GBM harboring a higher subclonal mutation frequency (top 30% of non-G-CIMPs; Group II; blue) exhibited a longer event-free survival time compared to non-G-CIMP patients, whose tumor cell mutations had higher clonal frequency (bottom 30% of non-G-CIMPs; Group III; red). G-CIMP cases are grouped separately into Group I (dark green) and show event-free survival similar to that of Group II. Only patients younger than 55 yr of age were included in Groups II and III, and all G-CIMP cases were included in Group I.
Figure 3.
Figure 3.
Spectrum of somatic mutations in primary and recurrent GBM. (A) The number of mutations detected in exome sequencing (top panel), clinical characteristics (second panel), EGFRvIII aberrations (third panel), copy number alterations (fourth panel), and somatic exonic mutations (bottom panel). Only frequently amplified, deleted, and mutated GBM genes are included in the copy number and mutation panels. ω (mutation of a different nucleotide in the same gene); Ω (DNA copy number alteration defined by different breakpoints). Clonal status for one sample with an extreme number of mutations could not be reliably classified and is shown in gray. (B) Comparison of subclonal (left panel) and clonal (right panel) mutation frequencies between primary or secondary GBM and matching recurrent tumors. Patients treated with TMZ are indicated with a brown triangle. (C) Association of TP53 mutation with subclonal mutational burden. Changes in clonal (left panel) and subclonal (right panel) mutation frequency are indicated as yellow dots for GBM harboring wild-type TP53 and purple triangles for tumors with mutated TP53 in both primary and recurrent tumors. The green diamond represents a patient who acquired a TP53 mutation at GBM recurrence; the blue diamond represents a case where a TP53 mutation was observed in the primary but not the matching tumor recurrence. A P-value was obtained by performing a Wilcoxon rank-sum test comparing subclonal mutation frequency change between TP53 wild-type and mutant groups.
Figure 4.
Figure 4.
Comprehensive comparison of mutations in four pairs of primary and recurrent GBM. Each row in the upper panels of AD represents exonic mutations detected in sectors of the primary tumor (P.1, P.2) and exonic mutations detected in sectors of the matching recurrent GBM (R.1, R.2, R.3). Mutations are color-coded for cancer cell fractions (tumor purity-corrected cellular frequencies), in which a cancer cell fraction of 1.0 indicates that a mutation was present in all tumor cells. The columns represent the same chromosomal nucleotide position in all samples displayed. The bottom panels of AD show scatter plots of the copy-neutral and non-LOH localizing mutations detected in whole-genome sequencing data of the primary and recurrent tumor. The x-axis and y-axis indicate purity-scaled variant allele fractions. Variant allele frequency distribution plots for individual tumors are also displayed at the bottom for primary tumor and at the right side for its matching recurrent tumor.
Figure 5.
Figure 5.
Schematic illustration of the patterns of tumor recurrence. (A) In the ancestral cell origin model, therapeutic interventions removed all dominant disease clones from the primary tumor but not refractory ancestral cells. The ancestral cell accumulates new mutations and proliferates to become the recurrent tumor. In this model, mutations shared by primary and recurrent tumors were presumably only from the ancestral cell, and the two subsequent tumors were thus more divergent. (B) In the clonal evolution model, the treatment removed most of the primary tumor cells, but cells from the major primary disease clones survived and continued to grow to result in a recurrent tumor. During this process, additional mutations were accumulated and therefore detected in the recurrent tumor, and all primary tumor clonal mutations are retained in the recurrence.
Figure 6.
Figure 6.
Phylogenetic trees based on multisector sequencing of primary and recurrent GBM. Phylogenetic trees were constructed using mutations from exome sequencing data of all biopsies of individual tumors. The length of branches in the tree proportionally represents the number of mutations, and putative cancer genes are labeled.

References

    1. Alexandrov LB, Nik-Zainal S, Wedge DC, Aparicio SA, Behjati S, Biankin AV, Bignell GR, Bolli N, Borg A, Borresen-Dale AL, et al. 2013. Signatures of mutational processes in human cancer. Nature 500: 415–421. - PMC - PubMed
    1. Andor N, Harness JV, Müller S, Mewes HW, Petritsch C. 2014. EXPANDS: expanding ploidy and allele frequency on nested subpopulations. Bioinformatics 30: 50–60. - PMC - PubMed
    1. Aparicio S, Caldas C. 2013. The implications of clonal genome evolution for cancer medicine. N Engl J Med 368: 842–851. - PubMed
    1. Bao S, Wu Q, McLendon RE, Hao Y, Shi Q, Hjelmeland AB, Dewhirst MW, Bigner DD, Rich JN. 2006. Glioma stem cells promote radioresistance by preferential activation of the DNA damage response. Nature 444: 756–760. - PubMed
    1. Bengtsson H, Wirapati P, Speed TP. 2009. A single-array preprocessing method for estimating full-resolution raw copy numbers from all Affymetrix genotyping arrays including GenomeWideSNP 5 & 6. Bioinformatics 25: 2149–2156. - PMC - PubMed

Publication types

MeSH terms

Substances