. 2015 Jan 22:3:e733.
doi: 10.7717/peerj.733. eCollection 2015.

A surge of p-values between 0.041 and 0.049 in recent decades (but negative results are increasing rapidly too)

Affiliations

A surge of p-values between 0.041 and 0.049 in recent decades (but negative results are increasing rapidly too)

Joost Cf de Winter et al. PeerJ. .

Abstract

It is known that statistically significant (positive) results are more likely to be published than non-significant (negative) results. However, it has been unclear whether any increasing prevalence of positive results is stronger in the "softer" disciplines (social sciences) than in the "harder" disciplines (physical sciences), and whether the prevalence of negative results is decreasing over time. Using Scopus, we searched the abstracts of papers published between 1990 and 2013, and measured longitudinal trends of multiple expressions of positive versus negative results, including p-values between 0.041 and 0.049 versus p-values between 0.051 and 0.059, textual reporting of "significant difference" versus "no significant difference," and the reporting of p < 0.05 versus p > 0.05. We found no support for a "hierarchy of sciences" with physical sciences at the top and social sciences at the bottom. However, we found large differences in reporting practices between disciplines, with p-values between 0.041 and 0.049 over 1990-2013 being 65.7 times more prevalent in the biological sciences than in the physical sciences. The p-values near the significance threshold of 0.05 on either side have both increased but with those p-values between 0.041 and 0.049 having increased to a greater extent (2013-to-1990 ratio of the percentage of papers = 10.3) than those between 0.051 and 0.059 (ratio = 3.6). Contradictorily, p < 0.05 has increased more slowly than p > 0.05 (ratios = 1.4 and 4.8, respectively), while the use of "significant difference" has shown only a modest increase compared to "no significant difference" (ratios = 1.5 and 1.1, respectively). We also compared reporting of significance in the United States, Asia, and Europe and found that the results are too inconsistent to draw conclusions on cross-cultural differences in significance reporting. We argue that the observed longitudinal trends are caused by negative factors, such as an increase of questionable research practices, but also by positive factors, such as an increase of quantitative research and structured reporting.

Keywords: Bias; Biological sciences; Physical sciences; Science policy; Significant differences; Social sciences.


Conflict of interest statement

The authors declare there are no competing interests.

Figures

Figure 1
Figure 1. Number of papers reporting a positive result divided by the total number of papers examined (i.e., papers reporting a positive result + papers reporting a negative result) per publication year, for three scientific disciplines.
The figure was created by graphically extracting the data shown in Fanelli’s (2012) figures. The dashed lines represent the results of a simple linear regression analysis.
Figure 2
Figure 2. Number of papers per publication year, for three scientific disciplines and three world regions.
Figure 3
Figure 3. Percentage of papers reporting a p-value between 0.041 and 0.049 and percentage of papers reporting a p-value between 0.051 and 0.059 per publication year.
Figure 4
Figure 4. Ratio of p-values between 0.041 and 0.049 to p-values between 0.051 and 0.059 per publication year.
The dashed line represents the result of a simple linear regression analysis.
Figure 5
Figure 5. Percentage of papers reporting “significant difference” and percentage of papers reporting “no significant difference” per publication year.
Figure 6
Figure 6. Ratio of “significant difference” to “no significant difference” per publication year.
The dashed line represents the result of a simple linear regression analysis.
Figure 7
Figure 7. Percentage of papers reporting p < 0.05 and percentage of papers reporting p > 0.05 per publication year.
Figure 8
Figure 8. Ratio of p < 0.05 to p > 0.05 per publication year.
The dashed line represents the result of a simple linear regression analysis.
Figure 9
Figure 9. Percentage of papers reporting a p-value between 0.041 and 0.049 and percentage of papers reporting a p-value between 0.051 and 0.059 per publication year, for three scientific disciplines.
Figure 10
Figure 10. Ratio of p-values between 0.041 to 0.049 to p-values between 0.051 and 0.059 per publication year, for three scientific disciplines.
The dashed lines represent the results of a simple linear regression analysis.
Figure 11
Figure 11. Percentage of papers reporting “significant difference” and percentage of papers reporting “no significant difference” per publication year, for three scientific disciplines.
Figure 12
Figure 12. Ratio of “significant difference” to “no significant difference” per publication year, for three scientific disciplines.
The dashed lines represent the results of a simple linear regression analysis.
Figure 13
Figure 13. Percentage of papers reporting p < 0.05 and percentage of papers reporting p > 0.05 per publication year, for three scientific disciplines.
Figure 14
Figure 14. Ratio of p < 0.05 to p > 0.05 per publication year, for three scientific disciplines.
The dashed lines represent the results of a simple linear regression analysis.
Figure 15
Figure 15. Venn diagrams showing the numbers of papers reporting a p-value between 0.041 and 0.049 (A), the numbers of papers reporting a p-value between 0.051 and 0.059 (B), and the total number of papers (C).
“Other” refers to papers purely classified into subject areas outside the three disciplines. The percentages refer to the papers that were unique to each discipline (e.g., 96.50% of biological papers with p-values between 0.041 and 0.049 belonged purely to biological sciences).
Figure 16
Figure 16. Slope coefficients calculated using a simple linear regression analysis, for the ratios of significant (S) to non-significant (NS) results (S/NS; A, B, C) and the percentages of significant results (100%*S/[S + NS]; D, E, F).
The slope coefficients are reported for all papers, and for papers in three scientific disciplines, both for cross-classified papers (grey bars) and for pure disciplines (orange bars). The numbers at the top of the figure represent: (1) first row: number of papers between 1990 and 2013 reporting significant results (S); (2) second row: number of papers between 1990 and 2013 reporting non-significant results (NS); and (3) third row: ratio of significant to non-significant results (S/NS) calculated as the yearly S/NS averaged over 1990–2013. Error bars denote 95% confidence intervals.
Figure 17
Figure 17. Ratio of p-values between 0.041 and 0.049 to p-values between 0.051 and 0.059 per publication year, for three world regions.
The dashed lines represent the results of a simple linear regression analysis.
Figure 18
Figure 18. Ratio of “significant difference” to “no significant difference” per publication year, for three world regions.
The dashed lines represent the results of a simple linear regression analysis.
Figure 19
Figure 19. Ratio of p < 0.05 to p > 0.05 per publication year for three world regions.
The dashed lines represent the results of a linear regression analysis.
Figure 20
Figure 20. Venn diagrams showing the numbers of papers reporting a p-value between 0.041 and 0.049 (A), the numbers of papers reporting a p-value between 0.051 and 0.059 (B), and the total number of papers (C).
“Other” refers to papers purely affiliated with countries outside the three world regions. The percentages refer to the papers that were unique to each world region.
Figure 21
Figure 21. Slope coefficients calculated using a simple linear regression, for the ratios of significant (S) to non-significant (NS) results (S/NS; A, B, C) and the percentages of significant results (100%*S/[S + NS]; D, E, F).
The slope coefficients are reported for papers in three world regions, both for cross-classified papers (grey bars) and for pure world regions (orange bars). The numbers at the top of the figure represent: (1) first row: number of papers between 1990 and 2013 reporting significant results (S); (2) second row: number of papers between 1990 and 2013 reporting non-significant results (NS); and (3) third row: ratio of significant to non-significant results (S/NS) calculated as the yearly S/NS averaged over 1990–2013. Error bars denote 95% confidence intervals.
Figure 22
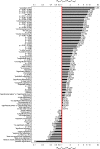
Figure 22. Logarithmic plot of the 2013-to-1990 ratio (N2013/T2013)/(N1990/T1990), where N is the number of abstracts reporting a certain expression in 2013 or 1990, and T is the total number of papers with an abstract in that year.
The number at the right end of each bar is N2013. T1990 = 561,516 and T2013 = 2,311,772.
Figure 23
Figure 23. Percentage of papers reporting a p-value as a function of the size of the p-value for three octennia.
The numbers at the top of the graph represent the ratio of the percentage of papers in 2006–2013 to the percentage of papers in 1990–1997 averaged across 0.001–0.009, 0.011–0.019, 0.021–0.029, etc.

References

    1. Asendorpf JB, Conner M, De Fruyt F, De Houwer J, Denissen JJ, Fiedler K, Wicherts JM. Recommendations for increasing replicability in psychology. European Journal of Personality. 2013;27:108–119. doi: 10.1002/per.1919. - DOI
    1. Atkin PA. A paradigm shift in the medical literature. British Medical Journal. 2002;325:1450–1451. doi: 10.1136/bmj.325.7378.1450. - DOI - PMC - PubMed
    1. Bakker M, Wicherts JM. Outlier removal, sum scores, and the inflation of the type I error rate in independent samples t tests: the power of alternatives and recommendations. Psychological Methods. 2014;19:409–427. doi: 10.1037/met0000014. - DOI - PubMed
    1. Basu S, Park HU. 2014. Publication bias in recent empirical accounting research. Available at http://ssrn.com/abstract=2379889 .
    1. Benjamini Y, Hechtlinger Y. Discussion: an estimate of the science-wise false discovery rate and applications to top medical journals by Jager and Leek. Biostatistics. 2014;15:13–16. doi: 10.1093/biostatistics/kxt032. - DOI - PubMed

LinkOut - more resources