. 2015 Apr;43(4):611-9.
doi: 10.1124/dmd.114.062877. Epub 2015 Feb 3.

Quantitative profiling of human renal UDP-glucuronosyltransferases and glucuronidation activity: a comparison of normal and tumoral kidney tissues

Affiliations

Quantitative profiling of human renal UDP-glucuronosyltransferases and glucuronidation activity: a comparison of normal and tumoral kidney tissues

Guillaume Margaillan et al. Drug Metab Dispos. 2015 Apr.

Abstract

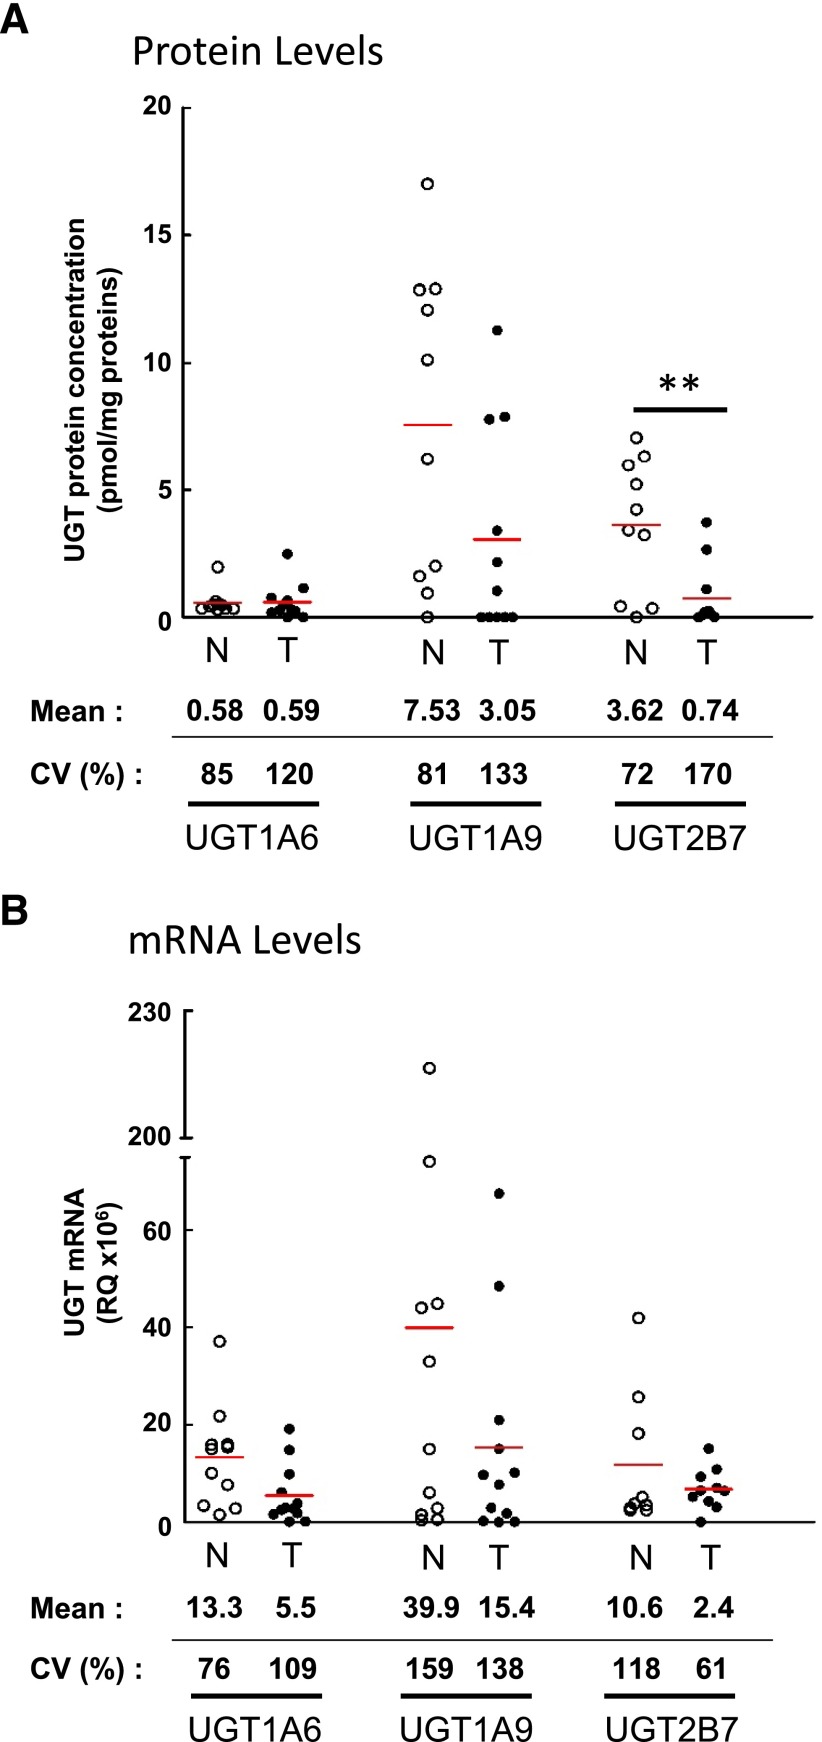
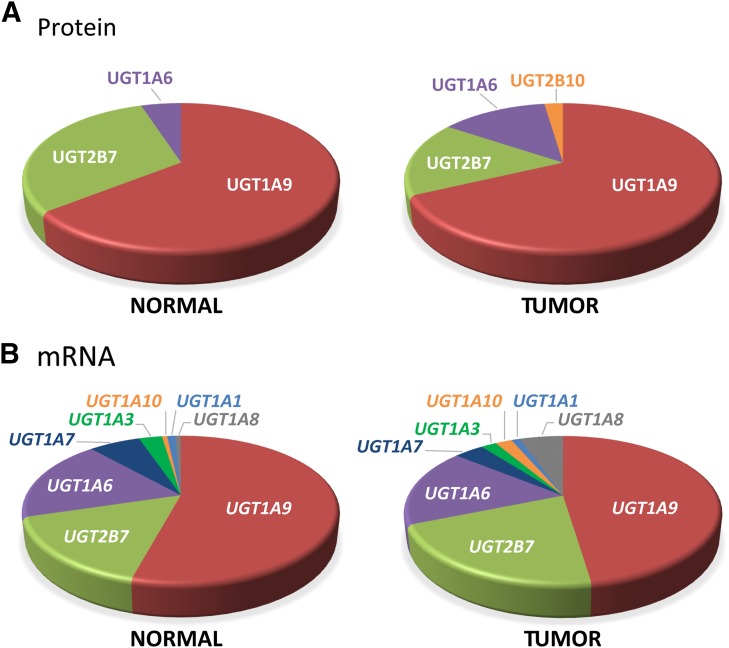
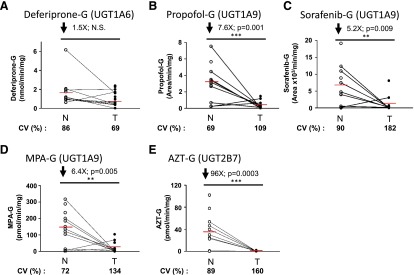
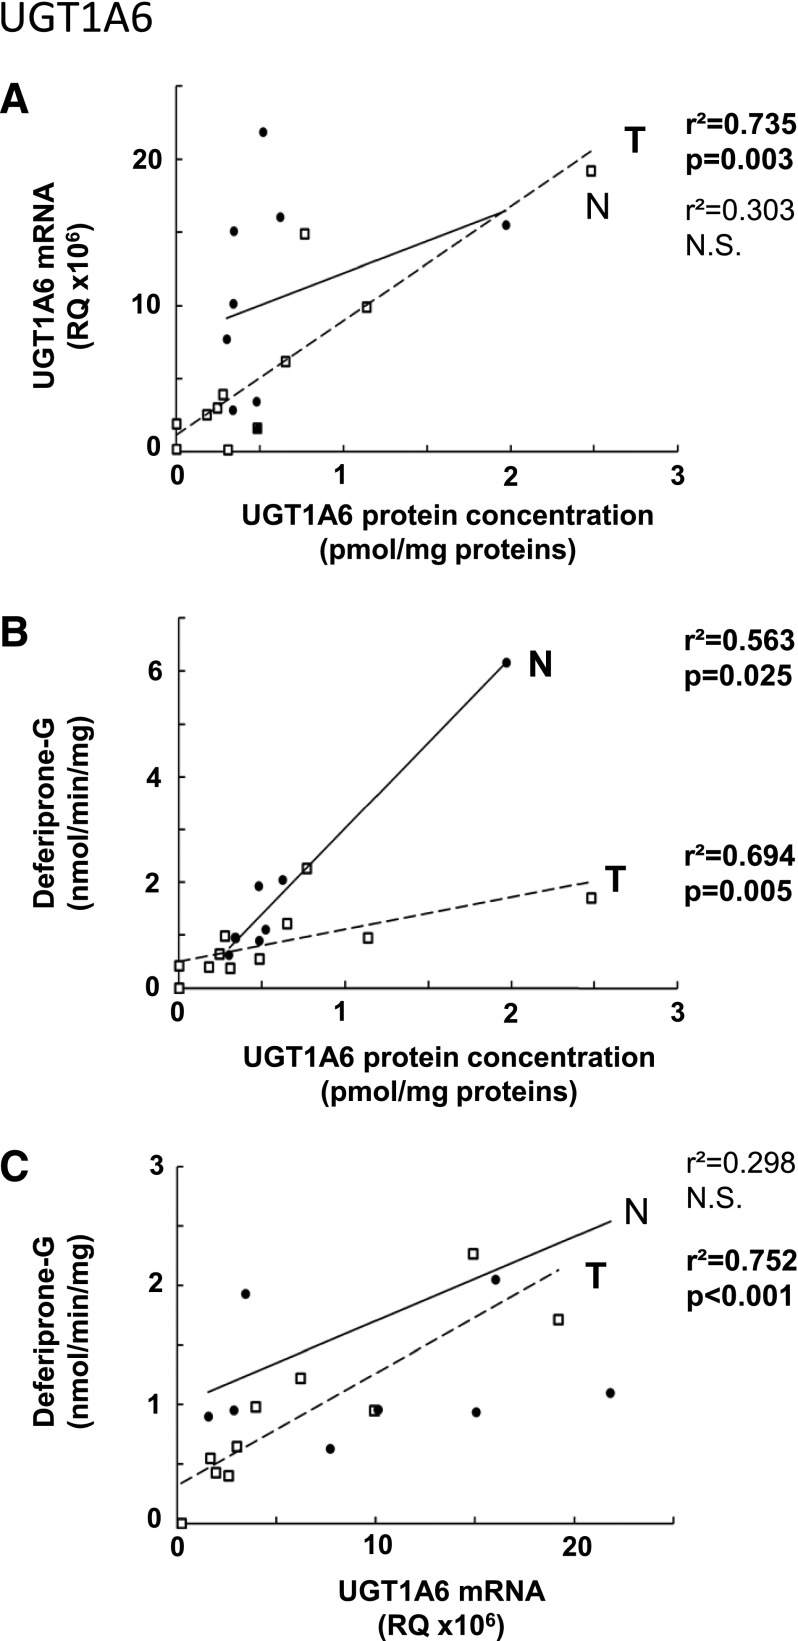
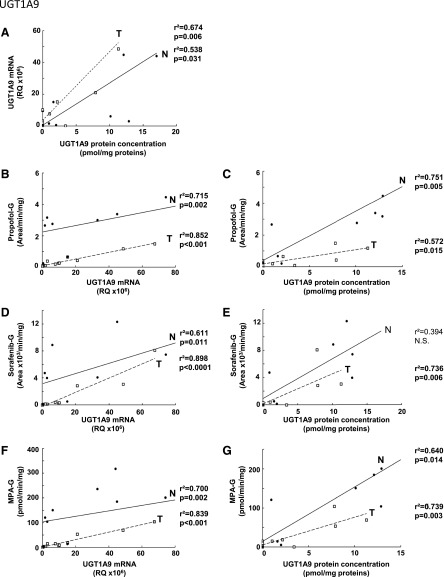
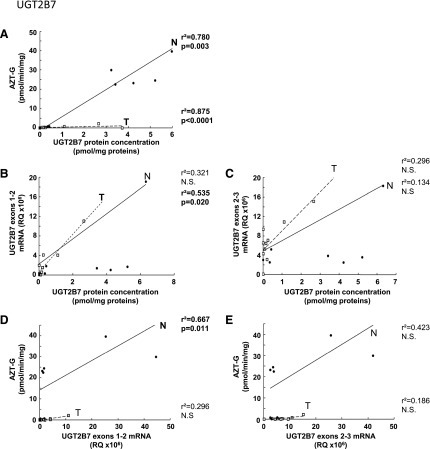
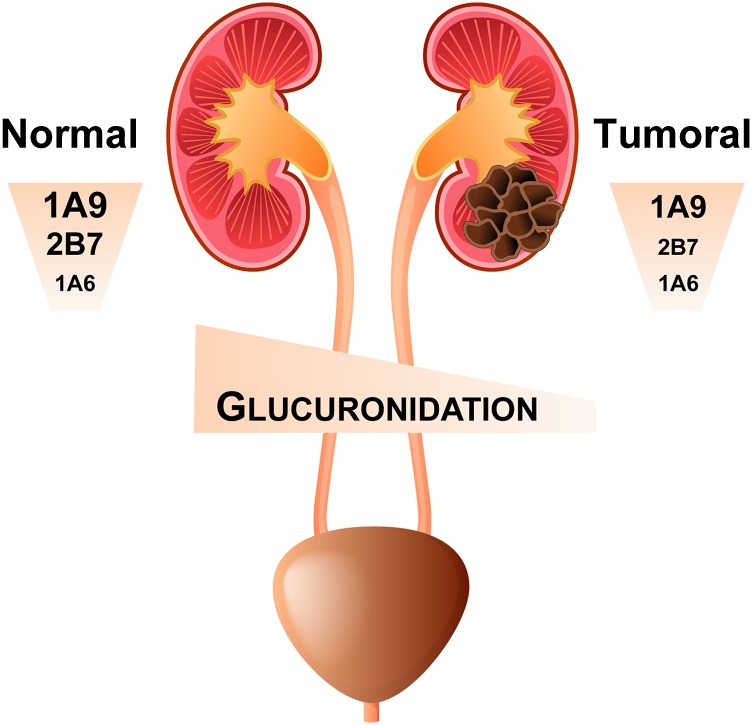
Renal metabolism by UDP-glucuronosyltransferase (UGT) enzymes is central to the clearance of many drugs. However, significant discrepancies about the relative abundance and activity of individual UGT enzymes in the normal kidney prevail among reports, whereas glucuronidation in tumoral kidney has not been examined. In this study, we performed an extensive profiling of glucuronidation metabolism in normal (n = 12) and tumor (n = 14) kidneys using targeted mass spectrometry quantification of human UGTs. We then correlated UGT protein concentrations with mRNA levels assessed by quantitative polymerase chain reaction and with conjugation activity for the major renal UGTs. Beyond the wide interindividual variability in expression levels observed among kidney samples, UGT1A9, UGT2B7, and UGT1A6 are the most abundant renal UGTs in both normal and tumoral tissues based on protein quantification. In normal kidney tissues, only UGT1A9 protein levels correlated with mRNA levels, whereas UGT1A6, UGT1A9, and UGT2B7 quantification correlated significantly with their mRNA levels in tumor kidneys. Data support that posttranscriptional regulation of UGT2B7 and UGT1A6 expression is modulating glucuronidation in the kidney. Importantly, our study reveals a significant decreased glucuronidation capacity of neoplastic kidneys versus normal kidneys that is paralleled by drastically reduced UGT1A9 and UGT2B7 mRNA and protein expression. UGT2B7 activity is the most repressed in tumors relative to normal tissues, with a 96-fold decrease in zidovudine metabolism, whereas propofol and sorafenib glucuronidation is decreased by 7.6- and 5.2-fold, respectively. Findings demonstrate that renal drug metabolism is predominantly mediated by UGT1A9 and UGT2B7 and is greatly reduced in kidney tumors.


Figures

Fig. 1.
Fig. 1.
Expression profiles of UGTs in normal and tumoral kidneys. (A) Absolute quantification of protein concentrations determined by multiple reaction monitoring in normal (n = 10) and tumoral (n = 11) kidney homogenates. (B) Relative expression of UGT mRNA levels established by reverse transcription-quantitative PCR in normal (n = 11) and tumoral (n = 12) kidneys. mRNA quantification of UGTs used a general strategy enabling amplification of all known variants. N, normal kidneys (○); T, tumoral kidneys (●). Mean protein concentrations (pmol/mg proteins) and mRNA relative quantification (×106) of each UGT are given below the graph, as well as coefficients of variation (CV) among normal and tumoral samples. Detailed quantification data are given in Tables 1 and 2. **, P≤0.01.
Fig. 2.
Fig. 2.
Relative UGT expression in normal and tumoral kidneys. (A) Relative protein concentrations of quantified UGTs in normal and tumoral kidneys, based on average concentrations from data shown in Fig. 1A and Tables 1 and 2. (B) Relative UGT mRNA expression in normal and tumoral kidneys based on reverse transcription-quantitative PCR quantification data shown in Fig. 1B and Tables 1 and 2.
Fig. 3.
Fig. 3.
Glucuronidation is impaired in tumor kidneys. Glucuronidation activity in normal and tumoral kidney homogenates for deferiprone (A), propofol (B), sorafenib (C), mycophenolic acid (D) (specifically the formation of MPA-G), and zidovudine (E). N, normal kidneys homogenates (n = 12), ○; T, tumoral kidney homogenates (n = 14), ●. Paired normal and tumoral samples are connected with a black line. Coefficients of variation (CV) among normal and tumoral samples are given. Detailed quantification data are given in Table 3. **P≤0.01; ***P≤0.001; N.S. not significant.
Fig. 4.
Fig. 4.
Correlation between UGT1A6 protein and mRNA levels (A); protein levels and deferiprone glucuronidation activity (B); mRNA levels and deferiprone glucuronidation activity (C) in normal (N, ●) and tumor (T, ) kidneys. The correlation coefficients r2 were determined using a Spearman correlation test. N.S., not significant.
Fig. 5.
Fig. 5.
Correlation between UGT1A9 protein and mRNA levels (A); mRNA levels and glucuronidation activity of propofol (B), sorafenib (D), and mycophenolic acid (F); protein levels and glucuronidation activity of propofol (C), sorafenib (E), and mycophenolic acid (G) in normal (N, ●) and tumor (T, ) kidneys. The correlation coefficients r2 were determined using a Spearman correlation test. N.S., not significant.
Fig. 6.
Fig. 6.
Correlation between UGT2B7 protein concentration and zidovudine glucuronidation activity (A); mRNA and protein levels (B, C); mRNA levels and zidovudine glucuronidation activity (D, E) in normal (N, ●) and tumor (T, ) kidneys. mRNA levels were determined for all variants using an exon 2–3 amplification strategy (B and C) or only for active variants using an exon 1-2 strategy (D and E). The correlation coefficients r2 were determined using a Spearman correlation test. N.S., not significant.
Fig. 7.
Fig. 7.
Graphical summary. Glucuronidation activity in the normal kidney is governed by UGT1A9, UGT2B7, and to a lesser extent by UGT1A6. However, UGT expression and glucuronidation activity are significantly reduced in tumor kidney tissues, with potential clinical implications for disease treatment.

References

    1. Anders MW. (1980) Metabolism of drugs by the kidney. Kidney Int 18:636–647. - PubMed
    1. Bélanger AS, Caron P, Harvey M, Zimmerman PA, Mehlotra RK, Guillemette C. (2009) Glucuronidation of the antiretroviral drug efavirenz by UGT2B7 and an in vitro investigation of drug-drug interaction with zidovudine. Drug Metab Dispos 37:1793–1796. - PMC - PubMed
    1. Bellemare J, Rouleau M, Harvey M, Popa I, Pelletier G, Têtu B, Guillemette C. (2011) Immunohistochemical expression of conjugating UGT1A-derived isoforms in normal and tumoral drug-metabolizing tissues in humans. J Pathol 223:425–435. - PubMed
    1. Benoit-Biancamano MO, Connelly J, Villeneuve L, Caron P, Guillemette C. (2009) Deferiprone glucuronidation by human tissues and recombinant UDP glucuronosyltransferase 1A6: an in vitro investigation of genetic and splice variants. Drug Metab Dispos 37:322–329. - PubMed
    1. Chu XY, Liang Y, Cai X, Cuevas-Licea K, Rippley RK, Kassahun K, Shou M, Braun MP, Doss GA, Anari MR, et al. (2009) Metabolism and renal elimination of gaboxadol in humans: role of UDP-glucuronosyltransferases and transporters. Pharm Res 26:459–468. - PubMed

Publication types

MeSH terms