

Phosphate and ADP differently inhibit coordinated smooth muscle myosin groups
- PMID: 25650929
- PMCID: PMC4317549
- DOI: 10.1016/j.bpj.2014.12.008
Phosphate and ADP differently inhibit coordinated smooth muscle myosin groups
Abstract
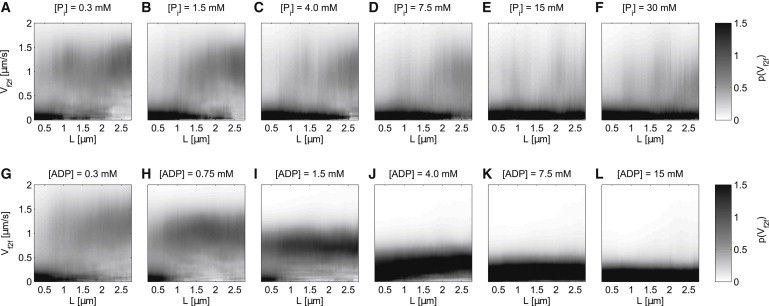
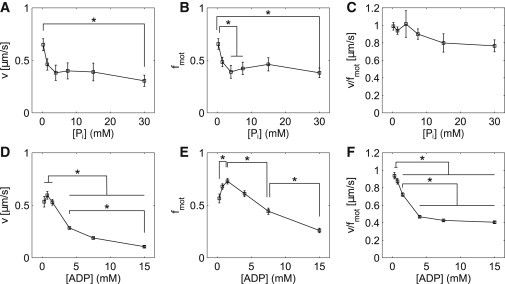
Actin filaments propelled in vitro by groups of skeletal muscle myosin motors exhibit distinct phases of active sliding or arrest, whose occurrence depends on actin length (L) within a range of up to 1.0 μm. Smooth muscle myosin filaments are exponentially distributed with ≈150 nm average length in vivo--suggesting relevance of the L-dependence of myosin group kinetics. Here, we found L-dependent actin arrest and sliding in in vitro motility assays of smooth muscle myosin. We perturbed individual myosin kinetics with varying, physiological concentrations of phosphate (Pi, release associated with main power stroke) and adenosine diphosphate (ADP, release associated with minor mechanical step). Adenosine triphosphate was kept constant at physiological concentration. Increasing [Pi] lowered the fraction of time for which actin was actively sliding, reflected in reduced average sliding velocity (ν) and motile fraction (fmot, fraction of time that filaments are moving); increasing [ADP] increased the fraction of time actively sliding and reduced the velocity while sliding, reflected in reduced ν and increased fmot. We introduced specific Pi and ADP effects on individual myosin kinetics into our recently developed mathematical model of actin propulsion by myosin groups. Simulations matched our experimental observations and described the inhibition of myosin group kinetics. At low [Pi] and [ADP], actin arrest and sliding were reflected by two distinct chemical states of the myosin group. Upon [Pi] increase, the probability of the active state decreased; upon [ADP] increase, the probability of the active state increased, but the active state became increasingly similar to the arrested state.
Copyright © 2015 Biophysical Society. Published by Elsevier Inc. All rights reserved.
Figures


Similar articles
-
The kinetics of mechanically coupled myosins exhibit group size-dependent regimes.Biophys J. 2013 Sep 17;105(6):1466-74. doi: 10.1016/j.bpj.2013.07.054. Biophys J. 2013. PMID: 24047998 Free PMC article.
-
The kinetics underlying the velocity of smooth muscle myosin filament sliding on actin filaments in vitro.J Biol Chem. 2014 Jul 25;289(30):21055-70. doi: 10.1074/jbc.M114.564740. J Biol Chem. 2014. PMID: 24907276 Free PMC article.
-
Temperature dependent measurements reveal similarities between muscle and non-muscle myosin motility.J Muscle Res Cell Motil. 2012 Dec;33(6):385-94. doi: 10.1007/s10974-012-9316-7. Epub 2012 Aug 29. J Muscle Res Cell Motil. 2012. PMID: 22930330 Free PMC article.
-
Coupling between phosphate release and force generation in muscle actomyosin.Philos Trans R Soc Lond B Biol Sci. 2004 Dec 29;359(1452):1913-20. doi: 10.1098/rstb.2004.1561. Philos Trans R Soc Lond B Biol Sci. 2004. PMID: 15647167 Free PMC article. Review.
-
Smooth muscle myosin: regulation and properties.Philos Trans R Soc Lond B Biol Sci. 2004 Dec 29;359(1452):1921-30. doi: 10.1098/rstb.2004.1562. Philos Trans R Soc Lond B Biol Sci. 2004. PMID: 15647168 Free PMC article. Review.
Cited by
-
Spreading of perturbations in myosin group kinetics along actin filaments.Proc Natl Acad Sci U S A. 2019 Aug 27;116(35):17336-17344. doi: 10.1073/pnas.1904164116. Epub 2019 Aug 12. Proc Natl Acad Sci U S A. 2019. PMID: 31405981 Free PMC article.
-
Chemomechanical regulation of myosin Ic cross-bridges: Deducing the elastic properties of an ensemble from single-molecule mechanisms.PLoS Comput Biol. 2017 May 26;13(5):e1005566. doi: 10.1371/journal.pcbi.1005566. eCollection 2017 May. PLoS Comput Biol. 2017. PMID: 28549064 Free PMC article.
References
Publication types
MeSH terms
Substances
LinkOut - more resources
Full Text Sources
Other Literature Sources
Research Materials
Miscellaneous
