. 2015 Feb 3;21(2):323-334.
doi: 10.1016/j.cmet.2015.01.006.

Suppression of insulin production and secretion by a decretin hormone

Affiliations

Suppression of insulin production and secretion by a decretin hormone

Ronald W Alfa et al. Cell Metab. .

Erratum in

Abstract

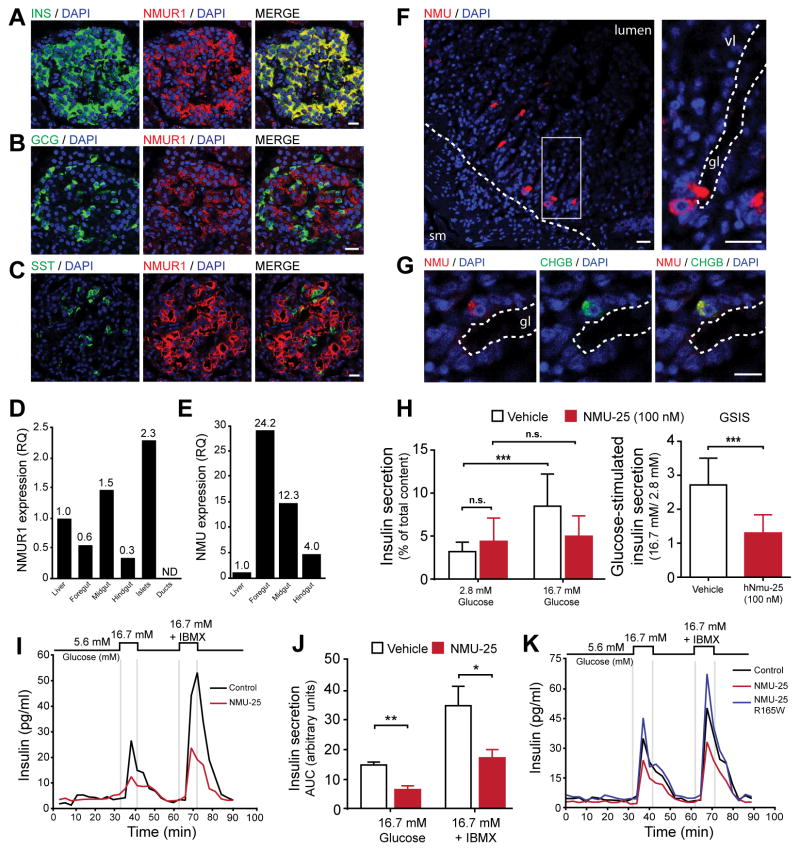
Decretins, hormones induced by fasting that suppress insulin production and secretion, have been postulated from classical human metabolic studies. From genetic screens, we identified Drosophila Limostatin (Lst), a peptide hormone that suppresses insulin secretion. Lst is induced by nutrient restriction in gut-associated endocrine cells. limostatin deficiency led to hyperinsulinemia, hypoglycemia, and excess adiposity. A conserved 15-residue polypeptide encoded by limostatin suppressed secretion by insulin-producing cells. Targeted knockdown of CG9918, a Drosophila ortholog of Neuromedin U receptors (NMURs), in insulin-producing cells phenocopied limostatin deficiency and attenuated insulin suppression by purified Lst, suggesting CG9918 encodes an Lst receptor. NMUR1 is expressed in islet β cells, and purified NMU suppresses insulin secretion from human islets. A human mutant NMU variant that co-segregates with familial early-onset obesity and hyperinsulinemia fails to suppress insulin secretion. We propose Lst as an index member of an ancient hormone class called decretins, which suppress insulin output.


Figures

Figure 1
Figure 1. Loss of Lst, a Starvation-Regulated Prepropeptide, Causes Hyperinsulinemia
(A) Genomic organization of lst locus (previously CG8317) with location of P{EP}G424 and breakpoints of lst1 deletion. (B) Schematic of preprolimostatin with predicted signal peptide and dibasic cleavage sites (red, underline). The highly conserved region used to generate Lst-15 is indicated between cleavage sites #2 and #3 (magenta, bold). Lst antibodies and control peptide were generated using a 9-amino acid peptide as indicated (underline). (C) Time-course of lst expression during starvation in wild type adult flies, normalized to fed condition. (D) Glucose levels in control and lst mutant flies. (E) Lifespan of yw; lstctrl (n=164) and yw; lst1 (n=173) male flies. Median survival times are 57 and 43 days for yw; lstctrl and yw; lst1 flies, respectively. P<0.0001 (Log-rank test). (F) Ilp2 expression in adult yw; lst1 flies compared to isogenic controls (yw; lstctrl). (G) Hemolymph levels of Ilp2HF in yw; lstctrl; Ilp2HF and yw; lst1; Ilp2HF flies (Ilp2HF homozygous). All data displayed as mean + s.d. * P<0.05, ** P<0.01, *** P<0.001 (n ≥ 5 for all conditions). See also Figure S1.
Figure 2
Figure 2. Obesity in lst Mutants
(A) Triglyceride content of control Ilp2-GAL4 and Ilp2-GAL4>NaChBAC flies. (B, C) Whole fly triglyceride content and nile red staining of abdominal lipid droplets in adult lst1 flies and controls. (D) Triglyceride content after silencing of IPCs using Ilp2-GAL4 to drive UAS-Kir2.1 in yw; lstctrl and yw; lst1 background, normalized to yw; lstctrl; Ilp2-GAL4>UAS-Kir2.1. (E) Triglyceride levels in yw; lst1 and controls in random fed, starved, and starved then overnight re-fed flies. Data are normalized to yw; lstctrl fed condition. (F, G) Quantification of triglyceride depletion after starvation and triglyceride accumulation following refeeding after starvation, data from experiment in (E). Scale bar 15 μm in (C). Data displayed as mean + s.d. * P<0.05, ** P<0.01, and *** P<0.001, (n = 5–8 per condition). See also Figure S2.
Figure 3
Figure 3. Lst is Produced in Gut-Associated CC cells
(A) Expression of Lst-GAL4>CD4::tdTomato and AKH immunoreactivity in CC cells. Labels here and below: cc, corpora cardiaca; ca, corpus allatum; he, heart/dorsal vessel. (B) Dense-core vesicle marker preproANF::EMD (GFP) and Lst antibody staining of CC cells. Outline marks ring gland. Arrow indicates CC cell soma, arrowhead marks path of dorsal vessel. (C) AKH and Lst immunoreactivity in ring gland of control and lst mutant flies. Labels as above, hatched denotes boundary of ring gland. (D–F) Glucose, circulating Ilp2HF (heterozygous Ilp2HF flies) and triglyceride levels following knock-down of lst in CC cells using Akh-GAL4 (lstRNAi) compared to isogenic controls (VDRCctrl). (G) Triglyceride content in controls (yw; lstctrl; Akh-GAL4), lst mutants (yw; lst1; Akh-GAL4) and following rescue with UAS-lst (yw; lst1; Akh-GAL4/UAS-lst). Scale bars 10 μm in (A–C). Data displayed as mean + s.d. ** P<0.01, and *** P<0.001. See also Figure S3.
Figure 4
Figure 4. Lst Regulates Insulin Secretion in Response to Dietary Sugar
(A, B) qPCR analysis of lst expression in wild-type adult flies starved then refed for 30, 60, or 120 minutes with carbohydrate only (A) or protein only (B) food. 0 time point indicates flies starved and not refed. (C) Hemolymph Ilp2HF levels in lst mutants (purple bars) and controls (open bars) refed for 0, 30 or 60 minutes following starvation. 0 time point indicates starved. Flies here homozygous for Ilp2HF. Data displayed as mean + s.d. * P<0.05, ** P<0.01, and *** P<0.001
Figure 5
Figure 5. Lst-15 Inhibits Electrical Activity and Insulin Secretion from IPCs
(A) GCaMP3 fluorescence in head-fixed adult flies expressing GCaMP3 in IPCs under the control of the Ilp2 promoter. Baseline images from IPCs in standard AHL (3 mM glucose) before treatment. Treatment panel images were obtained 30s after treatment with control peptide or Lst-15 (125 nM and 1 μM) diluted in standard AHL and displayed with 16-color look-up table. IPC cell clusters are indicated by hatched outline and individual cells in the imaging plane are numbered around perimeter of the cluster. Average ΔF/F% from baseline for each condition are plotted (bottom, right). (B) Normalized Ilp2HF protein secreted into supernatant from Drosophila heads incubated for 30 minutes in standard AHL with control peptide or Lst-15 peptide (1 μM) under basal and high-KCl conditions as indicated. Data are normalized to basal control condition. Scale bars 10 μm in (A). Data displayed as mean + s.d. *** P<0.001
Figure 6
Figure 6. CG9918 is a Candidate Lst receptor
(A) qPCR for expression of Drosophila GPCRs in lst over-expression (r4-G4>UAS-lst) or lst1 loss of function. Expression changes in comparison to control are indicated by gray (no change), green (decreased), purple (elevated), and black (not determined). Red arrowheads denote transcripts reciprocally regulated and assessed in (B). (B) Triglyceride levels following IPC specific knockdown of receptors identified in (A) (red arrowheads). Receptors encoded by CG9918, CG4395, and CG7285 were knocked down in IPCs using Ilp2-GAL4; UAS-Dcr2. AKHR was included as a negative control. (C, D) Ilp2 expression and hemolymph Ilp2HF levels in CG9918RNAi flies and controls (Ilp2HF heterozygous here). (E) lst expression in CG9918RNAi flies. Data in (B,C, E) normalized to control condition. (F) Fluorescent in situ hybridization (FISH) for CG9918 mRNA with immunohistochemistry (IHC) using antibodies against Ilp2 in control and CG9918RNAi flies. (G) Normalized Ilp2HF levels in supernatant from CG9918RNAi and control heads incubated with 1 μM Lst-15 (red bars) or Lst control peptide (open bars). (H) Summary model for Lst signaling. Ingested carbohydrates levels are monitored by CC-cells. Under carbohydrate poor conditions, secreted Lst hormonally suppresses activity and secretion of Ilps from Insulin-producing cells (IPCs). Scale bar 25 μm in (F). Data displayed as mean + s.d. * P<0.05, ** P<0.01, *** P<0.001. See also Figure S4.
Figure 7
Figure 7. NMU signaling suppresses insulin secretion from human β-cells
(A–C) Immunofluorescence for NMUR1 and Insulin (β-cells), Glucagon (α-cells), or Somatostatin (δ-cells) in adult human pancreas. (D) qPCR analysis of NMUR1 expression in human gastrointestinal tissues, including purified human islets and pancreatic ductal cells. Data expressed as relative quantification (RQ) and normalized to liver sample. N.D., not detected. (E) qPCR analysis of NMU expression in human gastrointestinal tissues. Data expressed as relative quantification (RQ) and normalized to liver sample. (F) NMU immunoreactivity in villous mucosa of human duodenum. Mucosal villi (vl) oriented toward lumen at upper right of image. Hatched line in left panel denotes boundary of mucosal layer. Magnification of boxed region in right panel shows base of duodenal gland (gl), with lumen outlined by hatched line and open-type enteroendocrine cell immunoreactive for NMU. (G) NMU and Chromogranin B immunoreactivity in open-type enteroendocrine cell. Lumenal edge of duodenal gland (gl) is marked by hatched line. Scale bars 10 μM in (A–C) and 20 μM in (D, E). (H) Insulin secretion from human islets from 59 year-old male donor assayed in static batch assay with vehicle or 100 nM NMU-25. Data normalized to insulin content and expressed as percent of total content. Glucose-stimulated insulin secretion (GSIS) panel (right) displays ratio of stimulated (16.7 mM) to basal (2.8 mM) secretion. (I) Insulin secretion from human islet perifusion assay using islets from 40 year-old male donor. NMU-25 (red trace) was applied at 100 nM and included in all incubation solutions. Top diagram depicts stimulation protocol. IBMX, 3-isobutyl-1-methylxanthine. (J) Quantification of insulin secretion area under the curve (AUC) from independent perifusion experiments (in Figure 7I, 7K and Figure S5I) using islets from 3 human donors under stimulation conditions (16.7 mM glucose or 16.7 mM + IBMX). Islets were treated with vehicle (open bars) or 100 nM NMU-25 (red bars). Error bars SEM. (K) Insulin secretion in human islet perifusion assay using islets from a 49 year-old male donor. NMU-25 (red trace) and mutant NMU-25 R165W (blue) were applied at 100 nM and included in all incubation solutions. * P < 0.05, ** P < 0.01, *** P < 0.001. See also Figure S5.

References

    1. Baker KD, Thummel CS. Diabetic larvae and obese flies-emerging studies of metabolism in Drosophila. Cell Metab. 2007;6:257–266. - PMC - PubMed
    1. La Barre J. Sur les possibilites d’un traitement du diabète par l’incrétine. Bull Acad R Med Belg. 1932;12:620–634.
    1. Bechtold DA, Ivanov TR, Luckman SM. Appetite-modifying actions of pro-neuromedin U-derived peptides. Am J Physiol Endocrinol Metab. 2009;297:E545–51. - PMC - PubMed
    1. Bellen HJ, Levis RW, Liao G, He Y, Carlson JW, Tsang G, Evans-Holm M, Hiesinger PR, Schulze KL, Rubin GM, et al. The BDGP gene disruption project: single transposon insertions associated with 40% of Drosophila genes. Genetics. 2004;167:761–781. - PMC - PubMed
    1. Broughton S, Alic N, Slack C, Bass T, Ikeya T, Vinti G, Tommasi AM, Driege Y, Hafen E, Partridge L. Reduction of DILP2 in Drosophila triages a metabolic phenotype from lifespan revealing redundancy and compensation among DILPs. PLoS One. 2008;3:e3721. - PMC - PubMed

Publication types