

An analysis of DNA methylation in human adipose tissue reveals differential modification of obesity genes before and after gastric bypass and weight loss
- PMID: 25651499
- PMCID: PMC4301800
- DOI: 10.1186/s13059-014-0569-x
An analysis of DNA methylation in human adipose tissue reveals differential modification of obesity genes before and after gastric bypass and weight loss
Abstract
Background: Environmental factors can influence obesity by epigenetic mechanisms. Adipose tissue plays a key role in obesity-related metabolic dysfunction, and gastric bypass provides a model to investigate obesity and weight loss in humans.
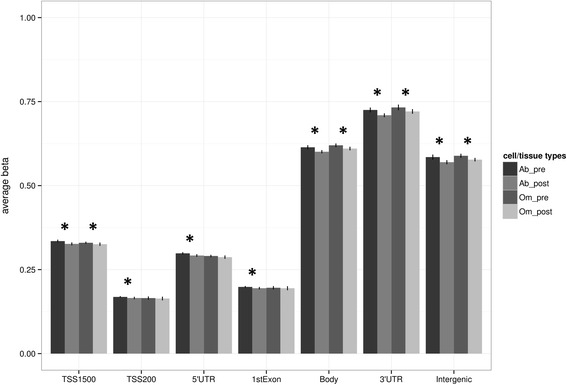
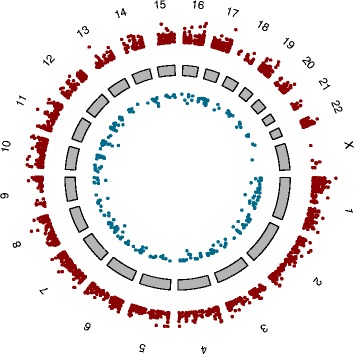
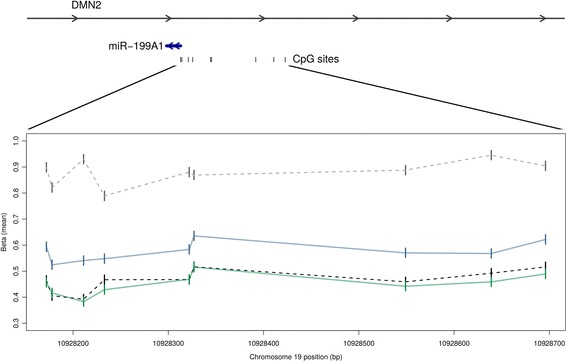
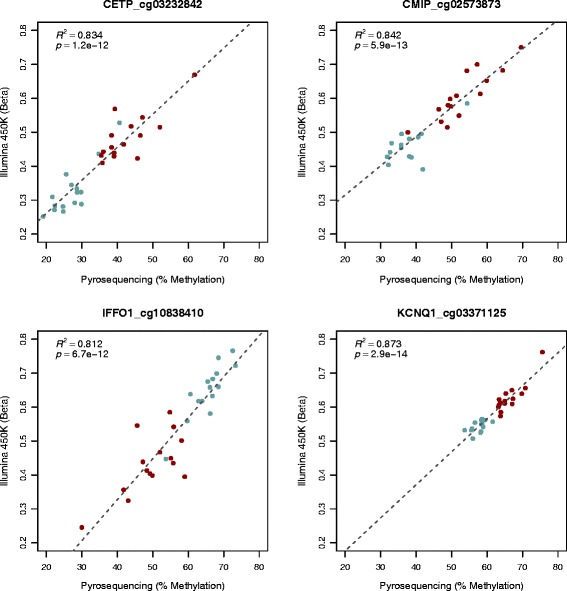
Results: Here, we investigate DNA methylation in adipose tissue from obese women before and after gastric bypass and significant weight loss. In total, 485,577 CpG sites were profiled in matched, before and after weight loss, subcutaneous and omental adipose tissue. A paired analysis revealed significant differential methylation in omental and subcutaneous adipose tissue. A greater proportion of CpGs are hypermethylated before weight loss and increased methylation is observed in the 3' untranslated region and gene bodies relative to promoter regions. Differential methylation is found within genes associated with obesity, epigenetic regulation and development, such as CETP, FOXP2, HDAC4, DNMT3B, KCNQ1 and HOX clusters. We identify robust correlations between changes in methylation and clinical trait, including associations between fasting glucose and HDAC4, SLC37A3 and DENND1C in subcutaneous adipose. Genes investigated with differential promoter methylation all show significantly different levels of mRNA before and after gastric bypass.
Conclusions: This is the first study reporting global DNA methylation profiling of adipose tissue before and after gastric bypass and associated weight loss. It provides a strong basis for future work and offers additional evidence for the role of DNA methylation of adipose tissue in obesity.
Figures

References
-
- Haslam DW, James WP. Obesity. Lancet. 2005;366:1197–209. - PubMed
-
- Poirier P, Giles TD, Bray GA, Hong Y, Stern JS, Pi-Sunyer FX, Eckel RH. Obesity and cardiovascular disease: pathophysiology, evaluation, and effect of weight loss: an update of the 1997 American Heart Association Scientific Statement on Obesity and Heart Disease from the Obesity Committee of the Council on Nutrition, Physical Activity, and Metabolism. Circulation. 2006;113:898–918. - PubMed
-
- Sturm R. The effects of obesity, smoking, and drinking on medical problems and costs. Health Aff (Millwood) 2002;21:245–53. - PubMed
-
- Scherer PE. Adipose tissue: from lipid storage compartment to endocrine organ. Diabetes. 2006;55:1537–45. - PubMed
Publication types
MeSH terms
Substances
Grants and funding
LinkOut - more resources
Full Text Sources
Other Literature Sources
Medical
