In vivo (1)H MRSI of glycine in brain tumors at 3T
- PMID: 25651788
- PMCID: PMC4524799
- DOI: 10.1002/mrm.25588
In vivo (1)H MRSI of glycine in brain tumors at 3T
Abstract
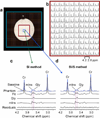
Purpose: MR spectroscopic imaging (SI) of glycine (Gly) in the human brain is challenging due to the interference of the abundant neighboring J-coupled resonances. Our aim is to accomplish reliable imaging of Gly in healthy brain and brain tumors using an optimized MR sequence scheme at 3 tesla.
Methods: Two-dimensional (1)H SI was performed with a point-resolved spectroscopy scheme. An echo time of 160 ms was used for separation between Gly and myo-inositol signals. Data were collected from eight healthy volunteers and 14 subjects with gliomas. Spectra were analyzed with the linear combination model using numerically calculated basis spectra. Metabolite concentrations were estimated with reference to creatine in white matter (WM) regions at 6.4 molar concentrations (mM).
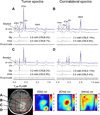
Results: From a linear regression analysis with respect to the fractional gray matter (GM) content, the Gly concentrations in pure GM and WM in healthy brains were estimated to be 1.1 and 0.3 mM, respectively. Gly was significantly elevated in tumors. The tumor-to-contralateral Gly concentration ratio was more extensive with higher grades, showing ∼ 10-fold elevation of Gly in glioblastomas.
Conclusion: The Gly level is significantly different between GM and WM in healthy brains. Our data indicate that SI of Gly may provide a biomarker of brain tumor malignancy.
Keywords: 1H MRSI; 3T; PRESS (point-resolved spectroscopy); glycine; human brain, gliomas.
© 2015 Wiley Periodicals, Inc.
Figures


Similar articles
-
Measurement of glycine in healthy and tumorous brain by triple-refocusing MRS at 3 T in vivo.NMR Biomed. 2017 Sep;30(9):10.1002/nbm.3747. doi: 10.1002/nbm.3747. Epub 2017 May 26. NMR Biomed. 2017. PMID: 28548710 Free PMC article.
-
Short-echo three-dimensional H-1 MR spectroscopic imaging of patients with glioma at 7 Tesla for characterization of differences in metabolite levels.J Magn Reson Imaging. 2015 May;41(5):1332-41. doi: 10.1002/jmri.24672. Epub 2014 Jun 17. J Magn Reson Imaging. 2015. PMID: 24935758 Free PMC article.
-
1H MR spectroscopic imaging with short and long echo time to discriminate glycine in glial tumours.MAGMA. 2009 Feb;22(1):33-41. doi: 10.1007/s10334-008-0145-z. Epub 2008 Oct 1. MAGMA. 2009. PMID: 18830648
-
Metabolite ratios in 1H MR spectroscopic imaging of the prostate.Magn Reson Med. 2015 Jan;73(1):1-12. doi: 10.1002/mrm.25122. Epub 2014 Jan 31. Magn Reson Med. 2015. PMID: 24488656 Review.
-
Clinical Imaging of Tumor Metabolism with ¹H Magnetic Resonance Spectroscopy.Magn Reson Imaging Clin N Am. 2016 Feb;24(1):57-86. doi: 10.1016/j.mric.2015.09.002. Magn Reson Imaging Clin N Am. 2016. PMID: 26613876 Review.
Cited by
-
Application of Single Voxel 1H Magnetic Resonance Spectroscopy in Hepatic Benign and Malignant Lesions.Med Sci Monit. 2016 Dec 19;22:5003-5010. doi: 10.12659/msm.902177. Med Sci Monit. 2016. PMID: 27992399 Free PMC article.
-
Plasma amino acids indicate glioblastoma with ATRX loss.Amino Acids. 2021 Jan;53(1):119-132. doi: 10.1007/s00726-020-02931-3. Epub 2021 Jan 4. Amino Acids. 2021. PMID: 33398522
-
Measurement of glycine in healthy and tumorous brain by triple-refocusing MRS at 3 T in vivo.NMR Biomed. 2017 Sep;30(9):10.1002/nbm.3747. doi: 10.1002/nbm.3747. Epub 2017 May 26. NMR Biomed. 2017. PMID: 28548710 Free PMC article.
-
Elevated glycine detected on in vivo magnetic resonance spectroscopy in a breast cancer patient: case report and literature review.BJR Case Rep. 2020 Feb 12;6(1):20190090. doi: 10.1259/bjrcr.20190090. eCollection 2020 Mar. BJR Case Rep. 2020. PMID: 32201616 Free PMC article.
-
Clinical applications of breast cancer metabolomics using high-resolution magic angle spinning proton magnetic resonance spectroscopy (HRMAS 1H MRS): systematic scoping review.Metabolomics. 2019 Nov 6;15(11):148. doi: 10.1007/s11306-019-1611-5. Metabolomics. 2019. PMID: 31696341
References
-
- Benarroch EE. Glycine and its synaptic interactions: Functional and clinical implications. Neurology. 2011;77:677–683. - PubMed
-
- Eulenburg V, Armsen W, Betz H, Gomeza J. Glycine transporters: essential regulators of neurotransmission. Trends Biochem Sci. 2005;30:325–333. - PubMed
-
- Kinoshita Y, Yokota A. Absolute concentrations of metabolites in human brain tumors using in vitro proton magnetic resonance spectroscopy. NMR Biomed. 1997;10:2–12. - PubMed
Publication types
MeSH terms
Substances
Grants and funding
LinkOut - more resources
Full Text Sources
Other Literature Sources
Medical

