Genome-wide screen identifies a novel p97/CDC-48-dependent pathway regulating ER-stress-induced gene transcription
- PMID: 25652260
- PMCID: PMC4364872
- DOI: 10.15252/embr.201439123
Genome-wide screen identifies a novel p97/CDC-48-dependent pathway regulating ER-stress-induced gene transcription
Abstract
The accumulation of misfolded proteins in the endoplasmic reticulum (ER) activates the Unfolded Protein Response (UPR(ER)) to restore ER homeostasis. The AAA(+) ATPase p97/CDC-48 plays key roles in ER stress by promoting both ER protein degradation and transcription of UPR(ER) genes. Although the mechanisms associated with protein degradation are now well established, the molecular events involved in the regulation of gene transcription by p97/CDC-48 remain unclear. Using a reporter-based genome-wide RNAi screen in combination with quantitative proteomic analysis in Caenorhabditis elegans, we have identified RUVB-2, a AAA(+) ATPase, as a novel repressor of a subset of UPR(ER) genes. We show that degradation of RUVB-2 by CDC-48 enhances expression of ER stress response genes through an XBP1-dependent mechanism. The functional interplay between CDC-48 and RUVB-2 in controlling transcription of select UPR(ER) genes appears conserved in human cells. Together, these results describe a novel role for p97/CDC-48, whereby its role in protein degradation is integrated with its role in regulating expression of ER stress response genes.
Keywords: AAA+ ATPase; UPR; proteostasis.
© 2015 The Authors.
Figures
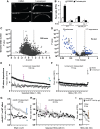
A cdc-48.2 is required to activate ckb-2p::gfp transcription in response to tunicamycin. Images of adult worms (left) expressing gfp under the control of the ckb-2 gene promoter in WT (upper panels) and in cdc-48.2(−/−) mutants (lower panels) exposed to tunicamycin (5 μg/ml) or DMSO for 16 h. (Scale bar: 50 μm, obj.: 10×).
B Significant changes in fluorescence intensities were quantified using flow cytometry. L1 larvae (ckb-2p::gfp and cdc-48.2(−/−); ckb-2::pgfp larvae) were fed with bacteria expressing the L4440 empty vector or ire-1RNAi in liquid culture and exposed to tunicamycin (0.5 μg/ml) or DMSO for 16 h. F0 was defined as the fluorescence intensity obtained in ckb-2p::gfp worms fed with the empty vector and treated with DMSO. (Mean ± s.e.m, N + 8, 200 worms/experiment). P-values were calculated using multiple t-test corrected using the Holm–Sidak method **P < 0.001; *P < 0.01.
C Genome-wide RNAi screen identifies suppressors and enhancers of cdc-48.2(−/−) in ckb-2p::gfp transcription. Volcano plots present results obtained using Caenorhabditis elegansORFeome library.
D Re-testing of RNAi clones from first round.
E, F Classification of ER stress dependence of the 177 suppressor RNAi clones able to restore ckb-2p::gfp transcription in cdc-48.2(−/−) mutant background. cdc-48.2(−/−); ckb-2p::gfp synchronized L1 larvae were fed with the dsRNA expressing bacteria in liquid culture, treated with tunicamycin (0.5 μg/ml) or DMSO for 16 h, and fluorescence intensities were measured by flow cytometry. (E) Tunicamycin-dependent RNAi clones were defined as those that significantly increased fluorescence ratio following tunicamycin treatment (Tunicamycin/DMSO F/F0 fold change > 1.5). (F) Tunicamycin-independent RNAi clones were defined as those increasing ckb-2p::gfp fluorescence ratio in both conditions (Tunicamycin/DMSO F/F0 fold change < 1.5, P > 0.05). Fluorescence ratios obtained with ruvb-2RNAi are shown in magenta. Fluorescence ratios obtained with ckb-2p::gfp worms fed with the empty vector and treated with tunicamycin (2.38 ± 0.18) or DMSO (1.05 ± 0.2) are shown in cyan.
G-I F0 was defined as the fluorescence intensity obtained in cdc-48.2(−/−); ckb-2p::gfp worms fed with the empty vector and treated with tunicamycin or DMSO, respectively. (Mean ± s.e.m, N + 5). Identification of ER-stress-dependent RNAi clones targeting genes involved in the same genetic pathway as cdc-48.2 to increase ckb-2p::gfp transcription. Fluorescence ratio were determined on cdc-48.2(−/−); ckb-2::gfp and ckb-2::gfp worms fed with the suppressor RNAi clones and treated with tunicamycin (0.5 μg/ml) for 16 h. Graphs present the RNAi clones whose effect on ckb-2p::gfp fluorescence was higher ((G), (ckb-2::gfp F/F0/cdc-48.2(−/−); ckb-2::gfp F/F0) fold change > 1.4-fold), similar ((H), (ckb-2::gfp F/F0/cdc-48.2(−/−); ckb-2::gfp F/F0) fold change < 1.4, P > 0.05) or lower ((I), (ckb-2::gfp F/F0/cdc-48.2(−/−); ckb-2::gfp F/F0) fold change < 0.75) in ckb-2p::gfp worms compared to cdc-48.2(−/−); ckb-2p::gfp worms. Fluorescence ratios obtained with ruvb-2RNAi and the two controls empty vector and cdc-48.1 control RNAis are shown in magenta, cyan and brown, respectively. (Mean ± s.e.m, N + 5).
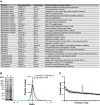
A List of RNAi clones suppressing the cdc-48.2(−/−) phenotype.
B Graph representing identified peptide number identified in function of peptide quantity ratio. cdc-48.2(−/−); ckb-2::gfp and ckb-2::gfp synchronized L1 larvae were grown to the L4 stage and exposed to tunicamycin (5 μg/ml) for 16 h on plates. Proteins (60 μg) were separated on a 10% SDS gel. A coomassie blue staining image representative of the SDS gel is shown on the left (1: cdc-48.2(−/−); ckb-2::gfp, 2: ckb-2::gfp). Gel lanes were cut into slices before proteins were in-gel-digested. Peptides were then identified and quantified by label-free LC-MS/MS mass spectrometry. Peptides that were more (magenta) or less (cyan) abundant in the cdc-48.2(−/−); ckb-2::gfp than in ckb-2::gfp worms were defined as those having a ratio above 1.5 or below 0.5, respectively. N + 3.
C Graph representing peptide quantity ratio ((cdc-48.2(−/−); ckb-2::gfp)/(ckb-2::gfp)) for the 93 proteins that are more abundant in cdc-48.2(−/−) mutant background compared to WT background. (Mean ± s.e.m, N + 3).
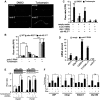
A Images of cdc-48.2(−/−); ckb-2::gfp adult worms fed with either the L4440 empty vector (upper panel) or ruvb-2RNAi (lower panel) and treated with tunicamycin (5 μg/ml) or DMSO for 16 h on NGM agar plates. (Scale bar: 50 μm, obj: 10×).
B Fluorescence was quantified by flow cytometry on ckb-2::gfp,cdc-48.1(−/−); ckb-2::gfp and cdc-48.2(−/−); ckb-2::gfp worms fed with ruvb-2RNAi or empty vector starting at the L1 stage in liquid culture and exposed to tunicamycin (0.5 μg/ml) or DMSO for 16 h. Fluorescence (F) was normalized to the basal fluorescence obtained with empty vector and DMSO in the WT background (F0). (Mean ± SD,N + 5) ***P < 0.001.
C Fluorescence (F) was quantified by flow cytometry on ckb-2::gfp and cdc-48.2(−/−); ckb-2::gfp worms fed with either ruvb-2 and empty vector (1:1), xbp-1 and empty vector (1:1), ruvb-2 and xbp-1RNAi (1:1), or empty vector alone and treated with tunicamycin (0.5 μg/ml) or DMSO for 16 h. Fluorescence (F) was normalized to the basal fluorescence obtained with the empty vector and DMSO in the WT background (F0). (Mean ± s.e.m, N + 3). P-values were calculated using multiple t-test corrected using the Holm-Sidak method. **P < 0.01; ***P < 0.001.
D RT–qPCR quantification of the relative expression levels of 3 endogenous ER homeostasis genes (ERp19, F22E5.6, Y71F9AL.17/COPA-1), Ckb-2 and Ruvb-2 following tunicamycin treatment in cdc-48.2(−/−) worms subjected or not to ruvb-2RNAi. Bars represent the mean of three biological replicates. (Mean ± s.e.m, N + 3) **P < 0.01; ***P < 0.001.
E Fluorescence was quantified in HuH7 cells expressing the ERSE::Tomato construct and either the Reptin shRNA induced with doxycycline (left) or the Pontin shRNA (transient, right). Cells were exposed to tunicamycin (5 μg/ml) for 4 h prior to measurement. Data are presented as mean ± SD of three independent experiments. Note that Reptin levels were decreased upon Tunicamycin treatment (see also Fig4A). **P < 0.01.
F RT–qPCR analysis of four ER homeostasis control genes under basal conditions or upon tunicamycin treatment (5 μg/ml, 16 h) in HuH7 cells subjected or not to doxycycline-induced Reptin silencing. Data are presented as mean ± SD of three independent biological triplicates. (Mean ± s.e.m, N + 3) P-value was calculated using multiple t-test corrected using the Holm-Sidak method. *P < 0.05; **P < 0.01.
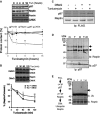
A Reptin, Pontin, calnexin and quantification by immunoblot. Values are expressed as a percentage of the initial protein abundance in total HuH7 cell lysate before addition of tunicamycin (5 μg/ml), (Mean ± SD,N + 5). *P < 0.05; **P < 0.01.
B Immunoblot analysis of Reptin in total protein extracts from HuH7 cells exposed to tunicamycin (5 μg/ml) for 0–2 h. Protein levels were normalized to Calnexin (mean ± SD,N + 3). *P < 0.05; **P < 0.01.
C HuH7 cells expressing FLAG tagged Reptin were treated either with the p97/CDC-48 inhibitor DBeQ (20 μM, D), the ER stress inducer tunicamycin (2 μg/ml; T) or both for 4 h. FLAG tagged Reptin was immunoprecipitated from total protein extracts using anti-FLAG antibodies, and p97/CDC-48 association was analyzed by immunoblot.
D HuH7 cells were treated either with DBeQ (20 μM, D), (2 μg/ml; T) or both for 4 h. P97/CDC-48 was immunoprecipitated from total protein extracts using an antibody specific for p97/CDC-48, and reptin association was analyzed by immunoblotting.
F HuH7 cells were treated either with DBeQ (20 μM, D), tunicamycin (2 μg/ml; T) or both for 4 h. P97/CDC-48 was immunoprecipitated from total protein extracts using anti-p97/CDC-48 antibodies. P97/CDC-48 immunoprecipitate was disrupted with 50 μl of 1% SDS and heated at 95°C for 5 min. Beads were removed and the supernatant quenched with PBS containing 1% TX-100. Reptin was then sequentially immunoprecipitated and the resulting immunoprecipitate immunoblotted with anti-Ubiquitin or anti-Reptin antibodies.
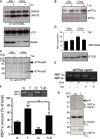
A GRP78 and GRP94 expression was detected using anti-KDEL antibodies (top blot) in HuH7 cells treated or not with tunicamycin and/or doxycycline (Dox) to induce reptin silencing (bottom blot). Expression of p97 was also monitored (middle blot).
B eIF2α phosphorylation was monitored using specific antibodies (top blot) and reported to the total expression (bottom blot) in HuH7 cells treated or not with tunicamycin and/or doxycycline (Dox).
C ATF6 activation was monitored in the same experimental conditions using antibodies against the N-terminal domain of ATF6.
D Expression of unspliced XBP1 mRNA as determined by RT–PCR and expression of the XBP1s ligase RTCB as determined by immunoblot using anti-RTCB antibodies in HuH7 cells treated or not with tunicamycin and/or doxycycline (Dox).
E XBP-1 mRNA splicing as determined by RT–PCR under basal conditions or upon tunicamycin treatment (5 μg/ml for 16 h) in HuH7 cells subjected or not to doxycycline-induced Reptin silencing. Three independent experiments were performed, and a representative image is shown.
F HuH7 cells were treated either with DBeQ (20 μM, D), tunicamycin (2 μg/ml; T) or both for 4 h. XBP-1 mRNA splicing was determined by RT–PCR (Mean ± SD,N + 3). P-values were calculated using multiple t-test corrected using the Holm-Sidak method. *P < 0.05; **P < 0.01.
G HuH7 cells were treated with tunicamycin (2 μg/ml; T) for 1 h. XBP1s was immunoprecipitated, and the complex was immunoblotted with anti-Reptin antibodies (top blot). Total cell lysate (TCL) was immunoblotted with anti-Reptin (middle blot) or anti-XBP1s (bottom blot).
Similar articles
-
GTPase-mediated regulation of the unfolded protein response in Caenorhabditis elegans is dependent on the AAA+ ATPase CDC-48.Mol Cell Biol. 2008 Jul;28(13):4261-74. doi: 10.1128/MCB.02252-07. Epub 2008 May 5. Mol Cell Biol. 2008. PMID: 18458060 Free PMC article.
-
A conserved role of Caenorhabditis elegans CDC-48 in ER-associated protein degradation.J Struct Biol. 2006 Oct;156(1):41-9. doi: 10.1016/j.jsb.2006.02.015. Epub 2006 Apr 7. J Struct Biol. 2006. PMID: 16647269
-
Caenorhabditis elegans p97 controls germline-specific sex determination by controlling the TRA-1 level in a CUL-2-dependent manner.J Cell Sci. 2009 Oct 15;122(Pt 20):3663-72. doi: 10.1242/jcs.052415. Epub 2009 Sep 22. J Cell Sci. 2009. PMID: 19773360
-
When is the unfolded protein response not the unfolded protein response?Plant Sci. 2017 Jul;260:139-143. doi: 10.1016/j.plantsci.2017.03.014. Epub 2017 Apr 5. Plant Sci. 2017. PMID: 28554471 Review.
-
Regulating Secretory Proteostasis through the Unfolded Protein Response: From Function to Therapy.Trends Cell Biol. 2017 Oct;27(10):722-737. doi: 10.1016/j.tcb.2017.05.006. Epub 2017 Jun 21. Trends Cell Biol. 2017. PMID: 28647092 Free PMC article. Review.
Cited by
-
De novo peptide sequencing by deep learning.Proc Natl Acad Sci U S A. 2017 Aug 1;114(31):8247-8252. doi: 10.1073/pnas.1705691114. Epub 2017 Jul 18. Proc Natl Acad Sci U S A. 2017. PMID: 28720701 Free PMC article.
-
Quantitative proteomics analysis of zebrafish exposed to sub-lethal dosages of β-methyl-amino-L-alanine (BMAA).Sci Rep. 2016 Jul 12;6:29631. doi: 10.1038/srep29631. Sci Rep. 2016. PMID: 27404450 Free PMC article.
-
Drug Resistance and Endoplasmic Reticulum Stress in Hepatocellular Carcinoma.Cells. 2022 Feb 11;11(4):632. doi: 10.3390/cells11040632. Cells. 2022. PMID: 35203283 Free PMC article. Review.
-
A quantitative genome-wide RNAi screen in C. elegans for antifungal innate immunity genes.BMC Biol. 2016 Apr 29;14:35. doi: 10.1186/s12915-016-0256-3. BMC Biol. 2016. PMID: 27129311 Free PMC article.
-
Beyond Proteostasis: Lipid Metabolism as a New Player in ER Homeostasis.Metabolites. 2021 Jan 14;11(1):52. doi: 10.3390/metabo11010052. Metabolites. 2021. PMID: 33466824 Free PMC article. Review.
References
-
- Ellgaard L, Helenius A. Quality control in the endoplasmic reticulum. Nat Rev Mol Cell Biol. 2003;4:181–191. - PubMed
-
- Hetz C, Chevet E, Harding HP. Targeting the unfolded protein response in disease. Nat Rev Drug Discov. 2013;12:703–719. - PubMed
-
- Mouysset J, Kähler C, Hoppe T. A conserved role of Caenorhabditis elegans CDC-48 in ER-associated protein degradation. J Struct Biol. 2006;156:41–49. - PubMed
-
- Dantuma NP, Hoppe T. Growing sphere of influence: Cdc48/p97 orchestrates ubiquitin-dependent extraction from chromatin. Trends Cell Biol. 2012;22:483–491. - PubMed
Publication types
MeSH terms
Substances
LinkOut - more resources
Full Text Sources
Other Literature Sources
Molecular Biology Databases
Research Materials

