

Meta-analysis of test accuracy studies: an exploratory method for investigating the impact of missing thresholds
- PMID: 25652323
- PMCID: PMC4417327
- DOI: 10.1186/2046-4053-4-12
Meta-analysis of test accuracy studies: an exploratory method for investigating the impact of missing thresholds
Abstract
Background: Primary studies examining the accuracy of a continuous test evaluate its sensitivity and specificity at one or more thresholds. Meta-analysts then usually perform a separate meta-analysis for each threshold. However, the number of studies available for each threshold is often very different, as primary studies are inconsistent in the thresholds reported. Furthermore, of concern is selective reporting bias, because primary studies may be less likely to report a threshold when it gives low sensitivity and/or specificity estimates. This may lead to biased meta-analysis results. We developed an exploratory method to examine the potential impact of missing thresholds on conclusions from a test accuracy meta-analysis.
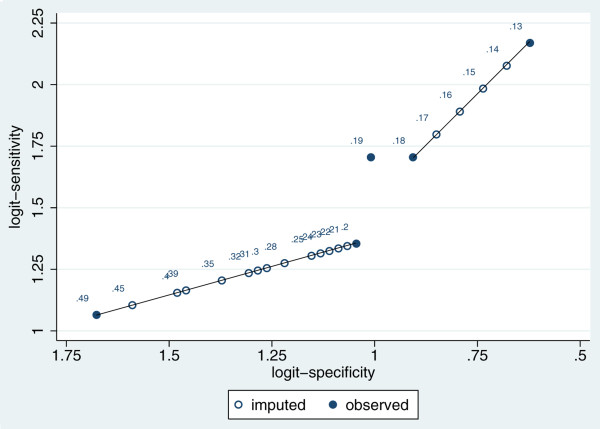
Methods: Our method identifies studies that contain missing thresholds bounded between a pair of higher and lower thresholds for which results are available. The bounded missing threshold results (two-by-two tables) are then imputed, by assuming a linear relationship between threshold value and each of logit-sensitivity and logit-specificity. The imputed results are then added to the meta-analysis, to ascertain if original conclusions are robust. The method is evaluated through simulation, and application made to 13 studies evaluating protein:creatinine ratio (PCR) for detecting proteinuria in pregnancy with 23 different thresholds, ranging from one to seven per study.
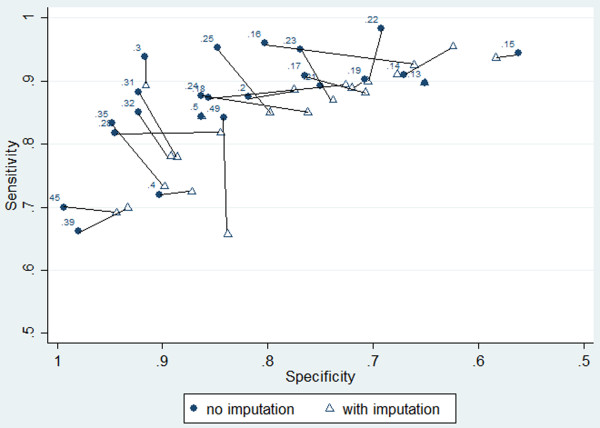
Results: The simulation shows the imputation method leads to meta-analysis estimates with smaller mean-square error. In the PCR application, it provides 50 additional results for meta-analysis and their inclusion produces lower test accuracy results than originally identified. For example, at a PCR threshold of 0.16, the summary specificity is 0.80 when using the original data, but 0.66 when also including the imputed data. At a PCR threshold of 0.25, the summary sensitivity is reduced from 0.95 to 0.85 when additionally including the imputed data.
Conclusions: The imputation method is a practical tool for researchers (often non-statisticians) to explore the potential impact of missing threshold results on their meta-analysis conclusions. Software is available to implement the method. In the PCR example, it revealed threshold results are vulnerable to the missing data, and so stimulates the need for advanced statistical models or, preferably, individual patient data from primary studies.
Keywords: Diagnostic test; Imputation; Meta-analysis; Missing data; Multiple thresholds; Sensitivity analysis.
Figures
Similar articles
-
Folic acid supplementation and malaria susceptibility and severity among people taking antifolate antimalarial drugs in endemic areas.Cochrane Database Syst Rev. 2022 Feb 1;2(2022):CD014217. doi: 10.1002/14651858.CD014217. Cochrane Database Syst Rev. 2022. PMID: 36321557 Free PMC article.
-
Meta-analysis of test accuracy studies using imputation for partial reporting of multiple thresholds.Res Synth Methods. 2018 Mar;9(1):100-115. doi: 10.1002/jrsm.1276. Epub 2017 Nov 22. Res Synth Methods. 2018. PMID: 29052347 Free PMC article.
-
Meta-analytic methods for diagnostic test accuracy.J Clin Epidemiol. 1995 Jan;48(1):119-30; discussion 131-2. doi: 10.1016/0895-4356(94)00099-c. J Clin Epidemiol. 1995. PMID: 7853038 Review.
-
Dermoscopy, with and without visual inspection, for diagnosing melanoma in adults.Cochrane Database Syst Rev. 2018 Dec 4;12(12):CD011902. doi: 10.1002/14651858.CD011902.pub2. Cochrane Database Syst Rev. 2018. PMID: 30521682 Free PMC article.
-
Screening for Cognitive Impairment in Older Adults: An Evidence Update for the U.S. Preventive Services Task Force [Internet].Rockville (MD): Agency for Healthcare Research and Quality (US); 2020 Feb. Report No.: 19-05257-EF-1. Rockville (MD): Agency for Healthcare Research and Quality (US); 2020 Feb. Report No.: 19-05257-EF-1. PMID: 32129963 Free Books & Documents. Review.
Cited by
-
Interleukin Dynamics and Their Correlation with Tumor Aggressiveness in Colorectal Carcinoma.Int J Mol Sci. 2025 Jul 21;26(14):7027. doi: 10.3390/ijms26147027. Int J Mol Sci. 2025. PMID: 40725273 Free PMC article.
-
The clinical utility of circulating tumour cells in patients with small cell lung cancer.Transl Lung Cancer Res. 2017 Aug;6(4):409-417. doi: 10.21037/tlcr.2017.07.05. Transl Lung Cancer Res. 2017. PMID: 28904885 Free PMC article. Review.
-
Biochemical tests of placental function versus ultrasound assessment of fetal size for stillbirth and small-for-gestational-age infants.Cochrane Database Syst Rev. 2019 May 14;5(5):CD012245. doi: 10.1002/14651858.CD012245.pub2. Cochrane Database Syst Rev. 2019. PMID: 31087568 Free PMC article.
-
Quantifying how diagnostic test accuracy depends on threshold in a meta-analysis.Stat Med. 2019 Oct 30;38(24):4789-4803. doi: 10.1002/sim.8301. Epub 2019 Sep 30. Stat Med. 2019. PMID: 31571244 Free PMC article.
-
Meta-analysis of diagnostic accuracy studies in mental health.Evid Based Ment Health. 2015 Nov;18(4):103-9. doi: 10.1136/eb-2015-102228. Epub 2015 Oct 7. Evid Based Ment Health. 2015. PMID: 26446042 Free PMC article.
References
-
- Morris RK, Riley RD, Doug M, Deeks JJ, Kilby MD. Diagnostic accuracy of spot urinary protein and albumin to creatinine ratios for detection of significant proteinuria or adverse pregnancy outcome in patients with suspected pre-eclampsia: systematic review and meta-analysis. BMJ. 2012;345:e4342. doi: 10.1136/bmj.e4342. - DOI - PMC - PubMed
Publication types
MeSH terms
Grants and funding
LinkOut - more resources
Full Text Sources
Other Literature Sources
Medical
