. 2015 Feb 5:6:6198.
doi: 10.1038/ncomms7198.

The assembly dynamics of the cytolytic pore toxin ClyA

Affiliations

The assembly dynamics of the cytolytic pore toxin ClyA

Stephan Benke et al. Nat Commun. .

Erratum in

Abstract

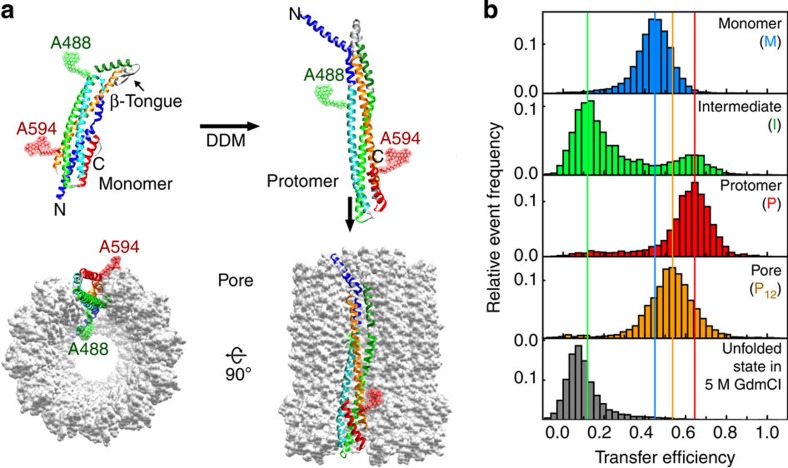
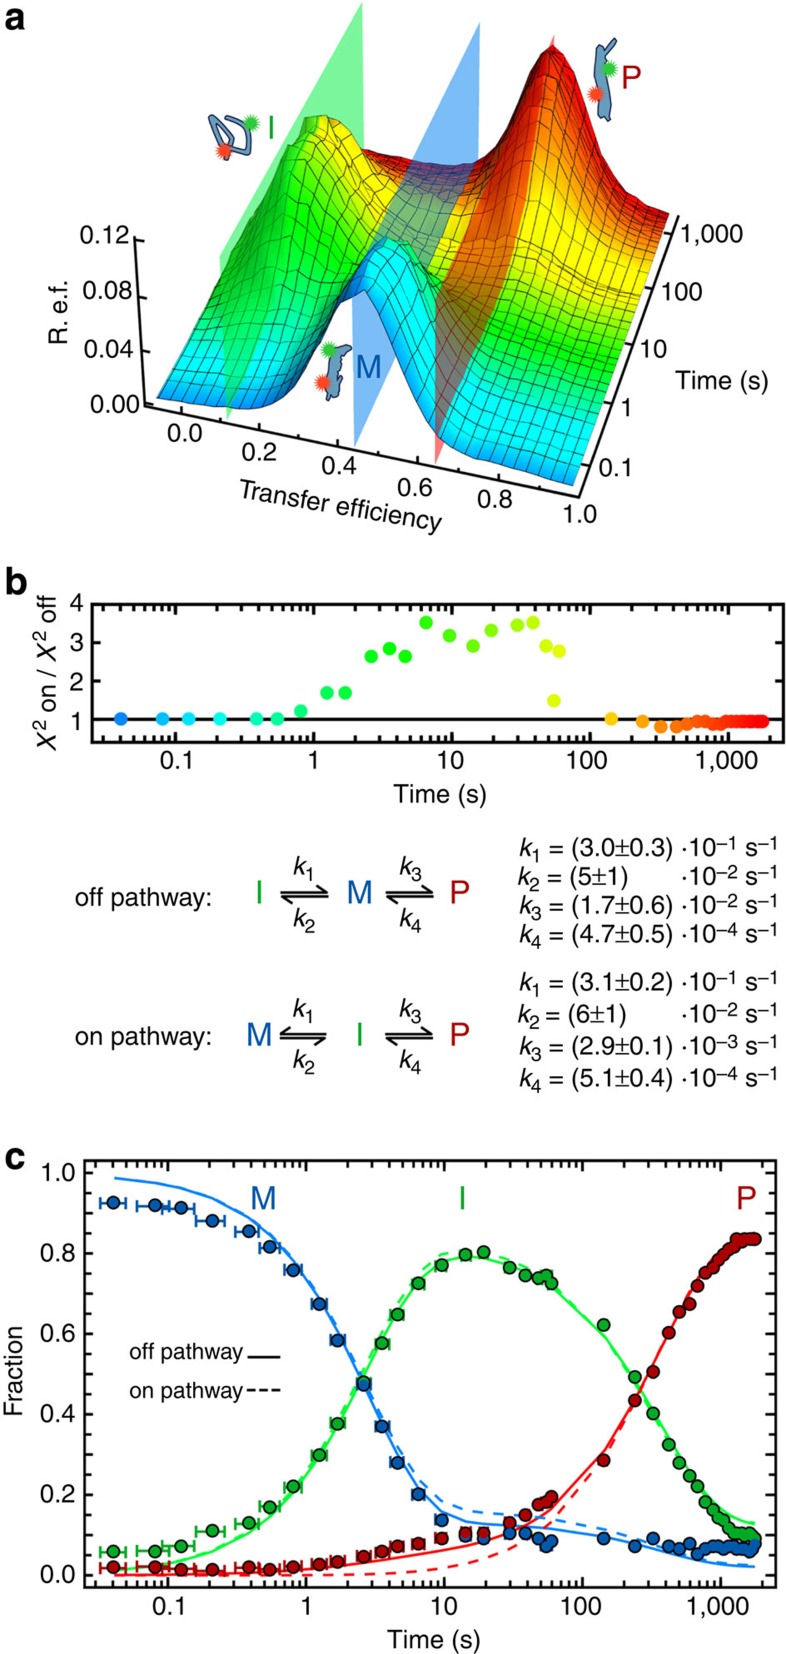
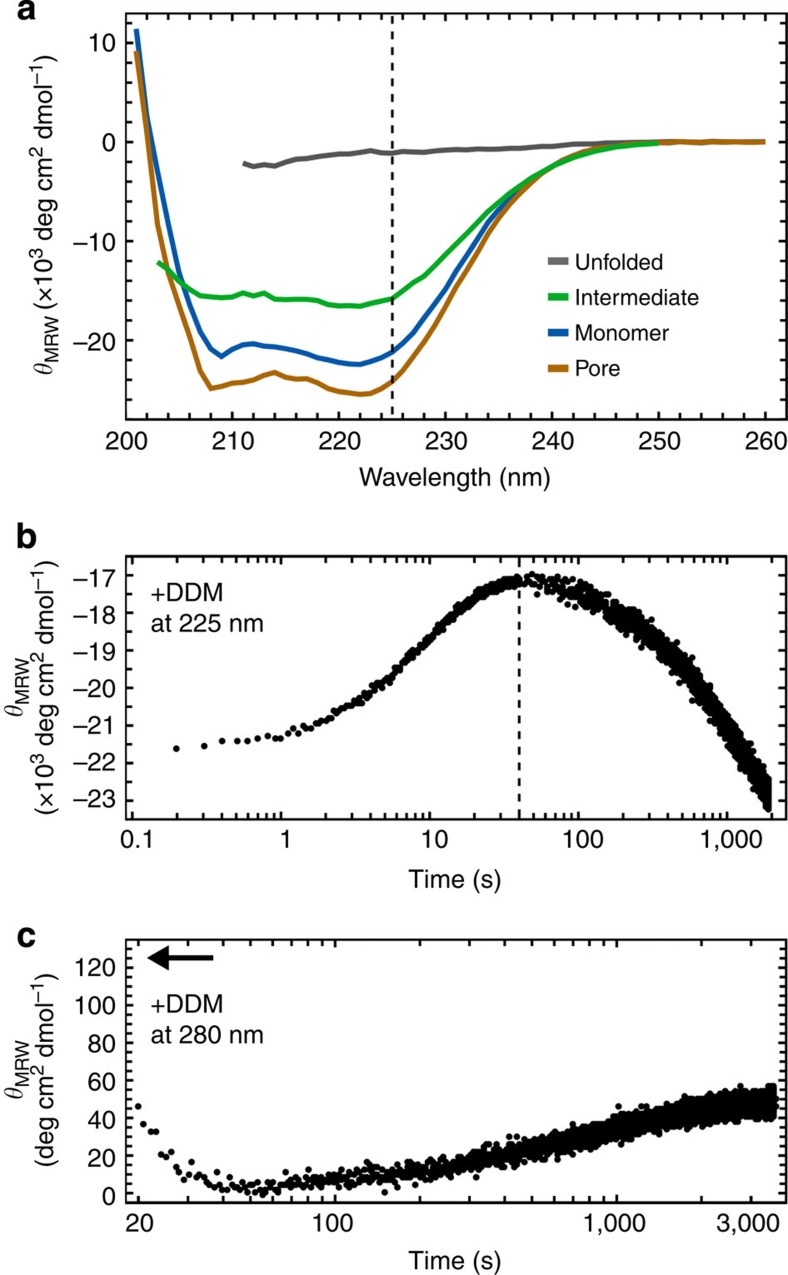
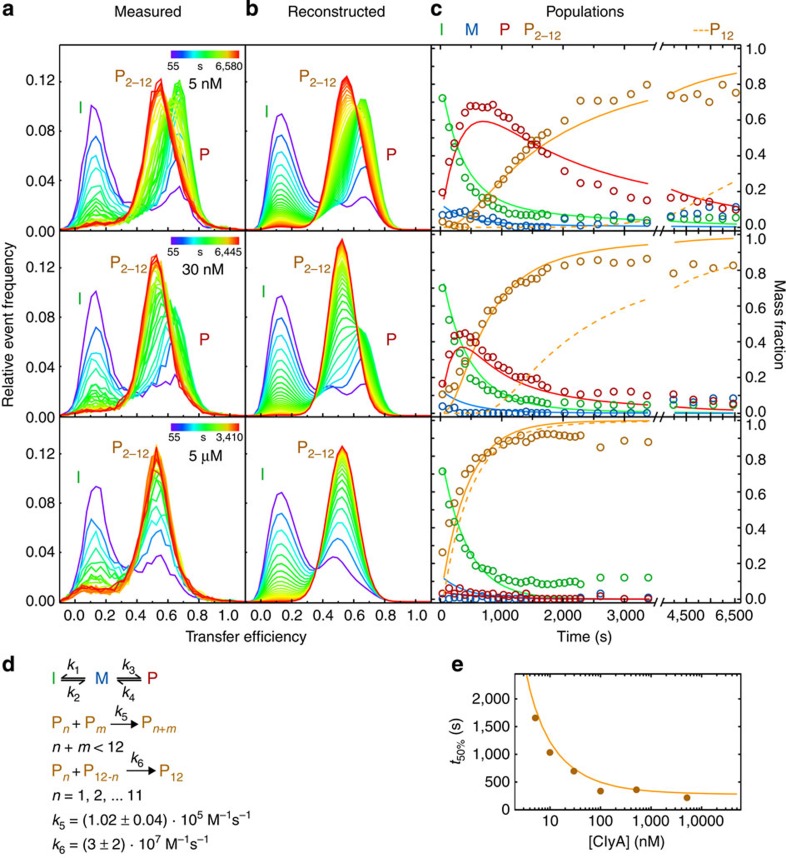
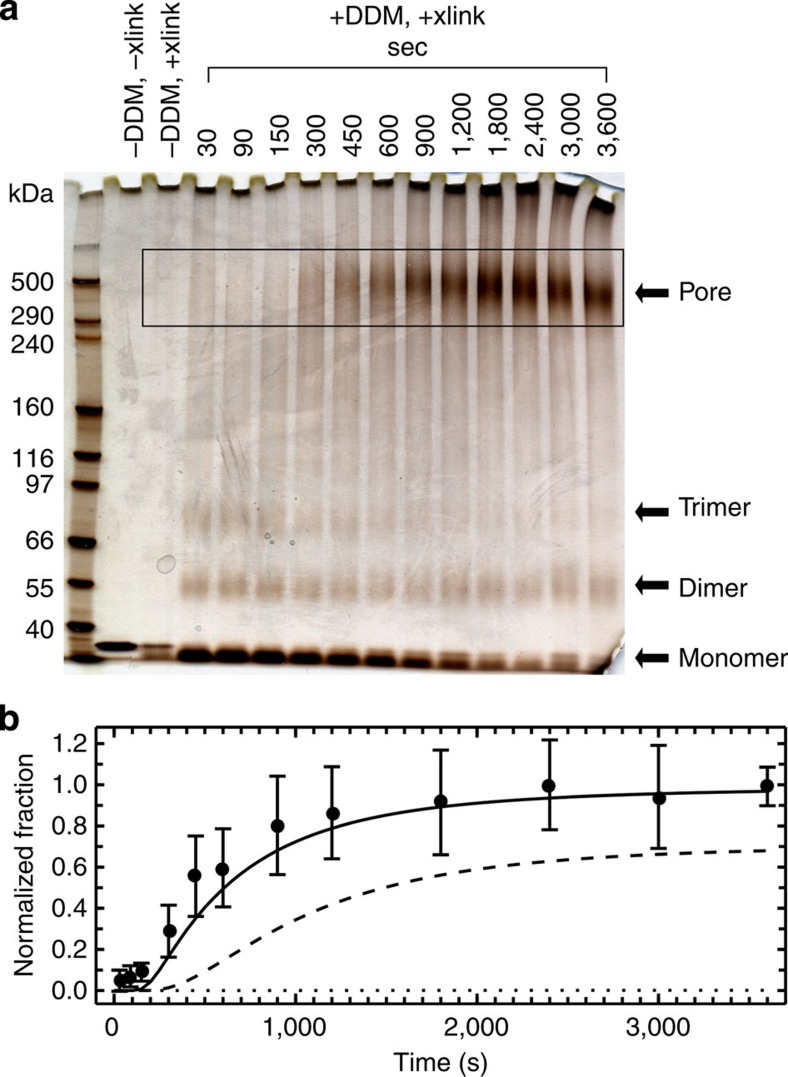
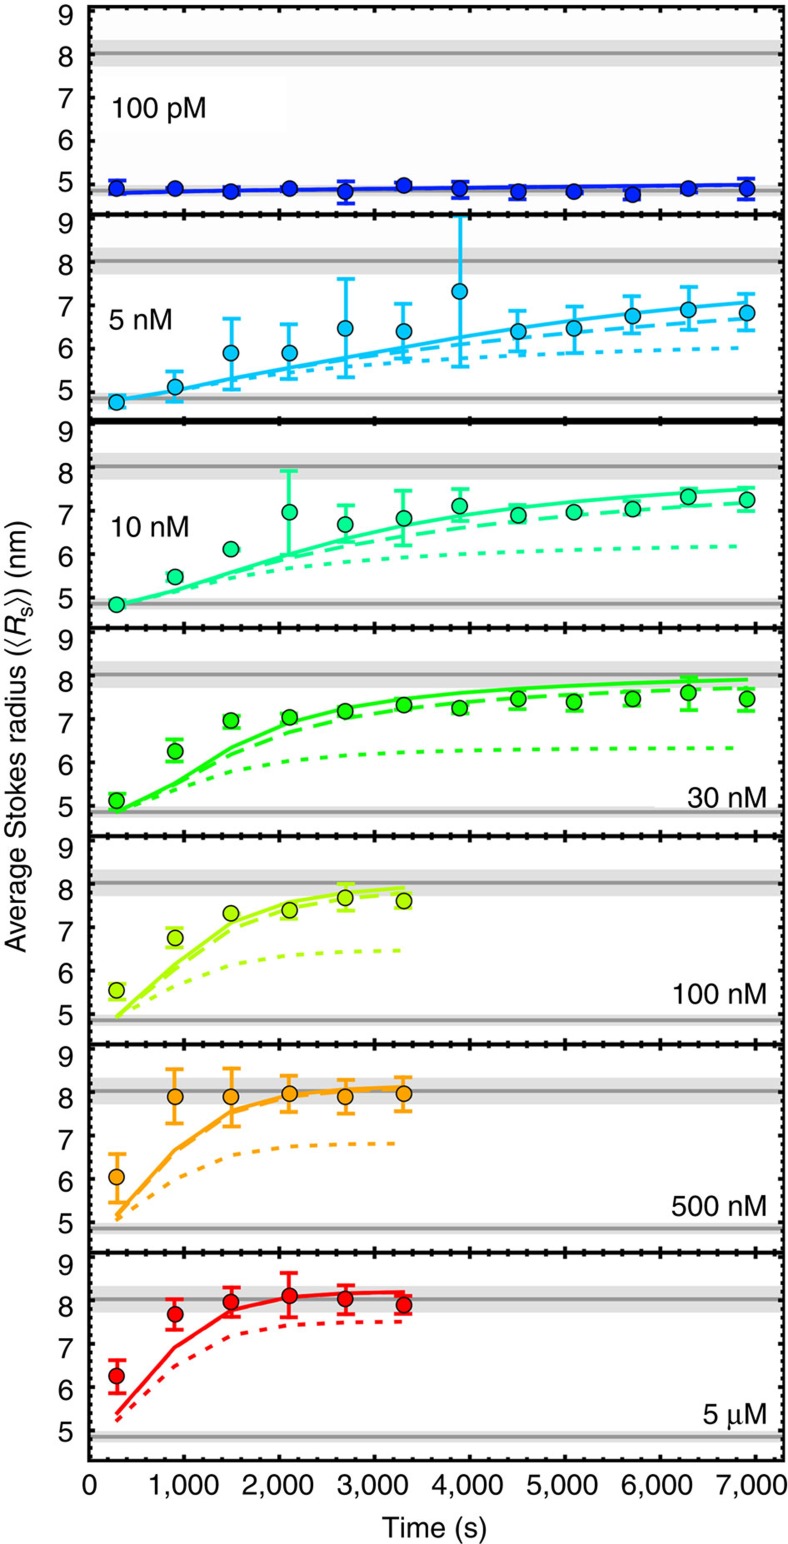
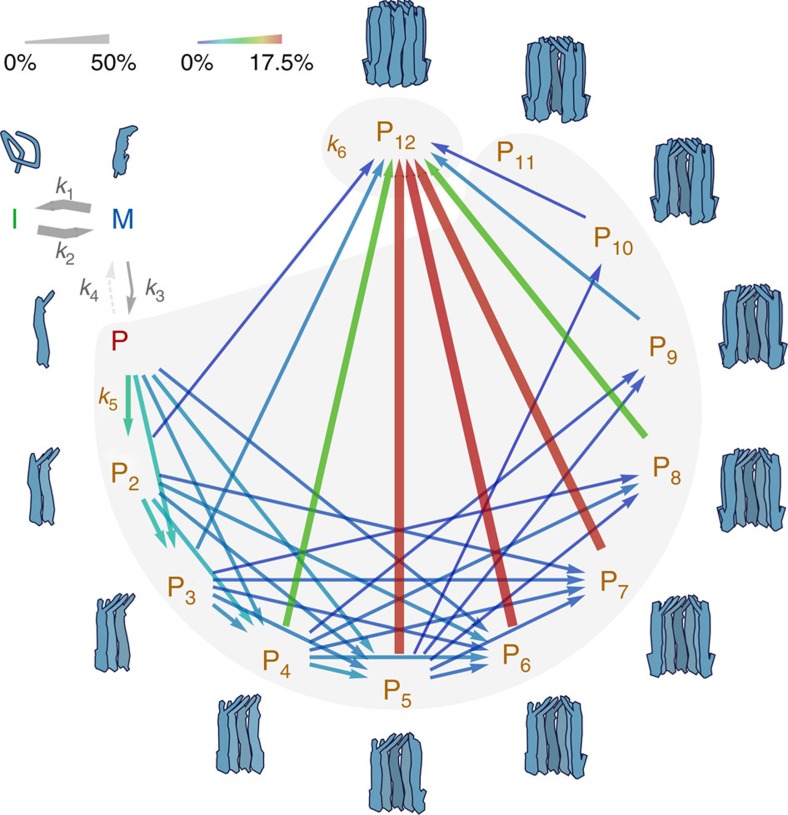
Pore-forming toxins are protein assemblies used by many organisms to disrupt the membranes of target cells. They are expressed as soluble monomers that assemble spontaneously into multimeric pores. However, owing to their complexity, the assembly processes have not been resolved in detail for any pore-forming toxin. To determine the assembly mechanism for the ring-shaped, homododecameric pore of the bacterial cytolytic toxin ClyA, we collected a diverse set of kinetic data using single-molecule spectroscopy and complementary techniques on timescales from milliseconds to hours, and from picomolar to micromolar ClyA concentrations. The entire range of experimental results can be explained quantitatively by a surprisingly simple mechanism. First, addition of the detergent n-dodecyl-β-D-maltopyranoside to the soluble monomers triggers the formation of assembly-competent toxin subunits, accompanied by the transient formation of a molten-globule-like intermediate. Then, all sterically compatible oligomers contribute to assembly, which greatly enhances the efficiency of pore formation compared with simple monomer addition.


Figures

Figure 1
Figure 1. The different conformational states of labelled ClyA on mixing with DDM as observed by single-molecule FRET.
(a) Crystal structures of the monomer and the ClyA protomer in the context of the pore complex (PDB code 1QOY and PDB code 2WCD17). The protomer conformation is represented by one pore subunit. N and C indicate the N- and carboxy termini of the protein, and A488 and A594 the positions labelled with Alexa Fluor 488 (position 56) and 594 (position 252), respectively. Structure representations were created with Chimera and Avogadro, colour scheme according to Mueller et al. (b) Transfer efficiency histograms of the different ClyA species that can be distinguished by single-molecule FRET. The histograms (each containing ≳ 5,000 events) were normalized to an area of 1. The coloured vertical lines indicate the peak positions of the species in the transfer efficiency histograms. The histogram of the monomer (M) was recorded in the absence of DDM. The histograms of intermediate (I) and protomer (P) are from the kinetic measurements in the presence of DDM at a ClyA concentration of ~100 pM at 55 and 1,765 s, respectively, after mixing with DDM. For the histogram of the pore (P12), 5 μM ClyA with 1% labelled ClyA were incubated with DDM for 2 h and the formed pores were purified by size-exclusion chromatography according to Eifler et al. The resulting transfer efficiency is identical within uncertainty to what we observe in single-molecule kinetic measurements at times where oligomer formation is complete (Fig. 4a and Supplementary Fig. 8a). The difference between the transfer efficiencies of the oligomer state and the protomer can largely be assigned to acceptor dye quenching in the complex, rather than a difference in conformation (see Supplementary Table 1).
Figure 2
Figure 2. Kinetics of ClyA protomer formation.
(a) Time series of transfer efficiency histograms measured for the monomer to protomer transition in 0.1% (w/v) DDM, combined from microfluidic and manual mixing experiments at short (<100 s) and long times (>40 s), respectively. Each histogram was normalized to an area of 1. The cartoons illustrate the monomer (M), intermediate (I) and protomer (P), and the coloured planes indicate the average transfer efficiencies of the peaks. R.e.f., relative event frequency. (b) Kinetic modelling of protomer formation. The histogram data were fit globally either with an off- or an on-pathway kinetic model (see Methods for details on the fitting procedure). Top: the χ2 ratio of the two fits for each histogram is shown (colour coded as in a), illustrating the better fit of the off-pathway model. Reconstructed histograms based on both the off-pathway and the on-pathway fit are shown in Supplementary Fig. 3. Bottom: schematic representation of the two models and the rate coefficients resulting from the fits to the data in a. For details on the uncertainties given, see Methods. (c) Population time courses of the different species according to three different fits of the histogram time series in a. Filled circles: histograms fit individually with free peak amplitudes. The error bars show the uncertainty in time in the microfluidic measurements due to Taylor dispersion (see Methods for details). Solid and dashed lines: populations from the fits according to the off- and the on-pathway models (see b), respectively. For details on error analysis of the global fits, see Supplementary Figs 2, 3 and 4.
Figure 3
Figure 3. CD spectra of the different ClyA conformations and kinetic measurements.
(a) Far-ultraviolet CD spectra of the conformational states of ClyAwt accessible with ensemble methods (that is, excluding the protomer). The spectrum of the intermediate is calculated from a reconstructed spectrum obtained by stopped-flow measurements 40 s after mixing with DDM and spectra of monomer and pore using the relative concentrations of the species at the point of maximum intermediate population determined by single-molecule FRET (Fig. 2c). The dashed line indicates the wavelength of the kinetic measurement in b. (b) Kinetic far-ultraviolet CD measurement at 225 nm of ClyAwt pore formation at 9 μM ClyA on mixing with DDM, combined from stopped-flow and manual mixing experiments. The manual mixing data were adjusted by +3 × 10³ deg  cm2 dmol−1 to match the level of the stopped-flow data. The dashed line indicates the time at which the spectrum of the intermediate was reconstructed in a. (c) Kinetic near-ultraviolet CD measurement at 280 nm of ClyAwt pore formation at 2.8 μM by manual mixing. The arrow indicates the level of the monomer signal to illustrate the signal drop during the dead time of the measurement.
Figure 4
Figure 4. Kinetics of ClyA pore formation at different total ClyA concentrations followed by single-molecule FRET.
(a) Measured transfer efficiency histogram time series after manual mixing. Each coloured line represents one histogram (area normalized to 1) at a certain time after starting the reaction (colour code shown in the upper right of each panel). Most of the monomer depopulates during the dead time of the experiment, and thus no pronounced monomer peak is observed. (b) Reconstructed histograms according to the pore formation model shown in d. (c) Population time courses of the different species according to two different types of analysis of the histogram time series. Circles: populations from individual fits of the histograms with peak amplitudes as free parameters, and peak positions and widths as shared (global) fit parameters. Solid lines: populations from a global fit of all 217 histograms from all ClyA concentrations according to the non-sequential assembly model with two rate coefficients (see d). As the different oligomers cannot be discriminated in the histograms, the population P2–12 represents the total population of all protomers in oligomers. The dashed line shows the population of complete pores as predicted by the model (see Supplementary Fig. 9c for the other oligomers). See Methods section for details on the fitting procedure. Data for ClyA at 0.1, 10, 100 and 500 nM were also included in the global fit (Supplementary Fig. 8). I, intermediate; P2–12, oligomeric species; P, protomer; M, monomer. (d) Schematic of the non-sequential assembly model of pore formation. Protomer formation occurs according to an off-pathway model (Fig. 2); oligomerization of protomers and assembly with other oligomers all occur with the same rate coefficient (k5) if they lead to incomplete pores; formation of complete pores occurs with a different rate coefficient (k6). See Methods for details on error calculation. (e) Dependence of pore formation kinetics on ClyA concentration. Plotted is t50% (time when 50% of the ClyA molecules are in an oligomeric state), versus the total concentration of ClyA subunits, according to the populations from the free fit (filled circles) and as predicted by the pore assembly model (d; solid line).
Figure 5
Figure 5. Kinetics of ClyA pore assembly at 500 nM ClyAwt followed by photo-induced cross-linking.
(a) Samples were cross-linked by photo-induced cross-linking of unmodified proteins (PICUP) (see Methods) after incubation with DDM for different times and analysed by SDS–PAGE. The image shows the silver-stained polyacrylamide gel. Lane 1: molecular weight marker (molecular masses indicated on the left), lane 2: monomeric ClyA (no addition of DDM or crosslinker), lane 3: cross-linked monomeric ClyA in the absence of DDM (only cross-linker added), lane 4 to 15: cross-linked ClyA samples after incubation with DDM for the time intervals indicated on top of the respective lane. The rectangle indicates the region used for the analysis in b. The monomer band becomes a double band after cross-linking, which we attribute to internal cross-linking that leads to a more compact unfolded state. Owing to incomplete cross-linking, residual populations of small oligomers are still detected after denaturation in SDS. (b) Time course of pore formation based on the fluorescence of Coomassie-stained gel bands (see Methods). The means and s.d. of the band intensities of three experiments (filled circles and error bars) were normalized to the mean of the cross-linking control as the minimum and the mean of the highest intensity as the maximum. Note that the fraction of pores (see b) is normalized to the pore band intensity at 3,600 s, where pore formation is complete under these conditions (Fig. 6). The lines represent the time courses of the formation of complete pores predicted by three different models: the non-sequential addition model with two rate coefficients (solid line), the non-sequential addition model with a single rate coefficient (dashed line) and the linear addition model with a single rate coefficient (dotted line), using the kinetic parameters obtained from the single-molecule FRET data (Figs 2 and 4).
Figure 6
Figure 6. Changes in hydrodynamic radius during pore formation.
The average Stokes radius, ‹RS›, as a function of time during pore formation reactions at different ClyA concentrations was determined by 2f-FCS (see Methods). Filled circles and error bars represent mean and s.d. of three measurements. The lines in each graph represent the time courses of ‹RS› predicted by three different models: the non-sequential assembly model with two rate coefficients (solid lines, see Fig. 4), the non-sequential assembly model with a single rate coefficient (dashed lines) and the linear protomer addition model with a single rate coefficient (dotted lines) (see Results and Methods for details), using the kinetic parameters obtained from the fit to the single-molecule FRET data (Figs 2 and 4). The grey lines and shaded bands represent the means and s.d. of the Stokes radii for the protomer (0.1 nM ClyA, RS=4.9±0.1 nm) and the pore complex (5 μM ClyA, RS=8.0±0.3 nm) from three independent measurements each.
Figure 7
Figure 7. Pathways of ClyA pore formation.
Shown is the mass flux (arrows) through the states of the non-sequential assembly model with two rate coefficients (Fig. 4d) for a ClyA concentration of 5 μM according to the fit shown in Fig. 4 and Supplementary Fig. 8. Each arrow represents either a conformational change (grey arrows between I, M and P) or an oligomerization step (P to P12). For example, the arrow between P5 and P12 represents the association of pentamers (P5) and heptamers (P7) to form complete pores (P12). Widths and colours of the arrows correspond to the normalized flux from one state to another according to the scales shown at the top left. As the pre-equilibrium between monomer and intermediate accounts for the majority of the total flux, the flux was normalized independently for the pre-equilibrium (including M, I and P) and for the pore assembly process (including P to P12). For clarity, only paths contributing more than 1% to the total flux are shown (except for the P to M transition). The relative fluxes in this model are remarkably insensitive to the ClyA concentration. Between the lowest (5 nM) and the highest (5 μM) ClyA concentration, the maximum difference in flux for a single path in pore assembly is 2% of the total flux. I, intermediate; M, monomer; P, protomer; Pi, oligomeric species.

References

    1. Iacovache I., van der Goot F. G. & Pernot L. Pore formation: an ancient yet complex form of attack. Biochim. Biophys. Acta 1778, 1611–1623 (2008). - PubMed
    1. Los F. C. O., Randis T. M., Aroian R. V. & Ratner A. J. Role of pore-forming toxins in bacterial infectious diseases. Microbiol. Mol. Biol. Rev. 77, 173–207 (2013). - PMC - PubMed
    1. Iacovache I., Degiacomi M. T. & van der Goot F. G. inComprehensive Biophysics ed. Egelman E. Elsevier Science (2012).
    1. Song L., Hobaugh M. R., Shustak C., Cheley S., Bayley H. & Gouaux J. E. Structure of staphylococcal alpha-hemolysin, a heptameric transmembrane pore. Science 274, 1859–1866 (1996). - PubMed
    1. Tschopp J. Ultrastructure of the membrane attack complex of complement. Heterogeneity of the complex caused by different degree of C9 polymerization. J. Biol. Chem. 259, 7857–7863 (1984). - PubMed

Publication types

MeSH terms

LinkOut - more resources