

Quantitative variability of 342 plasma proteins in a human twin population
- PMID: 25652787
- PMCID: PMC4358658
- DOI: 10.15252/msb.20145728
Quantitative variability of 342 plasma proteins in a human twin population
Abstract
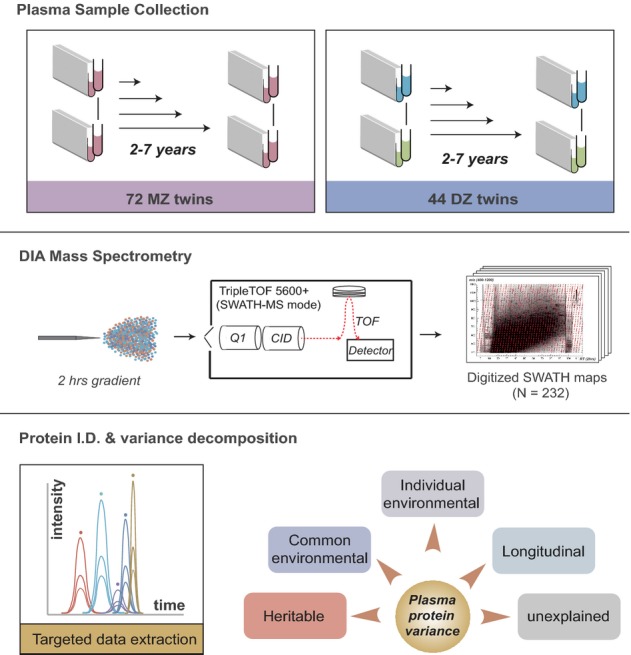
The degree and the origins of quantitative variability of most human plasma proteins are largely unknown. Because the twin study design provides a natural opportunity to estimate the relative contribution of heritability and environment to different traits in human population, we applied here the highly accurate and reproducible SWATH mass spectrometry technique to quantify 1,904 peptides defining 342 unique plasma proteins in 232 plasma samples collected longitudinally from pairs of monozygotic and dizygotic twins at intervals of 2-7 years, and proportioned the observed total quantitative variability to its root causes, genes, and environmental and longitudinal factors. The data indicate that different proteins show vastly different patterns of abundance variability among humans and that genetic control and longitudinal variation affect protein levels and biological processes to different degrees. The data further strongly suggest that the plasma concentrations of clinical biomarkers need to be calibrated against genetic and temporal factors. Moreover, we identified 13 cis-SNPs significantly influencing the level of specific plasma proteins. These results therefore have immediate implications for the effective design of blood-based biomarker studies.
Keywords: SWATH‐MS; heritability; longitudinal variability; plasma biomarkers; twin study.
© 2015 The Authors. Published under the terms of the CC BY 4.0 license.
Figures
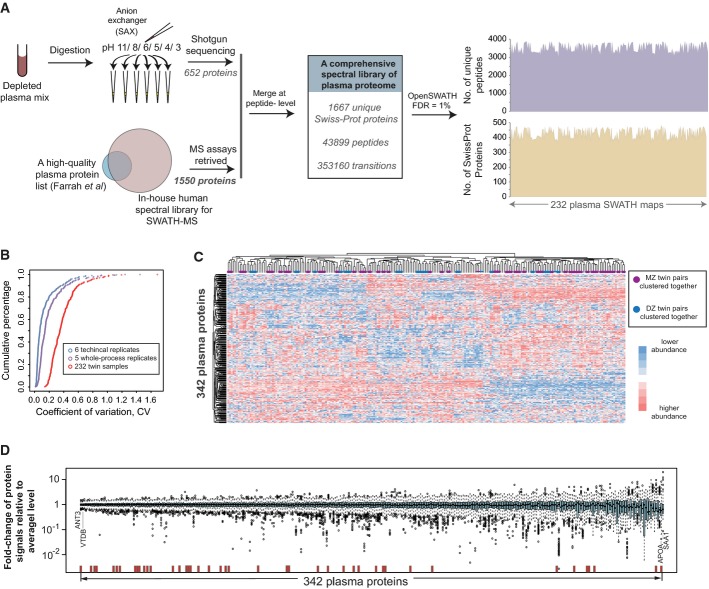
A The establishment of a comprehensive, specific spectral library of human plasma proteome that is ready for SWATH-MS analysis. The reference spectra were generated a priori by extensive shotgun proteomic sequencing of fractionated plasma peptides and complemented with spectra of additional known plasma proteins (Farrah et al, 2011).
B The coefficient of variance (CV) analysis at technical, whole-process experimental and cohort levels.
C Heatmap of hierarchical clustering analysis of the protein vs. sample matrix indicates that plasma proteins were reproducibly quantified by SWATH-MS across the sample cohort.
D The distribution of the fold changes of protein SWATH-MS intensities from their average abundance levels across the cohort is shown as box plots. Antithrombin III (ANT3) and vitamin D-binding protein (VTDB) are shown as examples of the most stable proteins, whereas apolipoprotein(a) (APOA) and serum amyloid A-1 protein (SAA1) are shown as examples of the most variable proteins. The red bars show the positions of the protein analytes whose measurement has been cleared or approved by FDA in human blood.
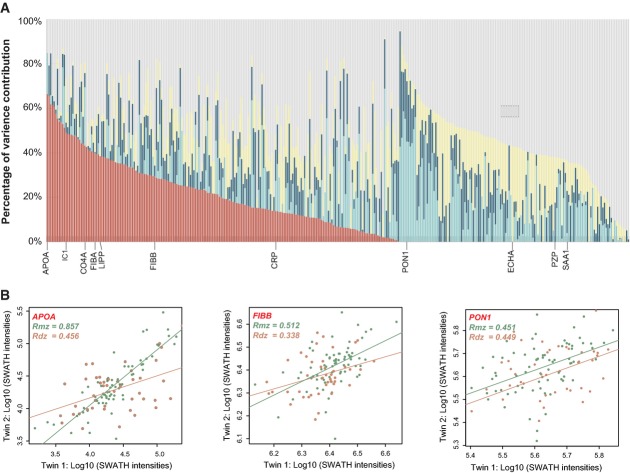
A Histograms of contribution percentage of each biological component (red: heritability; light blue: common environment; dark blue: individual environment; yellow: longitudinal effects; gray: unexplained fraction) determined by a linear mixed model based on the longitudinal twin design. Selected protein names are shown for those clinically assayed proteins with the most heritable levels, for example, APOA, plasma protease C1 inhibitor (IC1), complement C4-A (CO4A), fibrinogen alpha chain (FIBA) and pancreatic triacylglycerol lipase (LIPP), and for the most variable proteins among the cohort, for example, SAA1, APOA, pregnancy zone protein (PZP), trifunctional enzyme subunit alpha (ECHA) and C-reactive protein (CRP).
B Examples of protein abundance correlations between MZ and DZ pairs. Fibrinogen beta chain (FIBB), Serum paraoxonase/arylesterase 1 (PON1).
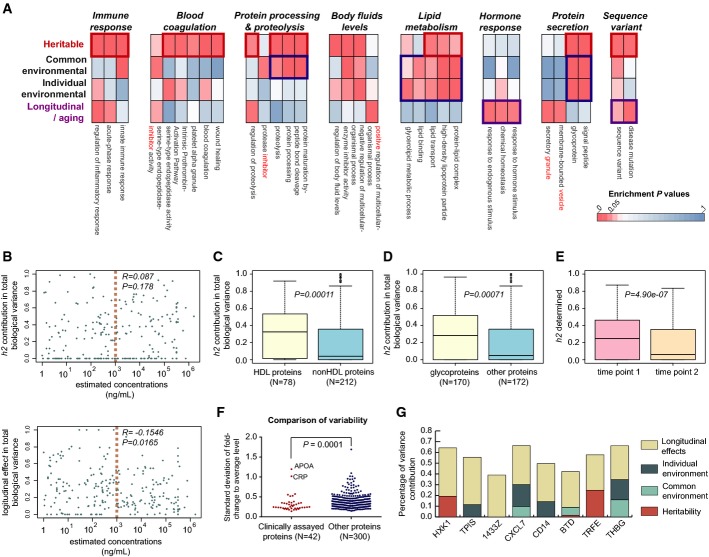
A Enrichment analysis of pathways and biological processes regulated by the four biological components was performed. The results were compiled into clusters according to the functional annotation of proteins.
B Low correlation between plasma protein levels extracted from PeptideAtlas (
www.peptideatlas.org ) and their heritability contributing percentages in biological variance indicating the lack of an abundance bias. In contrast to that, concentration variability of more abundant proteins is generally less affected by longitudinal factors. The light red dashed line indicates the protein concentration of 1 μg/ml, which separates the proteins into two abundance classes.C Comparison of high-density lipoproteins (HDLs) and other proteins, using the heritability contributing percentages in biological variance of the plasma protein levels.
D Comparison of heritability contributing percentages in biological variance between those proteins annotated as glycoproteins and other proteins. P-values are determined by Wilcoxon rank-sum test.
E Decreasing trend of heritability control in plasma protein levels along with 5-year longitudinal process.
F Clinically assayed proteins generally show lower quantitative variability compared to other plasma proteins with few exceptions, for example, CRP and APOA.
G Examples of previously reported protein biomarker candidates, the plasma abundance levels of which were highly regulated by longitudinal effects. These include hexokinase-1 (HXK1), triosephosphate isomerase (TPIS), 14-3-3 protein zeta/delta (1433Z), platelet basic protein (CXCL7), monocyte differentiation antigen CD14 (CD14), biotinidase (BTD), serotransferrin (TRFE) and thyroxine-binding globulin (THBG).
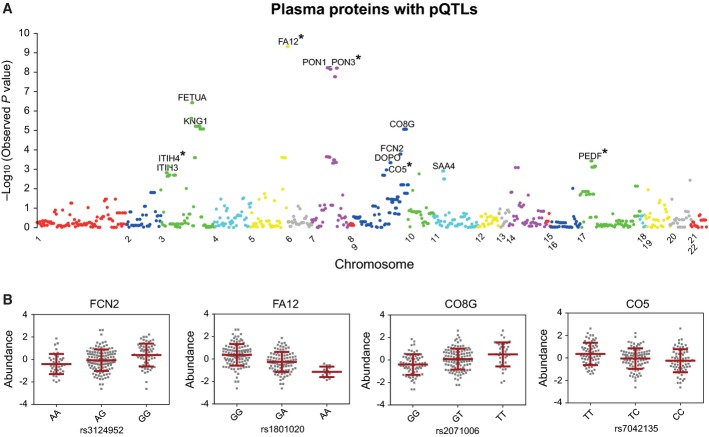
A Manhattan plot of the best P-value per gene, highlighting the 13 statistically significant pQTL associations. The asterisks indicate that the corresponding eQTLs were found in human tissues. The cutoff of the P-value is 6.166e-3.
B Examples of pQTLs: plasma protein levels among the cohort of four proteins associated with innate immune response distributed by distinct genotypes of the SNPs (see Supplementary Table S3 for all abbreviations of protein names).
References
-
- Aebersold R, Anderson L, Caprioli R, Druker B, Hartwell L, Smith R. Perspective: a program to improve protein biomarker discovery for cancer. J Proteome Res. 2005;4:1104–1109. - PubMed
-
- Anderson NL. The clinical plasma proteome: a survey of clinical assays for proteins in plasma and serum. Clin Chem. 2010;56:177–185. - PubMed
Publication types
MeSH terms
Substances
Grants and funding
LinkOut - more resources
Full Text Sources
Other Literature Sources
Molecular Biology Databases
