. 2015 Feb 5;16(1):41.
doi: 10.1186/s12864-015-1230-0.

Integrating transcriptomics and proteomics to show that tanshinone IIA suppresses cell growth by blocking glucose metabolism in gastric cancer cells

Affiliations

Integrating transcriptomics and proteomics to show that tanshinone IIA suppresses cell growth by blocking glucose metabolism in gastric cancer cells

Li-Ling Lin et al. BMC Genomics. .

Abstract

Background: Tanshinone IIA (TIIA) is a diterpene quinone extracted from the plant Danshen (Salvia miltiorrhiza) used in traditional Chinese herbal medicine. It has been reported to have anti-tumor potential against several kinds of cancer, including gastric cancer. In most solid tumors, a metabolic switch to glucose is a hallmark of cancer cells, which do this to provide nutrients for cell proliferation. However, the mechanism associated with glucose metabolism by which TIIA acts on gastric cancer cells remains to be elucidated.

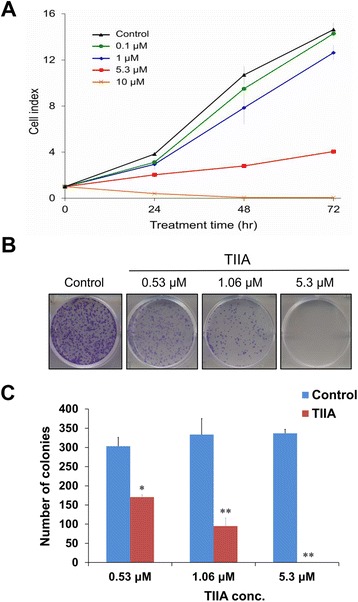
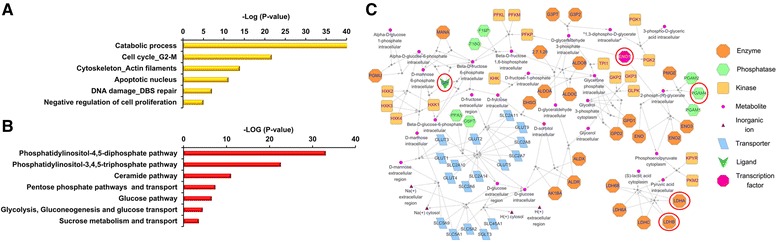
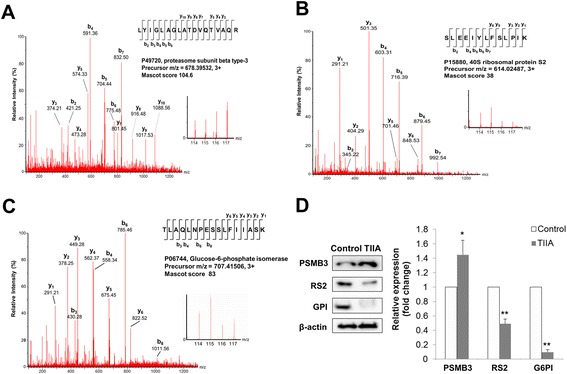
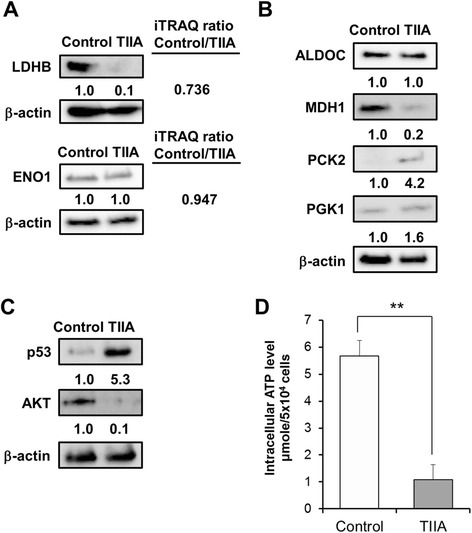
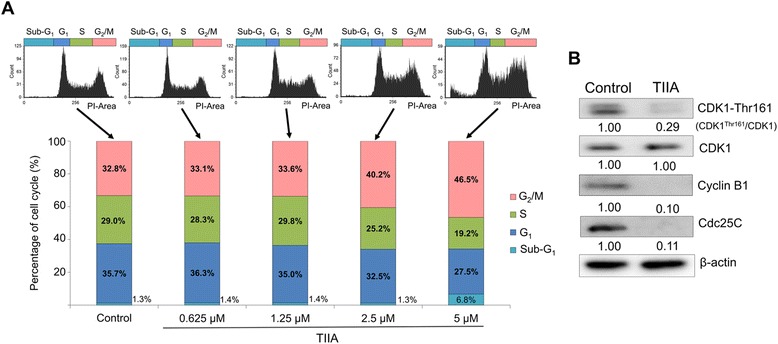
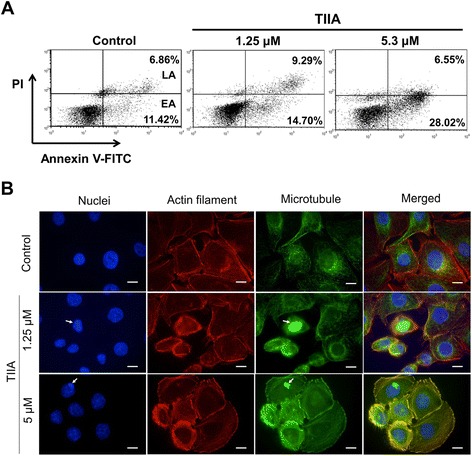
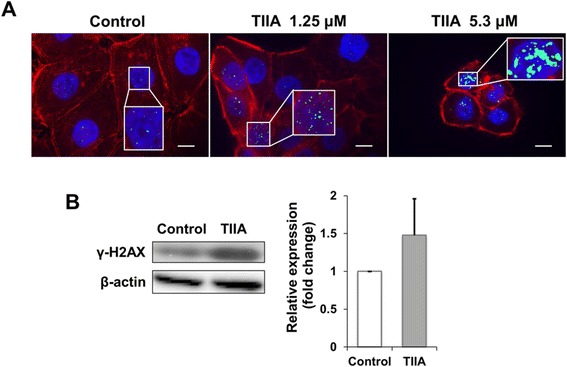
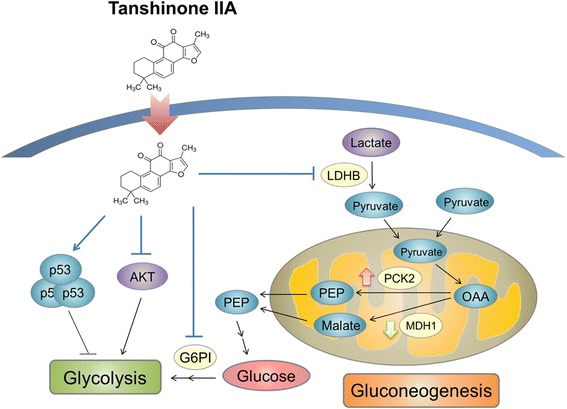
Results: We found that TIIA treatment is able to significantly inhibit cell growth and the proliferation of gastric cancer in a dose-dependent manner. Using next-generation sequencing-based RNA-seq transcriptomics and quantitative proteomics-isobaric tags for relative and absolute quantification (iTRAQ), we characterized the mechanism of TIIA regulation in gastric cancer cell line AGS. In total, 16,603 unique transcripts and 102 proteins were identified. After enrichment analysis, we found that TIIA regulated genes are involved in carbohydrate metabolism, the cell cycle, apoptosis, DNA damage and cytoskeleton reorganization. Our proteomics data revealed the downregulation of intracellular ATP levels, glucose-6-phosphate isomerase and L-lactate dehydrogenase B chains by TIIA, which might work with disorders of glucose metabolism and extracellular lactate levels to suppress cell proliferation. The up-regulation of p53 and down-regulation of AKT was shown in TIIA- treated cells, which indicates the transformation of oncogenes. Severe DNA damage, cell cycle arrest at the G2/M transition and apoptosis with cytoskeleton reorganization were detected in TIIA-treated gastric cancer cells.

Conclusions: Combining transcriptomics and proteomics results, we propose that TIIA treatment could lead cell stresses, including nutrient deficiency and DNA damage, by inhibiting the glucose metabolism of cancer cells. This study provides an insight into how the TIIA regulatory metabolism in gastric cancer cells suppresses cell growth, and may help improve the development of cancer therapy.


Figures

Figure 1
Figure 1
Effects of TIIA on cell growth and proliferation of AGS cells. (A) Growth curves show a dosage-dependent pattern of growth inhibition after TIIA treatment for 72 hr. All TIIA treatment conditions had significant effects on AGS cell growth (p < 0.0001, Wilcoxon Signed-Rank Test). Cell indexes of AGS cells were measured by an RTCA DP® system, expressed as mean ± SD of three replications. (B) Colonies of AGS cells were stained by crystal violet (purple-colored dots) after TIIA treatment. Control conditions exhibit many colonies, while IC50 TIIA conditions have produced almost no colonies. (C) TIIA significantly reduces the number of AGS colonies (*p < 0.05, **p < 0.01, Student’s t-Test) in a dosage-dependent manner. Histogram values are expressed as mean ± SD from three replications.
Figure 2
Figure 2
Enrichment analyses of the biological processes of TIIA-regulated genes. Analysis of TIIA-regulated genes with MetaCore software enriched the biological processes. (A) Classification of all identified genes collected from RNA-seq into process networks. (B) Classification of all identified genes collected from RNA-seq into metabolic networks. (C) The “Glycolysis, gluconeogenesis and glucose transport” network built from (B). Enzymes expressed at RNA-seq and iTRAQ are circled in red for clarity. Significance calculated by MetaCore was plotted as the negative log of the p value.
Figure 3
Figure 3
MS/MS spectra of peptide and protein levels for PSMB3, RS2 and G6PI. MS/MS spectra of peptides from PSMB3 (A), RS2 (B) and G6PI (C) are reported along with iTRAQ ion reporter quantification. Ion, m/z 114 and 115 represent peptides collected from control samples. Ion, m/z 116 and 117 represent peptides collected from TIIA-treated samples. (D) Protein expression levels of PSMB3, RS2 and G6PI were examined using western blotting analysis, with β-actin as an internal control. All experiments were repeated three times with independent samples.
Figure 4
Figure 4
Treatment with TIIA changes the expression of glucose metabolism-related proteins in AGS cells. (A) The expression of iTRAQ-identified proteins, LDHB and ENO1 was estimated using western blotting. (B) The expression of ALDOC, MDH1, PCK2 and PGK1 in AGS cells treated with TIIA was estimated using western blotting. The levels of (C) tumor suppressor gene, p53, and the oncogene AKT, and (D) intracellular ATP, were examined in AGS cells treated with TIIA. β-actin was used as an internal control.
Figure 5
Figure 5
TIIA induces cell cycle arrest at the G 2 /M transition in AGS cells. (A) Flow cytometric analysis shows the distribution of DNA content in AGS cells after 48 h of TIIA treatment. Cellular DNA was stained by PI and analyzed to quantify the percentage of cells in certain cell cycle phases using FCS Express 4. The percentage of AGS cells in the G2/M phase transition increases along with increases in TIIA treatment concentrations, exhibiting a dosage-dependent relationship. The percentage of cells in the sub-G1 phase also increases, from 1.3% (control) to 6.8% (5.3 μM TIIA), suggesting the occurrence of apoptosis. (B) Protein levels of Phospho-CDK (Thr 161), total CDK, cyclin B1 and Cdc 25C were analyzed using western blotting. β-actin was used as an internal control.
Figure 6
Figure 6
TIIA induces apoptosis and reorganization of cytoskeleton in AGS cells. (A) AGS cells were treated with different levels of TIIA (1.25 μM and 5.3 μM). Treated cells were stained with annexin A5 and PI and their apoptotic condition was analyzed by flow cytometry. EA denotes early apoptosis; LA denotes late apoptosis. (B) Images of AGS cells were obtained by fluorescence microscopy after TIIA treatment for 48 hr. Nuclei were stained with DAPI (blue), actin filaments were stained with rhodamine-labeled phalloidin (red), and microtubules were stained with mouse anti-α-tubulin antibody and the corresponding FITC-conjugated secondary anti-mouse IgG antibody (green). Arrows indicate nuclear fragmentation sites with condensed chromatin. Microtubules are densely packed at these sites; this condensation is an important step during the apoptotic process [30]. Scale bars represent 10 μm.
Figure 7
Figure 7
TIIA triggers DNA double-strand breaks in AGS cells. (A) Images of AGS cells were obtained by fluorescence microscopy after 48 hr of TIIA treatment. Nuclei were stained with DAPI (blue), actin filaments were stained with rhodamine-labeled phalloidin (red), and γ-H2AX were stained with mouse anti-γ-H2AX antibody and the corresponding FITC-conjugated secondary anti-mouse IgG antibody (green). Each zoomed panel shows representative γ-H2AX distributions in detail. Scale bars represent 10 μm. (B) Protein expression of γ-H2AX increases under an IC50 dose of TIIA; samples were analyzed by Western blotting with β-actin as internal control. Histogram values for fold change are expressed as mean ± SD from three independent experiments.
Figure 8
Figure 8
Schematic representation of TIIA blocking glucose metabolism in gastric cancer cells. In tumor cells, glucose is consumed to produce ATP, and the glycolytic intermediates are used for biosynthetic pathways. Proto-oncogene, AKT, stimulates glycolysis and the tumor suppression gene, p53, suppresses glucose metabolism via several pathways. After TIIA treatment, intracellular ATP levels and AKT expression decreases, and p53 expression increases. In the second step of glycolysis, glucose-6-phosphate isomerase, acting as an enzyme, was down-regulated by TIIA treatment. We also found that TIIA dysregulates gluconeogenesis by suppressing LDHB and MDH1 expression, and enhancing PCK2 expression. TIIA promotes the activity of these pathways to suppress cancer cell growth.

References

    1. Ferlay J, Shin HR, Bray F, Forman D, Mathers C, Parkin DM. Estimates of worldwide burden of cancer in 2008: GLOBOCAN 2008. Int J Cancer. 2010;127(12):2893–917. doi: 10.1002/ijc.25516. - DOI - PubMed
    1. Carden CP, Sarker D, Postel-Vinay S, Yap TA, Attard G, Banerji U, et al. Can molecular biomarker-based patient selection in phase I trials accelerate anticancer drug development? Drug Discov Today. 2010;15(3–4):88–97. doi: 10.1016/j.drudis.2009.11.006. - DOI - PubMed
    1. Lin R, Wang WR, Liu JT, Yang GD, Han CJ. Protective effect of tanshinone IIA on human umbilical vein endothelial cell injured by hydrogen peroxide and its mechanism. J Ethnopharmacol. 2006;108(2):217–22. doi: 10.1016/j.jep.2006.05.004. - DOI - PubMed
    1. Chen J, Tina C. Chinese medical herbology and pharmacology. CA: Art of Medicine Press Inc; 2001.
    1. Ding M, Zhao GR, Yuan YJ, Guo ZX. Aqueous extract of Salvia miltiorrhoza regulates adhesion molecule expression of tumor necrosis factor alpha-induced endothelial cells by blocking activation of nuclear factor kappaB. J Cardiovasc Pharmacol. 2005;45(6):516–24. doi: 10.1097/01.fjc.0000159643.82641.e9. - DOI - PubMed

MeSH terms